ssas ssrs_如何使用SSAS表格模型数据库创建简单的SSRS报告
ssas ssrs
In this article, we will show how to create a simple SQL Server Reporting Services report from a SSAS Tabular model database as a data source, using DAX query, and then deploy it.
在本文中,我们将展示如何使用DAX查询从SSAS表格模型数据库作为数据源创建一个简单SQL Server Reporting Services报表,然后进行部署。
For this example, the requirements include SQL Server Data Tools version 2013 or higher, SQL Server version 2014 or higher, with installed SQL Server Reporting Services instance in Native mode (used in this article) and SQL Server Analysis Services instance in Tabular mode with deployed Tabular model database.
对于此示例,要求包括SQL Server Data Tools版本2013或更高版本,SQL Server版本2014或更高版本,并以纯模式 (本文中使用)安装了SQL Server Reporting Services实例(已在本文中使用),并且以表格模式安装了SQL Server Analysis Services实例(已部署)表格模型数据库。
All of the steps of creating and deploying the customized SSRS report take place fully in SSDT.
创建和部署自定义SSRS报告的所有步骤完全在SSDT中进行。
Creating a Report Server project
创建报表服务器项目
Create a new Report Server Project and give it a custom name and solution name (for this occasion, Tabular2Report). This is the base for the future SSRS report.
创建一个新的Report Server Project并为其指定一个自定义名称和解决方案名称(本例中为Tabular2Report )。 这是将来SSRS报告的基础。

After creating the project file, these elements should appear in Solution explorer docked window:
创建项目文件后,这些元素应出现在“解决方案资源管理器”停靠的窗口中:
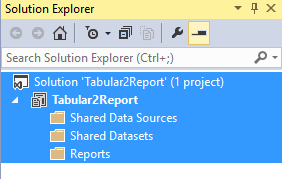
The file Tabular2Report (below Solution) is the actual Report Server project. It contains separate shared folders for data sources, datasets and report definition files.
Tabular2Report文件(位于解决方案下方)是实际的Report Server项目。 它包含用于数据源 , 数据集和报告定义文件的单独的共享文件夹。
Adding Data Source
添加数据源
Right-click on folder Shared Data Sources and select the Add New Data Source:
右键单击文件夹共享数据源,然后选择添加新数据源:
The Shared Data Source Properties dialog appears:
出现“共享数据源属性”对话框:
In General tab, set the name (or leave a default), choose type of data source (in this case, that will be Microsoft SQL Server Analysis Services), and input the connection string, regarding this form:
在“常规”选项卡中,设置名称 (或保留默认值),选择数据源的类型 (在这种情况下,将为Microsoft SQL Server Analysis Services ),然后输入与此格式有关的连接字符串:
Data Source=localhost\\<name of the SSAS Tabular instance>;Initial Catalog="<name of the cube>"Note: The actual source of data is a SSAS Tabular instance, and the cube is considered as a “catalog”. SSRS catalog contains all objects and data related to SSRS, including shared data source, shared datasets and report definition.
注意 :实际数据来源是SSAS表格实例,并且多维数据集被视为“目录”。 SSRS目录包含与SSRS相关的所有对象和数据,包括共享数据源,共享数据集和报告定义。
Alternatively, a data source can be set by editing a connection string in the Connection Properties dialog (click the Edit button, shown in picture above):
或者,可以通过在“连接属性”对话框中编辑连接字符串来设置数据源(单击“ 编辑”按钮,如上图所示):
Note: To verify the validity of the chosen server instance and database, click on “Test connection” button.
注意 :要验证所选服务器实例和数据库的有效性,请单击“测试连接”按钮。
After that, set a valid credential for SSAS Tabular database in Credentials tab:
之后,在“ 凭据”选项卡中为SSAS表格数据库设置有效的凭据:
For this occasion, Windows authentication with integrated security will be used.
在这种情况下,将使用具有集成安全性的Windows身份验证。
Adding Dataset
添加数据集
Add a dataset within right-click on Shared Datasets folder:
在“共享数据集”文件夹上单击鼠标右键,添加一个数据集:
The Shared Dataset Properties dialog will appear. In the Query tab, click on Query Designer button:
将显示“ 共享数据集属性”对话框。 在查询选项卡中,单击查询设计器按钮:
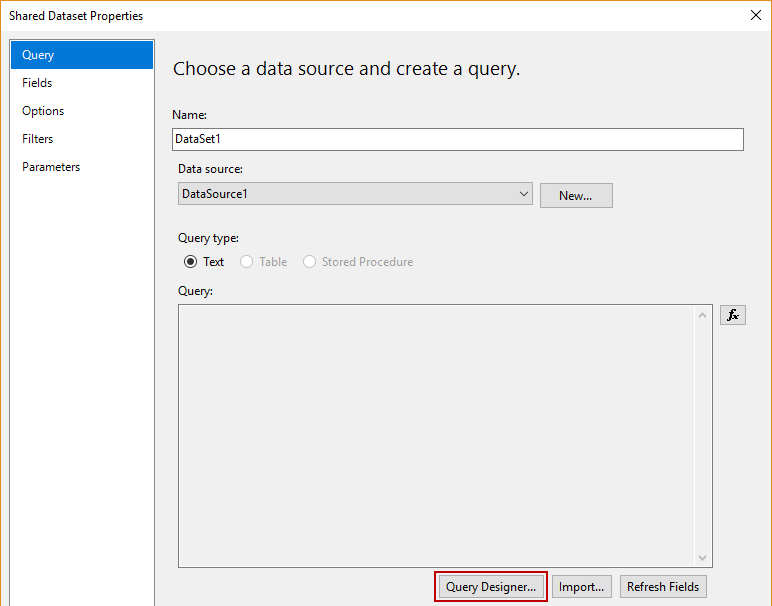
The Dataset for this project will be created through DAX query in query designer:
该项目的数据集将通过查询设计器中的DAX查询创建:
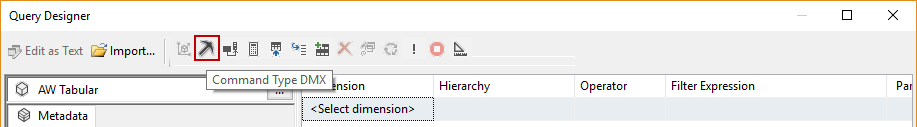
At this moment, query designer holds MDX queries by default, so Command type DMX must be set:
目前,查询设计器默认保存MDX查询,因此必须设置命令类型DMX :
Note: SSAS Tabular model supports DMX extension, which is query language for data mining models. In this case, Tabular database will be considered as a mining model, in order to override the limitation of using DAX query in SSDT.
注意 :SSAS表格模型支持DMX扩展 ,这是数据挖掘模型的查询语言。 在这种情况下,表格数据库将被视为挖掘模型,以克服在SSDT中使用DAX查询的限制。
Click Command type DMX and confirm:
单击命令类型DMX并确认 :
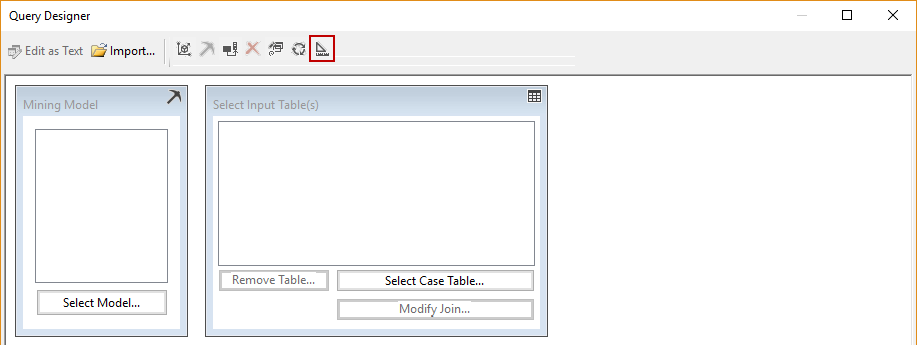
After confirmation, switch to the Design mode, by clicking button as shown:
确认后,通过单击按钮切换到“ 设计”模式 ,如下所示:
Input this DAX query below into specified field and confirm:
在下面的指定字段中输入此DAX查询并确认:
evaluate(summarize('Internet Sales','Product'[Product Name],'Date'[Calendar Year],"Total Sales Amount", sum('Internet Sales'[Sales Amount])))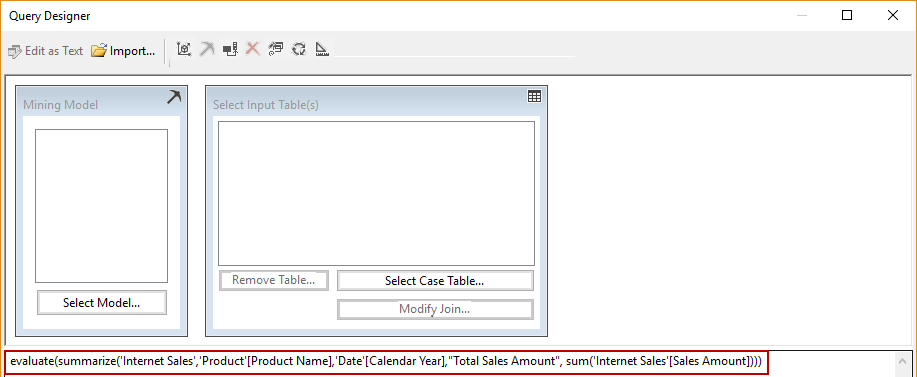
This query retrieves and wraps up the following objects from the cube into dataset: full table Internet Sales, columns Product Name (from Product table) and Calendar Year (from Date table) and the calculated measure Total Sales Amount.
该查询从多维数据集中检索以下对象并将其包装到数据集中:完整表Internet Sales ,列Product Name (来自Product表)和Calendar Year (来自Date表)以及计算得出的度量Total Sales Amount 。
After confirmation, double-click on the created Dataset, which shows in Solution explorer:
确认后,双击创建的数据集,该数据集显示在解决方案资源管理器中:
Go to the Fields tab, and rename Field Name strings as shown in the picture below, and confirm:
转到“ 字段”选项卡,并如下图所示重命名“ 字段名称”字符串,然后确认:
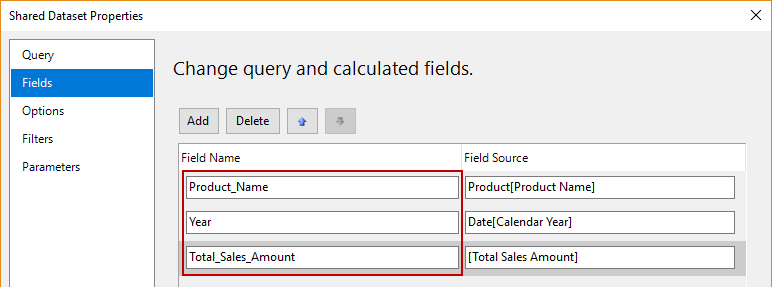
With simplified field names like this, it will be easier to use them in report designing.
使用这样的简化字段名称,将更易于在报表设计中使用它们。
Note: Space character cannot be used when renaming, because it raises error.
注意 :重命名时不能使用空格字符,因为它会引起错误。
Creating a report definition file
创建报告定义文件
Create a report definition with right-click on Reports folder:
右键单击“报告”文件夹来创建报告定义:
Previously set Shared Data source should appear in Report Wizard dialog:
先前设置的共享数据源应出现在“报表向导”对话框中:
In the next step, click on Query Builder button:
在下一步中,单击“查询生成器”按钮:
Note: In Query Builder, the Command type DMX and Design Mode options must be chosen, one after another, in order to successfully insert the query (see Add Dataset section of this article)
注意 :在查询生成器中,必须依次选择“ 命令类型DMX”和“ 设计模式”选项,以便成功插入查询(请参见本文的“ 添加数据集”部分)
Input the query, same as the one mentioned before:
输入查询,与前面提到的查询相同:
evaluate(summarize('Internet Sales','Product'[Product Name],'Date'[Calendar Year],"Total Sales Amount", sum('Internet Sales'[Sales Amount])))After that, select the Tabular type of report:
之后,选择报表的表格类型:
From this point, as shown in the picture below, Report Wizard leads through a basic table design. In this article, we will leave default settings for report building, by clicking Finish:
至此,如下图所示,报表向导将引导您进行基本的表设计。 在本文中,我们将通过单击Finish保留用于生成报告的默认设置:
Next step is summary of the future SSRS report:
下一步是将来的SSRS报告的摘要:
Set a custom name (in this case, it is Tabular2Report), review the report summary and then confirm the creation of the report definition file.
设置一个自定义名称(在本例中为Tabular2Report ),查看报告摘要,然后确认创建报告定义文件。
Tabular2Report customization
Tabular2Report自定义
After successful creation of three necessary files for this Report project, they will appear in the Solution Explorer:
成功创建此报告项目的三个必需文件后,它们将出现在解决方案资源管理器中:
Tabular2Report report definition already has predefined design, as shown in the picture below:
Tabular2Report报表定义已经具有预定义的设计,如下图所示:
The elements of the report definition design are fully customizable (tables, cells and other elements). As can be seen, there is a label with a name of the file and table with the header and corresponding cells which contain the elements from the Report Data docked window (placed left in the picture above).
报表定义设计的元素是完全可定制的 (表,单元格和其他元素)。 可以看到,有一个带有文件名和表名的标签,以及标题和对应的单元格,其中包含来自“报表数据”停靠窗口的元素(位于上图的左侧)。
After a customization, Tabular2Report design looks like this:
定制后,Tabular2Report设计如下所示:
Beneath table header, these cells contain the parts of defined dataset, columns Product Name, Year and calculated measure Total Sales Amount, which will correspond with the DAX query.
在表格标题下,这些单元格包含定义的数据集, 产品名称 , 年份列和计算的度量总销售金额的部分 ,这些部分将与DAX查询相对应。
To see fully generated report, click the Preview tab:
要查看完整生成的报告,请单击“预览”选项卡:
Notice that tabular view expands and show all of the rows within tables, and also the calculated measure shows the results.
请注意,表格视图会展开并显示表中的所有行,并且计算得出的度量也会显示结果。
We will add a currency symbol in rows from Total Sales column, by right-click on the Text Box properties:
我们将在“总销售额”列的行中添加货币符号,方法是右键单击“文本框”属性:
In Number tab, Currency category, set that currency symbol stands before value, as shown in the picture below, and confirm:
在“ 数字”选项卡的“ 货币”类别中,设置货币符号位于值之前,如下图所示,并确认:
Now look the report in Preview tab, as the currency sign is present:
现在,在存在货币符号的情况下,在“预览”选项卡中查看报告:
Deploying files to the Report Server
将文件部署到报表服务器
To deploy Data Source, Dataset and the Report definition file itself, set the target URL of Report Server, within properties:
要部署数据源 , 数据集和报表定义文件本身,请在属性中设置报表服务器的目标URL:
Build and deploy every particular file from the project: DataSource1.rds, Dataset1.rsd, and Tabular2Report.rdl.
构建和部署项目中的每个特定文件: DataSource1.rds , Dataset1.rsd和Tabular2Report.rdl 。
Note: If Target URL is not reachable or invalid, troubleshoot the Report Server
注意 :如果目标URL不可访问或无效,请对报表服务器进行故障排除
After successful deployment, all these files should appear the Report Server folder:
成功部署后,所有这些文件应显示在“报表服务器”文件夹中:
Also, the report can be rendered in a browser, to see it in its entirety:
同样,可以在浏览器中呈现报告,以完整查看报告:
I hope you enjoyed creating a simple SSRS report from a SSAS Tabular database!
希望您喜欢从SSAS表格数据库创建简单的SSRS报告!
参考资料 (References)
- How to create a SQL Server Reporting Services (SSRS) report如何创建SQL Server报告服务(SSRS)报告
- Create a Basic Table Report (SSRS Tutorial) 创建基本表报告(SSRS教程)
- Getting Started in Report Designer (SSRS)报表设计器(SSRS)入门
翻译自: https://www.sqlshack.com/create-simple-ssrs-report-using-ssas-tabular-model-database/
ssas ssrs
ssas ssrs_如何使用SSAS表格模型数据库创建简单的SSRS报告相关推荐
- ssas表格模型 权限控制_创建第一个SSAS表格模型数据库
ssas表格模型 权限控制 Considering BI environment, when comparing Multidimensional Vs Tabular model databases ...
- ssas表格模型 权限控制_如何使用DAX函数查询SSAS表格模型数据库
ssas表格模型 权限控制 To make the first steps into the BI world easier, you just need to build one SSAS Tabu ...
- java中怎么创建表格_Java中的表格怎么利用表格模型进行创建
Java中的表格怎么利用表格模型进行创建 发布时间:2020-12-03 16:44:43 来源:亿速云 阅读:89 作者:Leah 本篇文章给大家分享的是有关Java中的表格怎么利用表格模型进行创建 ...
- jsp创建mysql数据库_使用 MySQL 数据库创建简单的 JSP 应用程序(1)
使用 MySQL 数据库创建简单的 Web 应用程序 编写人:Troy Giunipero 本文档描述了如何创建用于连接 MySQL 数据库服务器的简单 Web 应用程序.还讲述了 Web 开发中的一 ...
- 如何建立分类模型matlab,创建简单模型
- MATLAB Simulink
- MathWorks 中国
创建简单模型 您可以使用 Simulink® 来对系统建模,然后仿真该系统的动态行为.本教程中创建简单模型所使用的基本方法也适用于创建更复杂的模型.此示例对简化的汽车运动进行仿真.当踩下油门踏板时,汽 ...
- mysql怎么创建窗口应用程序,使用 MySQL 数据库创建简单的 Web 应用程序
index.jsp 要在 index.jsp 中动态显示窗体的内容,您需要从 Subject 数据库表访问所有 name. 将鼠标悬停在 "Palette"(组件面板)中的 &qu ...
- CAD数据库 创建简单的对象
1.介绍每个AutoCAD图样代表保存了几种类型对象的结构化数据库.当你打开一个新的图样时,AutoCAD会在后台创建一个组织过并且高效的数据库.这个数据库拥有最少允许你创建基本图形的数据. 这个最少 ...
- ssas表格模型 权限控制_Analysis Services(SSAS)表格模型中的时间智能
ssas表格模型 权限控制 In the analytical world, time is an important slicer. The ability to view data over ti ...
- ssas表格模型 权限控制_如何在SQL Server 2016中自动执行SSAS表格模型处理
ssas表格模型 权限控制 There are many ways to process your SSAS Tabular Model. This can be achieved in SSIS u ...
最新文章
- Pandas可视化综合指南:手把手从零教你绘制数据图表
- Git/TortoiseGit使用
- 运营商视角的物联网商业模式-物联网操作系统篇
- 无需Grouping,中科大和微软亚研院提出Group-Free的三维物体检测方法,性能远超之前最好方法。...
- boost::container_hash模块实现哈希图
- java关于泛型的实验代码_[改善Java代码]强制声明泛型的实际类型
- uboot源码——mmc驱动分析
- Android 程序调试
- python基础运用_python基础----python的使用(三)
- Linux入门学习(十 三)—— 怎么给指定用户发送信息? 怎么发送广播消息?
- 嵌入式学习代码总结(二)
- 多少程序员的梦想职位,成为阿里P7真的就这么难吗-学会这些就够了
- 在一起盗窃案中,法官对涉及到的四名犯罪嫌疑人A,B,C,D进行了审问.
- Android开发——错误:远程主机强迫关闭一个现有连接——解决办法
- 中文名字和英文名字正则匹配
- Vue父组件与子组件传递事件/调用事件
- HFSS 微带线验证和仿真
- 哪里有纯免费的PPT模板下载网站?
- 佐治亚理工学院计算机科学硕士,佐治亚理工学院
- hive数据库操作大全