The Grammer of Graphics 读书笔记 - How To Make a Pie
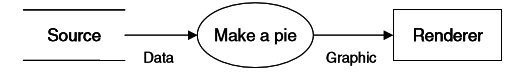
Under the grammar of graphics, the internal processes of “Make a pie” are shown in more detail. These internal processes constitute the syntax of the grammar of graphics.

As a data flow diagram, it simply shows what the stages are, how they must be ordered,and what data are required along the way. This figure gives us the ingredients and the dependencies among the series of “orthogonal” object diagrams abstracted from the OO system. But it does not tell us how to assemble the ingredients.
Then we provide some elementary definitions of terms so that we can assemble ingredients.
2.1 Definitions
2.1.1 Sets
A set is a collection of unique objects. An object in a set is called an element or a member of the set.
2.1.2 Relations
Binary relations
2.1.3 functions
Function or mapping from set A to set B.
2.1.4 Graphs
2.1.5 Compositions
2.1.6 Transformations
2.1.7 Algebras
2.1.8 Variables
2.1.9 Varset
2.1.10 Frames
2.2 Recipe
data:

2.2.1 Create Variables
Extract data into variables. There are many ways of doing that, like creating from relational database, indexing a stream of data… for the example pie, we simply load the data from the database whose form is organized as:
Extracting data with the following query:
Which equals to:
Response = SELECT bias_toward_males, case FROM ACLS;
Gender = SELECT Gender, case FROM ACLS;
For our pie, we get variables below:

2.2.2 Apply Algebra
A general definition of an algebra is given in Section 2.1.7. Chapter 5 defines a graphics algebra consisting of three operators — cross, blend and nest—applied to a set of variables, together with a set of associated rules. The output of the algebra is a varset.
Last step made two separate variables, we need to combine them into one variable so that the rows are associated with each other:

2.2.3 Apply Scales
The categorical variables Response and Gender must have a defined order. A categorical scale transformation associates the values of a categorical variable with the set of integers.

2.2.4 Compute Statistics
Our system will ultimately make one graphical element per row of a varset. For the pie example, we need to reduce the number of cases by doing some statistics.
In the pie example, each Gender is a whole, and the aggregated variable is Response:

2.2.5 Construct Geometry

2.2.6 Apply Coordinates
To make pie wedges, we apply a polar transformation to the shapes that were
produced from the geometry. We send (x, y) to (r, theta) for the shapes.
2.2.7 Compute Aesthetics
Aesthetic functions translate a graph into a graphic. (like position, color and label)
2.3 Notation
2.3.1 Specifications
For any graphic, the expression, attributes, and graphs will be represented
in a multi-line notation that comprises the specification.
the first line(s) contain the DATA functions that create variables from data.
the second line(s) give the TRANS specifications that define the transformation to be applied to the variables.
the third line(s) are the SCALE specifications that specify dimensions on which the graphs will orient themselves.
the forth line(s) is the COORD specification that defines the coordinate system in which
the graphs are to be embedded.
the remaining lines contain the geometric graphing functions for the graphs appearing in the frame. (ELEMENT)
example: a 2-D scatterplot :
DATA: x = x
DATA: y = y
TRANS: x = x
TRANS: y = y
SCALE: linear(dim(1))
SCALE: linear(dim(2))
COORD: rect(dim(1, 2))
GUIDE: axis(dim(1))
GUIDE: axis(dim(2))
ELEMENT: point(position(x*y))
The Grammer of Graphics 读书笔记 - How To Make a Pie相关推荐
- 《3D Math Primer for Graphics and Game Development》读书笔记1
<3D Math Primer for Graphics and Game Development>读书笔记1 本文是<3D Math Primer for Graphics and ...
- 《Computer Graphics with OpenGL》计算机图形学读书笔记 02——计算机图形学软件
这里是<Computer Graphics with OpenGL>英文原版第四版的读书笔记,预计每一章写一篇读书笔记.本篇为第二章,简要介绍计算机图形学的相关软件.图形学相关软件可分为两 ...
- 《Real-Time Rendering 4th Edition》读书笔记--简单粗糙翻译 第二章 渲染管线 The Graphics Rendering Pipeline
写在前面的话:因为英语不好,所以看得慢,所以还不如索性按自己的理解简单粗糙翻译一遍,就当是自己的读书笔记了.不对之处甚多,以后理解深刻了,英语好了再回来修改.相信花在本书上的时间和精力是值得的. -- ...
- R语言ggplot2移除图例_读书笔记:R语言绘图—ggplot2
这次给大家带来的是R语言绘图神器-ggplot2绘图包,根据Hadley的说法,这个包的核心思想,是来源于 Leland Wilkinson<The Grammar of Graphics> ...
- 读书笔记——数据压缩入门(柯尔特·麦克安利斯)下
文章目录 数据压缩入门汇总 第九章 数据建模 9.1 马尔科夫链 9.2 部分匹配预测算法PPM 9.2.1 单词查找树 9.2.2 字符的压缩 9.2.3 选择一个合理的N值 9.2.4 处理未知的 ...
- 鸟哥的linux私房菜-基础学习篇 读书笔记
从事linux工作一年多,算是能够熟练运用linux服务器,但仍觉得自己对Linux的原理,理论缺乏空洞,潜下心来认真阅读尘封的鸟哥经典,知识点很全,收获颇多,实践与知识结合,知行合一,对linux开 ...
- iPhone与iPad开发实战读书笔记
iPhone开发一些读书笔记 手机应用分类 1.教育工具 2.生活工具 3.社交应用 4.定位工具 5.游戏 6.报纸和杂志的阅读器 7.移动办公应用 8.财经工具 9.手机购物应用 10.风景区相关 ...
- 鸟哥的LINUX私房菜 基础学习篇 读书笔记 -- 第零章 计算机概论 (一)
鸟哥的LINUX私房菜 基础学习篇 读书笔记 -- 第零章 计算机概论 (一) 第零章 计算机概论 0.1 电脑:辅助人脑的好工具 0.1.1 计算机硬件五大组成部分 0.1.2 一切设计的起点: C ...
- (swing读书笔记)Swing Look And Feel(3)
(swing读书笔记)Swing Look And Feel(3) By cszhao1980 六.UIResource UIResource是个空接口,它的目的是为标识一种身份,即是否为UI Res ...
最新文章
- python函数参数列表_python函数的列表参数传递
- Deployment,configuration and management Microsoft Windows Server win2003 cluster
- CF1251F-Red-White Fence【NTT】
- html暂停计时器,JS实现可暂停秒表计时器效果的方法
- mysql二进制安装shell脚本,一分钟就搞好linux上的mysql
- 警惕:ERP系统不堪重负的几大预警信号
- windows下mysql高可用_[@小川游鱼][¥20]Windows平台MySQL高可用方案-问答-阿里云开发者社区-阿里云...
- 【智能家居】智能单火开关目前普遍存在的问题
- 【田间连着车间、佘太酒业这十年!
- Element 表单校验方法简单抽离
- 如何在Jetson NANO上安装无线WIFI模块
- wireshark分析无线wifi包
- MTK 6737 android6.0 user版本打开root权限(adb root权限和 apk root权限)
- 关于安全领域方向上学习的一点个人见解
- C#/.NET 将中文符号转为英文符号
- ros学习之多机器人导航(仿真)
- 分享Silverlight/WPF/Windows Phone/HTML5一周学习导读(12月26日-1月1日)
- Unity3D摄像机,键盘控制前后左右上下移动,鼠标控制旋转、放缩
- Android V1签名与校验原理分析(全网最全最详细)
- 虚拟机挂起以后无法Resum