Python:在Pandas数据框中查找缺失值
How to find Missing values in a data frame using Python/Pandas
如何使用Python / Pandas查找数据框中的缺失值
介绍: (Introduction:)
When you start working on any data science project the data you are provided is never clean. One of the most common issue with any data set are missing values. Most of the machine learning algorithms are not able to handle missing values. The missing values needs to be addressed before proceeding to applying any machine learning algorithm.
当您开始从事任何数据科学项目时,所提供的数据永远不会干净。 任何数据集最常见的问题之一就是缺少值。 大多数机器学习算法无法处理缺失值。 在继续应用任何机器学习算法之前,需要解决缺少的值。
Missing values can be handled in different ways depending on if the missing values are continuous or categorical. In this section I will address how to find missing values. In the next article i will address on how to address the missing values.
根据缺失值是连续的还是分类的,可以用不同的方式来处理缺失值。 在本节中,我将介绍如何查找缺失值。 在下一篇文章中,我将介绍如何解决缺失值。
查找缺失值: (Finding Missing Values:)
For this exercise i will be using “listings.csv” data file from Seattle Airbnb data. The data can be found under this link : https://www.kaggle.com/airbnb/seattle?select=listings.csv
在本练习中,我将使用Seattle Airbnb数据中的“ listings.csv”数据文件。 可以在以下链接下找到数据: https : //www.kaggle.com/airbnb/seattle?select=listings.csv
Step 1: Load the data frame and study the structure of the data frame.
步骤1:加载数据框并研究数据框的结构。
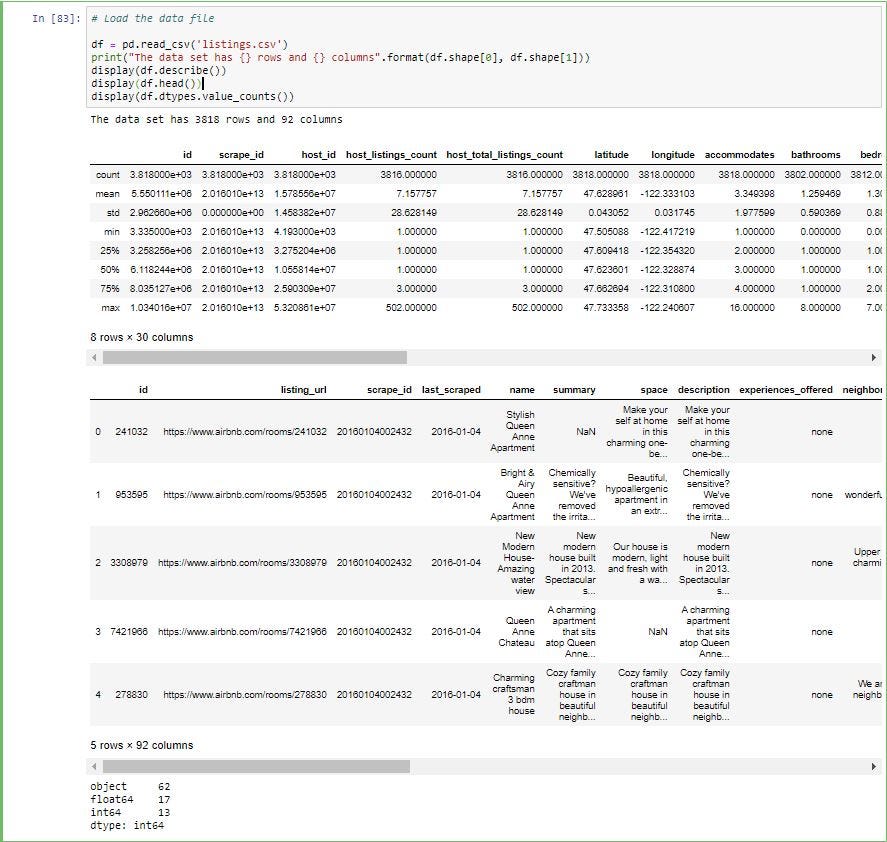
First step is to load the file and look at the structure of the file. When you have a big dateset with high number of columns it is hard to look at each columns and study the types of columns.
第一步是加载文件并查看文件的结构。 如果日期集较大且列数很高,则很难查看每个列并研究列的类型。
To find out how many of the columns are categorical and numerical we can use pandas “dtypes” to get the different data types and you can use pandas “value_counts()” function to get count of each data type. Value_counts groups all the unique instances and gives the count of each of those instances.
要了解有多少列是分类列和数字列,我们可以使用pandas“ dtypes”来获取不同的数据类型,还可以使用pandas“ value_counts()”函数来获取每种数据类型的计数。 Value_counts对所有唯一实例进行分组,并给出每个实例的计数。
As you can see below we have 62 columns which are objects (categorical data), 17 columns which are of float data type and 13 columns which are of int data type.
如下所示,我们有62列是对象(分类数据),有17列是浮点数据类型,有13列是int数据类型。

Step 2: Separate categorical and numerical columns in the data frame
步骤2:将数据框中的类别和数字列分开
The reason to separate the categorical and numerical columns in the data frame is the method of handling missing values are different between these two data type which i will walk through in the next section.
在数据框中分隔类别和数字列的原因是,这两种数据类型之间处理缺失值的方法不同,我将在下一节中介绍这些方法。
The easiest way to achieve this step is through filtering out the columns from the original data frame by data type. By using “dtypes” function and equality operator you can get which columns are objects (categorical variable) and which are not.
实现此步骤的最简单方法是按数据类型从原始数据帧中过滤出列。 通过使用“ dtypes”函数和相等运算符,您可以了解哪些列是对象(分类变量),哪些不是。

To get the column names of the columns which satisfy the above conditions we can use “df.columns”. The below code gives column names which are objects and column names which are not objects.
要获得满足上述条件的列的列名,我们可以使用“ df.columns”。 下面的代码给出了作为对象的列名和不是对象的列名。
As you can see below we separated the original data frame into 2 and assigned them new variables. One for for categorical variables and one for non-categorical variables.
如下所示,我们将原始数据帧分为2个并为其分配了新变量。 一种用于分类变量,另一种用于非分类变量。

Step 3: Find the missing values
步骤3:找出遗漏的值
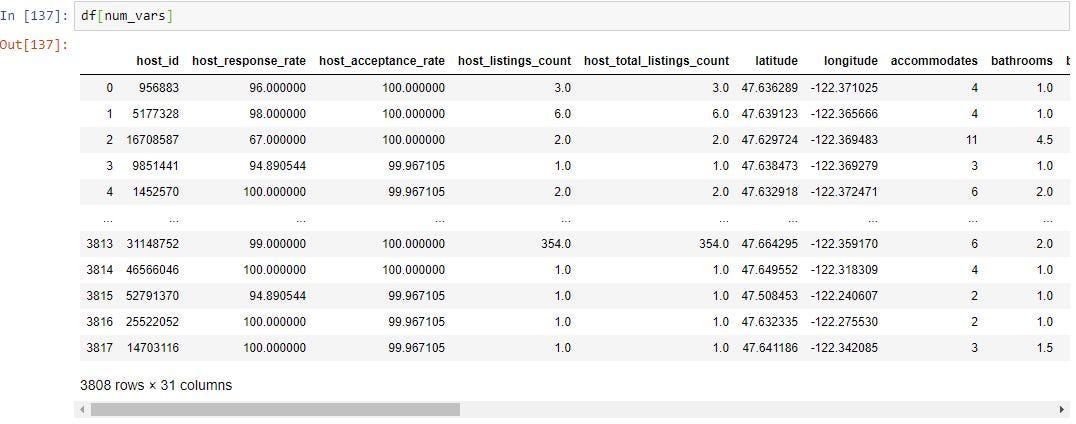
Finding the missing values is the same for both categorical and continuous variables. We will use “num_vars” which holds all the columns which are not object data type.
对于分类变量和连续变量,找到缺失值都是相同的。 我们将使用“ num_vars”来保存所有非对象数据类型的列。
df[num_vars] will give you all the columns in “num_vars” which consists of all the columns in the data frame which are not object data type.
df [num_vars]将为您提供“ num_vars”中的所有列,该列由数据框中的所有非对象数据类型的列组成。

We can use pandas “isnull()” function to find out all the fields which have missing values. This will return True if a field has missing values and false if the field does not have missing values.
我们可以使用熊猫的“ isnull()”函数来找出所有缺少值的字段。 如果字段缺少值,则返回True,否则返回false。

To get how many missing values are in each column we use sum() along with isnull() which is shown below. This will sum up all the True’s in each column from the step above.
为了获得每列中有多少个缺失值,我们使用sum()以及isull() ,如下所示。 这将汇总上述步骤中每一列中的所有True。

Its always good practice to sort the columns in descending order so you can see what are the columns with highest missing values. To do this we can use sort_values() function. By default this function will sort in ascending order. Since we want the columns with highest missing values first we want to set it to descending. You can do this by passing “ascending=False” paramter in sort_values().
始终最好的做法是按降序对列进行排序,以便您可以看到缺失值最高的列。 为此,我们可以使用sort_values()函数。 默认情况下,此功能将按升序排序。 因为我们首先要使缺失值最高的列,所以我们希望将其设置为降序。 您可以通过在sort_values()中传递“ ascending = False”参数来实现。

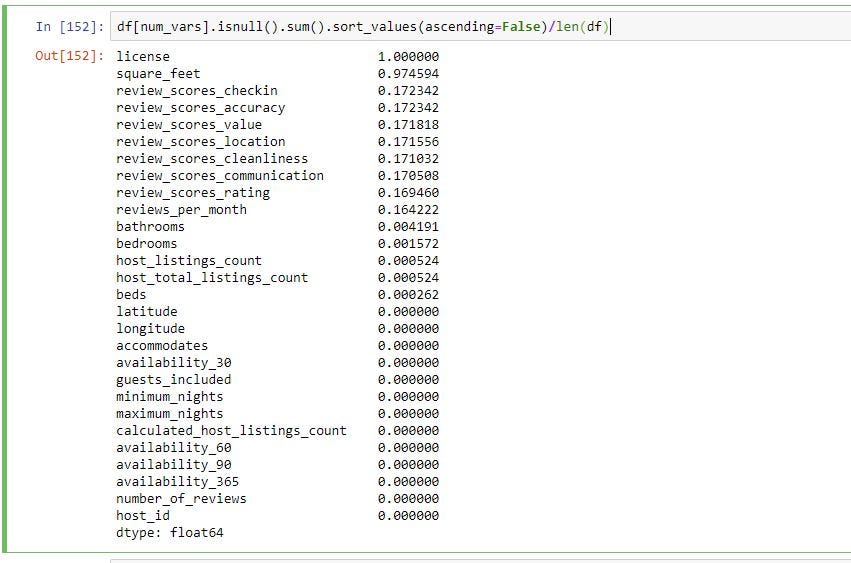
The above give you the count of missing values in each column. To get % of missing values in each column you can divide by length of the data frame. You can “len(df)” which gives you the number of rows in the data frame.
上面给出了每一列中缺失值的计数。 要获得每一列中丢失值的百分比,您可以除以数据帧的长度。 您可以“ len(df)”,它为您提供数据框中的行数。
As you can see below license column is missing 100% of the data and square_feet column is missing 97% of data.
如您所见,License列缺少100%的数据,square_feet列缺少97%的数据。


结论 (Conclusion)
The above article goes over on how to find missing values in the data frame using Python pandas library. Below are the steps
上面的文章介绍了如何使用Python pandas库在数据框中查找缺失值。 以下是步骤
Use isnull() function to identify the missing values in the data frame
使用isnull()函数来识别数据框中的缺失值
Use sum() functions to get sum of all missing values per column.
使用sum()函数可获取每列所有缺失值的总和。
use sort_values(ascending=False) function to get columns with the missing values in descending order.
使用sort_values(ascending = False)函数以降序获取缺少值的列。
Divide by len(df) to get % of missing values in each column.
用len(df)除以得到每一列中丢失值的%。
In this section we identified missing values, in the next we go over on how to handle these missing values.
在本节中,我们确定了缺失值,接下来,我们将继续介绍如何处理这些缺失值。
翻译自: https://medium.com/analytics-vidhya/python-finding-missing-values-in-a-data-frame-3030aaf0e4fd
http://www.taodudu.cc/news/show-997505.html
相关文章:
- Tableau Desktop认证:为什么要关心以及如何通过
- js值的拷贝和值的引用_到达P值的底部:直观的解释
- struts实现分页_在TensorFlow中实现点Struts
- 钉钉设置jira机器人_这是当您机器学习JIRA票证时发生的事情
- 小程序点击地图气泡获取气泡_气泡上的气泡
- PopTheBubble —测量媒体偏差的产品创意
- 面向Tableau开发人员的Python简要介绍(第3部分)
- pymc3使用_使用PyMC3了解飞机事故趋势
- 吴恩达神经网络1-2-2_图神经网络进行药物发现-第2部分
- 数据图表可视化_数据可视化十大最有用的图表
- 接facebook广告_Facebook广告分析
- eda可视化_5用于探索性数据分析(EDA)的高级可视化
- css跑道_如何不超出跑道:计划种子的简单方法
- 熊猫数据集_为数据科学拆箱熊猫
- matplotlib可视化_使用Matplotlib改善可视化设计的5个魔术技巧
- 感知器 机器学习_机器学习感知器实现
- 快速排序简便记_建立和测试股票交易策略的快速简便方法
- 美剧迷失_迷失(机器)翻译
- 我如何预测10场英超联赛的确切结果
- 深度学习数据自动编码器_如何学习数据科学编码
- 图深度学习-第1部分
- 项目经济规模的估算方法_估算英国退欧的经济影响
- 机器学习 量子_量子机器学习:神经网络学习
- 爬虫神经网络_股市筛选和分析:在投资中使用网络爬虫,神经网络和回归分析...
- 双城记s001_双城记! (使用数据讲故事)
- rfm模型分析与客户细分_如何使用基于RFM的细分来确定最佳客户
- 数据仓库项目分析_数据分析项目:仓库库存
- 有没有改期末考试成绩的软件_如果考试成绩没有正常分配怎么办?
- 探索性数据分析(EDA):Python
- 写作工具_4种加快数据科学写作速度的工具
Python:在Pandas数据框中查找缺失值相关推荐
- python 数据框缺失值_Python:处理数据框中的缺失值
python 数据框缺失值 介绍 (Introduction) In the last article we went through on how to find the missing value ...
- 在pandas数据框中选择多个列
本文翻译自:Selecting multiple columns in a pandas dataframe I have data in different columns but I don't ...
- python保存数据框_python – 如何将numpy数组作为对象存储在pandas数据框中?
我有一系列图像,存储在CVS文件中,每个图像一个字符串,该字符串是9216空格分隔整数的列表.我有一个函数将其转换为96×96 numpy数组. 我希望将这个numpy数组存储在我的数据帧的一列而不是 ...
- python如何存储numpy数组_python – 如何将numpy数组作为对象存储在pandas数据框中?...
我有一系列图像,存储在CVS文件中,每个图像一个字符串,该字符串是9216空格分隔整数的列表.我有一个函数将其转换为96×96 numpy数组. 我希望将这个numpy数组存储在我的数据帧的一列而不是 ...
- python两个字符串数据可以复制吗_无论如何,是否要将Python pandas数据框中的单个数据中的数据复制到字符串或列表中以进行进一步处理?...
使用示例数据.请注意,由于复制和粘贴选项卡占用空格(因此使用sep ='\ s +',iso'\ t')并且我已将数据的第一行设置为列名(不使用header = None).可以使用join将一列连接 ...
- json pandas 内存溢出_python-将多个JSON记录读取到Pandas数据框中
注意:str.join(自0.19.0开始)现在支持行分隔的json: In [31]: pd.read_json('{"a":1,"b":2}\n{" ...
- python数据框去重_【Python】基于某些列删除数据框中的重复值
Python按照某些列去重,可用drop_duplicates函数轻松处理.本文致力用简洁的语言介绍该函数. 一.drop_duplicates函数介绍 drop_duplicates函数可以按某列去 ...
- python绘制星空图_【Python】基于某些列删除数据框中的重复值
阿黎逸阳 精选Python.SQL.R.MATLAB等相关知识,让你的学习和工作更出彩(可提供风控建模干货经验). Python按照 某些列去重 ,可用 drop_duplicates函数轻松处理 . ...
- python怎么索引txt数据中第四行_python-在熊猫数据框中按行计数编制索引
我有一个带有两个元素的层次结构索引的"熊猫"数据框(" month"和" item_id").每行表示特定月份的特定项目,并具有用于关注多个 ...
最新文章
- 对volatile的理解
- ubuntu交叉编译x264报错:‘X264_VERSION’ undeclared(已解决)运行version.sh
- FASTICA独立成分分析matlab代码实现
- 一、mysql使用入门
- Spring Cloud Gateway 之获取请求体的几种方式
- 在 Android 应用程序中使用 Internet 数据
- vscode+php+phpstudy:断点调试(f5后vscode无法继续下一步;浏览器无法断点,直接返回执行结果的解决方法)
- 国内主流.NET CMS系统整理
- python字典数据类型笔记_python笔记2-数据类型:元组、字典常用操作
- view中显示部分区域
- 如何使用自动化与分析工具库创建 Excel 直方图
- 拓端tecdat|R语言旅行推销员问题TSP
- 函数式语言(functional language)的相关了解
- ug怎么画曲线_UG怎么画雨伞?ug曲面造型实例教程
- Swing-图表(扇形图的绘制)
- Android音视频——Libyuv使用实战
- Android开发之连接夜神模拟器
- 利用pygame实现大鱼吃小鱼游戏
- git 调换提交顺序
- PAT日志 1042
