获取SQL Server数据库增长和收缩事件的详细信息
It is essential for the DBA to need to ensure the SQL Server database performance. Performance tuning is an open-ended task, and you need to ensure the monitoring of various database parameters.
对于DBA而言,确保SQL Server数据库性能至关重要。 性能调优是一项开放式任务,您需要确保监视各种数据库参数。
SQL Server中的默认跟踪概述 (Overview of Default trace in SQL Server)
Starting from SQL Server 2005, SQL Server captures a few critical events in the default traces. The default trace is enabled on each SQL Server instance. It is a lightweight trace consisting of five trace files in the installation directory of SQL Server.
从SQL Server 2005开始,SQL Server会在默认跟踪中捕获一些关键事件。 在每个SQL Server实例上启用默认跟踪。 它是一个轻量级跟踪,由SQL Server安装目录中的五个跟踪文件组成。
We can check the default trace configuration using the following query.
我们可以使用以下查询检查默认跟踪配置。
SELECT* FROM sys.configurations WHERE configuration_id = 1568
If the default trace is not running, we can use sp_configure commands to enable it using the following query.
如果默认跟踪未运行,则可以使用sp_configure命令通过以下查询启用它。
sp_configure 'show advanced options', 1;
GO
RECONFIGURE;
GO
sp_configure 'default trace enabled', 1;
GO
RECONFIGURE;
GO
In the default trace, SQL Server calculates following auto grow and shrink events for the SQL Server database.
在默认跟踪中,SQL Server为SQL Server数据库计算以下自动增长和收缩事件。
- Data file auto grow 数据文件自动增长
- Data file auto shrink 数据文件自动缩小
- Log file auto grow 日志文件自动增长
- Log file auto shrink 日志文件自动缩小
Once we create a SQL Server database, we define auto growth for each data and log file.
创建SQL Server数据库后,我们将为每个数据和日志文件定义自动增长。
SQL Server expands the size of a database (data and log file) based on the auto growth setting of an individual file to avoid space issues in the existing transactions. Once an auto-growth event occurs, SQL Server holds up transaction processing for the time being. We should monitor and manage the auto growth setting for a database. If the auto-growth event takes a little longer time, it might influence database performance and availability.
SQL Server根据单个文件的自动增长设置扩展数据库(数据和日志文件)的大小,以避免现有事务中出现空间问题。 一旦发生自动增长事件,SQL Server暂时将暂缓事务处理。 我们应该监视和管理数据库的自动增长设置。 如果自动增长事件花费更长的时间,则可能会影响数据库的性能和可用性。
In case of any auto-growth event, SQL Server looks for additional space in the disk where the data or log file exists. If we have a very frequent auto-growth event, it causes physical fragmentation as well. The physical fragmented database takes a long time to complete the transactions. We should take action to minimize the auto-growth events for highly transactional databases.
如果发生任何自动增长事件,SQL Server会在磁盘中寻找数据或日志文件的其他空间。 如果我们有一个非常频繁的自动增长事件,它也会导致物理碎片。 物理碎片数据库需要很长时间才能完成事务。 我们应该采取措施使高事务性数据库的自动增长事件最小化。
By default, Auto Growth is set to grow 10% percent of existing file size in the SQL Server database. It might be suitable for small databases, however, if you look at the perspective of a large database file, it is not the right configuration.
默认情况下,“自动增长”设置为在SQL Server数据库中增长现有文件大小的10%。 它可能适用于小型数据库,但是,如果从大型数据库文件的角度来看,它不是正确的配置。
Let’s look at the following examples. In example 1, SQL Server needs to expand the data file by 100 GB while in example 2, SQL Server expands data file by 10 GB. It will take a long time to expand the data file by 100 GB, and it might put additional load on the database as well.
让我们看下面的例子。 在示例1中,SQL Server需要将数据文件扩展100 GB,而在示例2中,SQL Server将数据文件扩展10 GB。 将数据文件扩展到100 GB将花费很长时间,并且可能还会给数据库增加额外的负载。
|
Example 1 |
Example 2 |
|
Database File Size – 1 TB |
Database File Size – 100 GB |
|
Auto Growth – By 10% |
Auto Growth – By 10% |
|
Auto Growth File size increment: 100 GB |
Auto Growth File size increment: 10 GB |
|
例子1 |
例子2 |
|
数据库文件大小– 1 TB |
数据库文件大小– 100 GB |
|
汽车增长–增长10% |
汽车增长–增长10% |
|
自动增长文件大小增加:100 GB |
自动增长文件大小增加:10 GB |
We should take the following approach to avoid auto-growth events.
我们应该采取以下方法来避免自动增长事件。
- Proactively grow data and log file size for the SQL Server database. If database files have sufficient free space, it will not cause any auto growth 主动增加SQL Server数据库的数据和日志文件大小。 如果数据库文件具有足够的可用空间,则不会导致任何自动增长
- Monitor auto growth events and set appropriate size for the auto growth in fixed MB instead of percentage (%) growth 监视自动增长事件,并为自动增长设置适当的大小,以固定MB为单位,而不是百分比(%)增长
Suppose we set the data file auto growth to 512 MB instead of a 10% setting. In the following table, we can see that auto growth does not require any dependency on the data file size if we use fixed MB growth.
假设我们将数据文件自动增长设置为512 MB,而不是10%的设置。 在下表中,我们可以看到,如果使用固定的MB增长,则自动增长不需要对数据文件大小的任何依赖。
|
Example 1 |
Example 2 |
|
Database File Size – 1 TB |
Database File Size – 100 GB |
|
Auto Growth – By 512 MB |
Auto Growth – By 512 MB |
|
Auto Growth File size increment: 512 MB |
Auto Growth File size increment: 512 MB |
|
例子1 |
例子2 |
|
数据库文件大小– 1 TB |
数据库文件大小– 100 GB |
|
自动增长– 512 MB |
自动增长– 512 MB |
|
自动增长文件大小增加:512 MB |
自动增长文件大小增加:512 MB |
SQL Server数据库缩小 (SQL Server database Shrink)
We might come across a situation where the database files have sufficient free space, but the disk does not meet the free space threshold (assume we maintain a 20% free disk space threshold). Many times, DBA executes DBCC SHRINKDATABASE command to shrink database and return free space to the disk. We should not shrink a database unless it is very much required to do so.
我们可能会遇到这样一种情况,即数据库文件具有足够的可用空间,但是磁盘未达到可用空间阈值(假设我们维持20%的可用磁盘空间阈值)。 很多时候,DBA执行DBCC SHRINKDATABASE命令来收缩数据库并将可用空间返回到磁盘。 除非非常需要收缩数据库,否则我们不应该对其进行收缩。
Some of the issues you might face due to shrinking databases are as follows:
由于数据库缩小,您可能会遇到的一些问题如下:
- Shrink operation is slow and takes a long time to complete, especially for large database files 收缩操作很慢并且需要很长时间才能完成,特别是对于大型数据库文件
- It might cause blocking during its execution time 它可能在执行期间导致阻塞
- It brings index fragmentation, and you need to do index maintenance tasks 它带来了索引碎片,您需要执行索引维护任务
- Due to index fragmentation, database performance will be slow 由于索引碎片,数据库性能会变慢
检查SQL Server数据库的自动增长和收缩事件的不同方法 (Different ways to check Auto Growth and Shrink events for SQL Server database)
At this point, you should be aware that it is vital for a DBA to monitor the auto growth and database shrink events. It is especially vital for the high transactional database. In this section, we will identify different ways to get details of these events.
此时,您应该意识到,DBA监视自动增长和数据库收缩事件至关重要。 这对于高事务性数据库尤其重要。 在本节中,我们将确定获取这些事件详细信息的不同方法。
SSMS磁盘使用情况报告 (SSMS Disk Usage Report)
Connect to a SQL instance and right-click on a database for which we want to get details of Auto Growth and Shrink Events.
连接到SQL实例,然后右键单击我们要获取其“自动增长和收缩事件”详细信息的数据库。
Go to Reports -> Standard Reports and Disk Usage
转到报告->标准报告和磁盘使用情况
It opens the disk usage report of the specified database. In this disk usage report, we get the details of the data file and log file space usage.
它会打开指定数据库的磁盘使用情况报告。 在此磁盘使用情况报告中,我们获得了数据文件和日志文件空间使用情况的详细信息。
In the following screenshot, we get a message – No entry found for autogrow/auto shrink event for SQLShackDemo database in the trace log.
在以下屏幕截图中,我们收到一条消息– 在跟踪日志中找不到SQLShackDemo数据库的自动增长/自动收缩事件条目 。
It shows no auto growth and auto shrink event occurred in the trace log for our SQL Server databases. You should note that as per the message it indicates that only auto events are captured, but default trace captures events that occurred due to executing shrink command.
它显示我们SQL Server数据库的跟踪日志中没有发生自动增长和自动收缩事件。 您应该注意,根据消息,它指示仅捕获自动事件,但是默认跟踪捕获由于执行收缩命令而发生的事件。
Let’s shrink the transaction log file of SQLShackDemo database using the following DBCC SHRINKFILE command.
让我们使用以下DBCC SHRINKFILE命令缩小SQLShackDemo数据库的事务日志文件。
USE [SQLShackDemo]
GO
DBCC SHRINKFILE (N'SQLShackDemo_log' , 0, TRUNCATEONLY)
GO
Rerun the disk usage report, and it shows the event for this. You may notice that it shows the event name Log File Auto Growth.
重新运行磁盘使用情况报告,并为此显示事件。 您可能会注意到它显示了事件名称“日志文件自动增长”。
Let’s execute a workload on SQLShackDemo database, and it should cause data and log file growth.
让我们在SQLShackDemo数据库上执行工作负载,它会导致数据和日志文件增长。
CREATE TABLE Temp
(ID   INT, Name CHAR(8000)
);
GO
SET NOCOUNT ON;
GO
DECLARE @i INT;
SET @i = 1;
WHILE @i < 10000BEGININSERT INTO TempVALUES(1, 'Rajendra');SET @i = @i + 1;END;
Once query execution is completed, rerun the disk usage report. In the following screenshot, you can see data and log file auto-growth events.
查询执行完成后,请重新运行磁盘使用情况报告。 在以下屏幕截图中,您可以看到数据和日志文件自动增长事件。
You need to notice and monitor the frequency of auto-growth along with the duration (ms) for the SQL Server database. It gives you the necessary data to correlated performance issues with auto events and time is taken in completing the request. If the duration is more even for a small increment, you should also consult your storage team for disk-related performance issues.
您需要注意并监视SQL Server数据库自动增长的频率以及持续时间(ms)。 它为您提供了必要的数据,以将性能问题与自动事件相关联,并花费了完成请求的时间。 如果持续时间即使只是很小的增量,也应咨询与磁盘相关的性能问题的存储团队。
用于检查SQL Server数据库中自动增长事件的脚本: (Scripts to check auto growth events in SQL Server database:)
Let’s first execute the script and get the details.
让我们首先执行脚本并获取详细信息。
DECLARE @current_tracefilename VARCHAR(500);
DECLARE @0_tracefilename VARCHAR(500);
DECLARE @indx INT;
SELECT @current_tracefilename = path
FROM sys.traces
WHERE is_default = 1;
SET @current_tracefilename = REVERSE(@current_tracefilename);
SELECT @indx = PATINDEX('%\%', @current_tracefilename);
SET @current_tracefilename = REVERSE(@current_tracefilename);
SET @0_tracefilename = LEFT(@current_tracefilename, LEN(@current_tracefilename) - @indx) + '\log.trc';
SELECT DatabaseName, te.name, Filename, CONVERT(DECIMAL(10, 3), Duration / 1000000e0) AS TimeTakenSeconds, StartTime, EndTime, (IntegerData * 8.0 / 1024) AS 'ChangeInSize MB', ApplicationName, HostName, LoginName
FROM ::fn_trace_gettable(@0_tracefilename, DEFAULT) tINNER JOIN sys.trace_events AS te ON t.EventClass = te.trace_event_id
WHERE(trace_event_id >= 92AND trace_event_id <= 95)
ORDER BY t.StartTime;
We get the following output, and it shows useful information for all file grow events. We also get the application name, hostname and login name that caused this file size growth.
我们得到以下输出,它显示了所有文件增长事件的有用信息。 我们还获得了导致该文件大小增加的应用程序名称,主机名和登录名。
Let’s understand the query quickly.
让我们快速了解查询。
- sys.trace_events catalog view to get SQL Server events and filter those events for our SQL Server database. In the following query, we can see the trace event id 92 to 95 with their description. The event id and description do not change with the new versions of SQL Server sys.trace_events目录视图获取SQL Server事件并为SQL Server数据库过滤这些事件。 在以下查询中,我们可以看到跟踪事件ID 92到95及其描述。 新版本SQL Server不会更改事件ID和描述
SELECT *
FROM sys.trace_events
WHERE trace_event_id >= 92AND trace_event_id <= 95;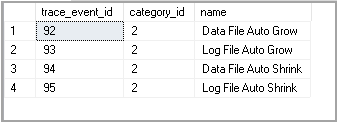
- sys.traces catalog view to get details of current running traces on the system. If the sys.traces目录视图来获取系统上当前正在运行的跟踪的详细信息。 如果任何正在运行的跟踪的is_default property value for any running trace is 1, it shows for the default trace. We also get the trace file location using this catalog view is_default属性值为1,则显示默认跟踪。 我们还使用此目录视图获取跟踪文件的位置
- fn_trace_gettable table-valued function to read the content of a trace file and return it in a tabular format. In this query, it reads the default trace file and gives us the required information fn_trace_gettable表值函数读取跟踪文件的内容,并以表格格式返回它。 在此查询中,它将读取默认跟踪文件并向我们提供所需的信息
Find-DbaDbGrowthEvent DBATools命令 (Find-DbaDbGrowthEvent DBATools Command)
We can also use DBATools PowerShell command to get details of auto-growth events in the SQL Server database. It reads the default trace and provides us with the information for the auto- growth the event.
我们还可以使用DBATools PowerShell命令来获取SQL Server数据库中自动增长事件的详细信息。 它读取默认跟踪,并为我们提供事件自动增长的信息。
The DBATools command to check auto growth events is Find-DbaDbGrowthEvent.
用于检查自动增长事件的DBATools命令是Find-DbaDbGrowthEvent。
Let’s check the syntax, synopsis and description of Find-DbaDbGrowthEvent command.
让我们检查一下Find-DbaDbGrowthEvent命令的语法,大纲和描述。
> get-help Find-DbaDbGrowthEvent
Find-DbaDbGrowthEvent command checks for the AutoGrow events in the Default Trace for all databases. It includes the following events.
Find-DbaDbGrowthEvent命令检查所有数据库的默认跟踪中的自动增长事件。 它包括以下事件。
- 92 – Data File Auto Grow 92 –数据文件自动增长
- 93 – Log File Auto Grow 93 –日志文件自动增长
- 94 – Data File Auto Shrink 94 –数据文件自动收缩
- 95 – Log File Auto Shrink 95 –日志文件自动收缩
Let’s execute the command for my SQL instance and get the output in a grid format.
让我们为我SQL实例执行命令,并以网格格式获取输出。
> Find-DbaDbGrowthEvent -SqlInstance Kashish\SQL2019CTP | Out-GridView
It opens a new interactive output window, and we can see all auto growth events in this.
它打开一个新的交互式输出窗口,我们可以在其中看到所有自动增长事件。
结论 (Conclusion)
In this article, we explored the overview of auto growth and shrink activity in the SQL Server database. We also learned a different way to extract the growth events details from the default trace of SQL Server. If you have any comments or questions, feel free to leave them in the comments below.
在本文中,我们探讨了SQL Server数据库中自动增长和收缩活动的概述。 我们还学习了从SQL Server的默认跟踪中提取增长事件详细信息的另一种方法。 如果您有任何意见或疑问,请随时将其留在下面的评论中。
翻译自: https://www.sqlshack.com/get-details-of-sql-server-database-growth-and-shrink-events/
获取SQL Server数据库增长和收缩事件的详细信息相关推荐
- 关于Python获取sql server数据库,中文显示乱码问题
本文发现的问题源于用python读取sql server数据库时,中文显示乱码,如图红框处中文乱码: 在网上寻找了各种方法, import pymssql import sys import os等 ...
- 使用SQL语句获取SQL Server数据库登录用户权限
返回一个报表,报表中包含当前数据库中某对象的用户权限或语句权限的信息. 语法 sp_helprotect [ [ @name = ] 'object_statement' ] [ , [ @usern ...
- 获取SQL Server数据库表的列名
SELECT syscolumns.name,systypes.name,syscolumns.isnullable,syscolumns.length FROM syscolumns, systyp ...
- SQL Server 数据库之收缩数据库和文件
收缩数据库和文件 1. 概述 2. 自动收缩数据库 3. 手动收缩数据库 4. 手动收缩文件 1. 概述 当数据库随着时间而越来越大时,可对数据库进行收缩操作: 收缩数据文件通过将数据页从文件末尾移动 ...
- DBATools PowerShell SQL Server数据库备份命令
In my earlier PowerShell SQL Server article, SQL Database Backups using PowerShell Module – DBATools ...
- Java连接sql server数据库实现简单版人力资源系统
首先展示运行界面及功能(java.数据库代码在后头): 这篇文章中红色字体所代表的的是此人力资源系统的使用顺序. 主界面,选择身份. 先选择进入薪酬专员界面,因为要先定义薪酬标准,为后续人事专员录入员 ...
- Sql Server数据库实现表中字段的列加密研究
1.问题描述 去年6月份的时候做过一个系统,要对里面的一些敏感字段进行一下加密.Sqlserver列加密可以参考官方文档:SQL Server 技术文档 - SQL Server | Microsof ...
- mysql raiserror_sql server数据库中raiserror函数用法的详细介绍
sql server数据库中raiserror函数的用法 server数据库中raiserror的作用就和asp.NET中的throw new Exception一样,用于抛出一个异常或错误.这个错误 ...
- SQL Server数据库收缩日志的方法
SQL Server数据库收缩日志的方法: 方法一 一般情况下,SQL数据库的收缩并不能很大程度上减小数据库大小,其主要作用是收缩日志大小,应当定期进行此操作以免数据库日志过大. 1.设置数据库模式为 ...
最新文章
- 任何网络都能山寨!新型黑盒对抗攻击可模拟未知网络进行攻击 | CVPR 2021
- python函数使用易错点_大部分人都会忽略的Python易错点总结
- html年月日下拉联动菜单 年月日三下拉框联动
- cassandra的命令
- android学习笔记之ProgressDialog的使用
- hdoj-2028-Lowest common multiple plus
- B站就机房服务器故障道歉;罗永浩否认将启动自动驾驶项目;亚马逊收购 Facebook 卫星互联网团队|极客头条...
- 摆动定价机制连载系列之推出背景及工作原理介绍
- java转双层pdf文件_双层ofd转pdf时报错,带图片带坐标的那种格式
- 品优购案例 html css
- (KNN)K-近邻算法介绍和 Facebook签到位置预测案例应用
- api质量等级_API质量等级与机油选用指引
- Selenium_python 断言
- 短信软件平台源码数据库配置与客户端功能介绍|国际短信通道短信后台-移讯通
- 方舟服务器占用多少内存,方舟生存进化占用多少内存
- 5款伊思儷超媒體繁体游戏 中文简体补丁
- Reacte路由报错:A <Route> is only ever to be used as the child of <Routes> element, never rendered direct
- 运维简历怎么写项目描述_职场小白怎么写简历?一份好简历=成功一半
- PROFINET如何实现“一网到底”?
- R语言ggplot2教程 十张图带你入门ggplot2