数据图表可视化_数据可视化十大最有用的图表
数据图表可视化
分析师每天使用的最佳数据可视化图表列表。 (List of best data visualization charts that Analysts use on a daily basis.)
Presenting information or data in a visual format is one of the most effective ways. Researchers have proved that the human brain is more acceptable in processing visual information compared to raw or tabular data.
以视觉格式显示信息或数据是最有效的方法之一。 研究人员已经证明,与原始或表格数据相比,人脑在处理视觉信息方面更容易接受。
when analysts process data in charts or in graphs, selection of the right chart or graph according to data is one the prime important task. The wrong selection of chart may lead to misinterpretation where the correct selection enhances the business values and beautify your presentation.
当分析师处理图表或图形中的数据时,根据数据选择正确的图表或图形是最重要的任务之一。 错误选择图表可能导致误解,正确选择图表会增强业务价值并美化您的演示文稿。
There are more than 150 charts available in data visualization. But you will use all of them very less likely. Here is the list of the top 10 most useful charts in data visualization.
数据可视化中有150多种图表可用。 但是您将很少使用它们。 以下是数据可视化中最有用的十大图表的列表。
- Scatterplot散点图
- Line chart折线图
- Column Chart柱形图
- Bar Chart条形图
- Area Chart面积图
- Bubble Chart气泡图
- Pie Chart饼形图
- Waffle Chart or Square Pie Chart华夫饼图或方形饼图
- Stack Vertical and Horizontal Charts堆叠垂直和水平图
- Mosaic Plot马赛克图
1.散点图 (1. Scatterplot)
This is a very useful chart when you want to show the relationship between two continuous variables. For example, if you want to visualize the relationship between the Price of the house and Area, then you should this chart. By Visualizing this scatterplot we can answer the following question.
当您想显示两个连续变量之间的关系时,这是一个非常有用的图表。 例如,如果要可视化房屋价格和区域之间的关系,则应使用此图表。 通过可视化此散点图,我们可以回答以下问题。
a. Whether the relationship between two variable exists or not?
一个。 两个变量之间的关系是否存在?
b. Is there a positive relationship or a negative relationship exhibit between two variables?
b。 两个变量之间存在正相关还是负相关?
c. What is the degree of relationship between two variables?
C。 两个变量之间的关系程度是多少?

2.线图或折线图 (2. Line Plot or Line Chart)
Line Chart provides useful means for displaying data over time. The line chart is very useful in visualizing time series data or you want to visualize the changes over time. The line chart also provides a meaningful comparison between two or more than two series. For example the world Population world from 1950 to 2020. But always remember that data plotted on the x-axis must be a consistent interval.
折线图提供了一些有用的方式来显示一段时间内的数据。 折线图对于可视化时间序列数据或您希望可视化随时间的变化非常有用。 折线图还提供了两个或两个以上系列之间的有意义的比较。 例如,1950年至2020年的世界人口世界。但请始终记住,在x轴上绘制的数据必须是一致的间隔。

3.柱形图或垂直条形图 (3. Column Chart or Vertical Bar Chart)
This is one of the charts we have studied in our elementary school. Column Chart is the most common and most ignored charts. column Chart is very powerful in presenting information between categorical data and continuous data. This chart very helpful in comparing various categories in data.
这是我们在小学学习的图表之一。 柱形图是最常见和最被忽略的图表。 柱形图在呈现分类数据和连续数据之间的信息方面非常强大。 该图表在比较数据中的各种类别时非常有帮助。
Column and bar charts are useful for comparing categorical or ordinal data, for illustrating differences between sets of values, and for showing proportions or percentages of a whole.
柱状图和条形图可用于比较分类数据或有序数据,说明值集之间的差异以及显示整体的比例或百分比。
For example, Comparing Education level in the district, or male vs female ratio in the district.
例如,比较该地区的教育水平,或该地区的男女比例。

4.水平条形图 (4. Horizontal Bar Chart)
A flipped version of the column chart and extremely useful because it is very easy to read. When you have more number of categories, it is always recommended to use a horizontal bar chart. our brain trained to read information from left to right, this makes a horizontal bar chart very easy to read. Horizontal bar charts are useful for comparing nominal data. when you are trying to draw to a horizontal bar chart, put information either in ascending or descending order.
柱状图的翻转版本,非常有用,因为它非常易于阅读。 当类别数量更多时,始终建议使用水平条形图。 我们的大脑经过训练可以从左到右读取信息,这使得水平条形图非常易于阅读。 水平条形图对于比较名义数据很有用。 当您尝试绘制水平条形图时,请按升序或降序排列信息。

5.面积图 (5. Area Chart)
An Area chart combines the features of the Pie chart and the line chart. The area chart provides more information compare to alone pie charts and line charts. An area chart should be used more carefully if data have many series in the chart then it can clutter the observer mind.
面积图结合了饼图和折线图的功能。 与单独的饼图和折线图相比,面积图提供了更多信息。 如果数据在图表中有很多序列,则应该更仔细地使用面积图,这样会使观察者的头脑混乱。

6.气泡图 (6. Bubble Chart)
This is one the way to present 3 dimension information in two dimensions. The bubble chart is a kind of scatter plot where the size of the bubble defines the value of the third variable. This chart extremely useful in explaining the socio-economic conditions of the place.
这是在二维中呈现3维信息的一种方式。 气泡图是一种散点图,其中气泡的大小定义了第三个变量的值。 该图表在说明该地点的社会经济状况时非常有用。

7.饼图 (7. Pie Chart)
If we are interested in understanding the relative proportion of each data source to the total. Then Pie chart can be very useful. Pie chart displaying partition a circle into the Pie-shaped area showing the relative proportion. But Most of the experts suggest not using the pie chart because it is always difficult to compare different proportions in the pie chart.
如果我们有兴趣了解每个数据源在总数中的相对比例。 饼图可能会非常有用。 饼图显示将一个圆圈划分为显示相对比例的饼形区域。 但是大多数专家建议不要使用饼图,因为在饼图中比较不同的比例总是很困难。

8.华夫饼图或方形饼图: (8. Waffle Chart or Square Pie Chart :)
Waffle chart is a 10 X 10 cell grid in which each cell represents 1 percentage point summing up to a total of 100%. Waffle charts can be represented with conditional formatting where cells are highlighted with different colors based on the percentage value of that KPI.There are following used cases of Waffles chart:
华夫饼图是一个10 X 10的单元格网格,其中每个单元格代表1个百分点的总和,总计为100%。 华夫饼图可以用条件格式表示,其中根据该KPI的百分比值以不同的颜色突出显示单元格。
- To see a high-level view of items and their contribution to a whole全面了解项目及其对整体的贡献
- Showing different KPI’s percentage value显示不同的KPI百分比值

9.堆叠垂直和水平图 (9. Stack Vertical and Horizontal Charts)
When you are interested in category plus subcategory information then stack chart can be useful. Stack Vertical and horizontal chart shows the total across different category but this stack chart provides information about subcategories. These subcategories can show either absolute value or sum to 100%.
如果您对类别以及子类别信息感兴趣,那么堆栈图可能会很有用。 堆栈垂直和水平图表显示了不同类别的总计,但是此堆栈图表提供了有关子类别的信息。 这些子类别可以显示绝对值或总和为100%。

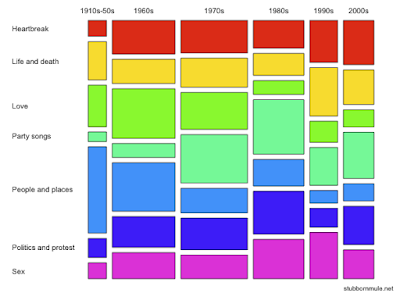
10.马赛克图 (10. Mosaic Plot)
This is a very underrated and uncommon chart. When you have both variables contain categorical data and you want to know the relationship between these variables. then Mosaic plot is very useful.
这是一张被低估且不常见的图表。 当两个变量都包含分类数据并且您想知道这些变量之间的关系时。 那么马赛克图非常有用。
A mosaic plot is a graphical method for visualizing data from two or more qualitative variables. Mosaic plots are also called Mekko charts due to their resemblance to a Marimekko print.
镶嵌图是一种用于可视化来自两个或多个定性变量的数据的图形方法。 由于与Marimekko的印刷相似,马赛克图也称为Mekko图 。
We have a lot of other charts that can help in visualizing the information. But these are the most common useful charts. I used to say this data visualization is a combination of art and science. one should have a creative and scientific mind so that he/she provides the best visual for the data.
我们还有许多其他图表可以帮助可视化信息。 但是,这些是最常见的有用图表。 我曾经说过,这种数据可视化是艺术与科学的结合。 应该具有创造力和科学精神,以便为数据提供最佳视觉效果。
Note: In my Diagram, I have used a black background, which is not recommended by experts. These are charts I have shortlisted based on my experience, Please happy to use other types of charts as well.
注意:在我的图表中,我使用了黑色背景,专家不建议这样做。 这些是根据我的经验我已入围的图表,请也使用其他类型的图表。
HAPPY VISUALIZING
数据图表可视化_数据可视化十大最有用的图表相关推荐
- 大学生求职十大最有用证书
( 大学生求职十大最有用证书 金融危机,求职难上加难.看看如今哪些证书能抵抗住求职寒流-- NO.1:英语证书 大学英语四.六级证书(CET-4,CET-6):极其重要: 专业八级:只有英语专业才有资 ...
- 数据图表可视化_数据可视化如何选择正确的图表第1部分
数据图表可视化 According to the World Economic Forum, the world produces 2.5 quintillion bytes of data ever ...
- powerbuilder 保存图表图像_数据可视化/统计图表循序渐进指南
可视化图表,图形是使数字能够实际对话的最强大的方式之一. 一个关于数据可视化的图表一定是严谨并可以直观表达数据.方便决策者去做决策的. 但是,很多刚开始使用的人往往会不知所措,无法下手. 本文作者详细 ...
- 识别图片并可视化_数据可视化3大发展方向
数据可视化这一概念不过几年前才产生,但讲故事的技巧却早就已经生根发芽了.运用人物.事件.事件顺序.地点.时间段.感情和数字等要素,讲述故事总是让人类着迷. 如今,数据可视化可以图像化地叙述事件,及其起 ...
- 数据可视化图表类型_数据可视化中12种最常见的图表类型
数据可视化图表类型 In the current era of large amounts of information in the form of numbers available everyw ...
- 飞机qar数据可视化_浅谈QAR大数据分析与应用
QAR数据分析指的是用适当的统计分析方法对收集来的QAR数据进行分析,提取有用信息和形成结论而对QAR数据加以详细研究和概括总结的过程.目前航空公司在QAR数据分析与应用上主要有两类问题. 一是典型超 ...
- 数据可视化 信息可视化_动机可视化
数据可视化 信息可视化 John Snow's map of Cholera cases near London's Broad Street. 约翰·斯诺(John Snow)在伦敦宽街附近的霍乱病 ...
- fullcalendar 数据渲染 背景色_数据可视化设计,从0到1必备技能
无论是日常制作可视化图表报告,还是制作可视化大屏,很多设计师或者数据分析师往往会因为重点突出数据的重要性,而让可视化图表变得枯燥乏味.或者会因为过度注重绚丽多彩而让数据的呈现效果大打折扣.如何把握设计 ...
- python 大数据开发框架有哪些_入门大数据开发行业!必备的十大基础
现在由于人工智能的大热,这方面的人才稀缺,薪资水平不用说,行业中的NO.1,所以各路人马纷纷集结互联网行业,有转行的,有转岗的.对于初学者在学习这方面肯定有许多疑问,是什么疑问呢,我在这里一 一给你解 ...
最新文章
- SQL查询前10条记录(SqlServer/mysql/oracle)[语法分析]
- 创造信用收入 借贷宝颠覆创新普惠金融
- JAVA 中字符串的截取,要求不能截取半个汉字
- nanflash编程的地址问题
- 三维重建18: 图像深度获取
- flex 组建重写
- js判断是否在iframe中
- javascript之 原生document.querySelector和querySelectorAll方法
- window10维护不了华为服务器,win10怎么打开云服务器异常
- mysql 定时统计_PHP+MySQL定时数据统计优化
- 关于axios+spring boot无法进行重定向的问题
- erp故障处理流程图_博科Yigo-ERP讲堂 | 您的企业需要实施工厂维护模块吗?
- 静态成员函数与静态数据的使用
- postgres的序列(Sequence)的使用
- 如何在Node.js上的Express.js中获取GET(查询字符串)变量?
- 在java中实现类似于.net中的DataTable,请各位看看,这种方法可行吗?
- Tarjan+topsort(DP)【P3387】 [模板]缩点
- 【LaTeX笔记1】最全命令+符号
- java--守护线程处理超时任务
- 在mysql调用存储过程完成spilt切割