用folium模块画地理图_使用Folium表示您的地理空间数据
用folium模块画地理图
As a part of the Data Science community, Geospatial data is one of the most crucial kinds of data to work with. The applications are as simple as ‘Where’s my food delivery order right now?’ and as complex as ‘What is the most optimal path for the delivery guy?’
作为数据科学社区的一部分,地理空间数据是最重要的数据类型之一。 申请就像“我现在的外卖订单在哪里?”一样简单。 就像“送货员的最佳路径是什么?”一样复杂。
是什么把我带到了Folium? (What brought me to Folium?)
I was recently working on a data science problem involving a lot of gps coordinates. Obviously the very basic question — how do I represent these coordinates on a map in my jupyter notebook? And while we know that plotly, geopy and basemap get the job done, this is the first time I came across Folium and decided to give it a go!
我最近正在研究一个涉及许多gps坐标的数据科学问题。 显然,这是一个非常基本的问题-如何在jupyter笔记本中的地图上表示这些坐标? 虽然我们知道plotly , geopy和basemap可以完成工作,但这是我第一次遇到Folium并决定尝试一下!
This article is a step by step tutorial on representing your data using folium.
本文是有关使用folium表示数据的分步教程。
介绍 (Introduction)
Folium essentially is used for generating interactive maps for the browser (inside notebooks or on a website). It uses leaflet.js , a javascript library for interactive maps.
Folium本质上用于为浏览器(在笔记本内部或网站上)生成交互式地图。 它使用leaflet.js (用于交互式地图的javascript库)。
To put it in a one-liner: Manipulate your data in Python, then visualize it in on a Leaflet map via folium.
要将其放在一个直线上: 用Python处理数据,然后通过叶片将其可视化在Leaflet地图上。
Step 1: Installing folium on the computer and importing the necessary packages.
步骤1: 在计算机上安装大叶草并导入必要的软件包。
!pip install foliumimport numpy as npimport pandas as pdimport matplotlib.pyplot as pltfrom sklearn import preprocessingimport scipy## for geospatialimport foliumimport geopyWe will work with the Fire from Space: Australia dataset.
我们将使用“ 来自太空的火焰:澳大利亚”数据集。
Step 2: Loading and inspecting the dataset.
步骤2: 加载和检查数据集。
df = pd.read_csv("fire_archive_M6_96619.csv")
Step 3: Finding the coordinates to begin with.
步骤3: 找到要开始的坐标。
We can either pick a set of coordinates from the dataset itself or we can use geopy for this purpose. Here, we are talking about Australian wildfires so I started with Melbourne for reference.
我们可以从数据集本身中选择一组坐标,也可以为此使用geopy。 在这里,我们谈论的是澳大利亚的山火,所以我从墨尔本开始作为参考。
city = "Melbourne"# get locationlocator = geopy.geocoders.Nominatim(user_agent="My app") city = locator.geocode(city)location = [city.latitude, city.longitude]print(city, "\n[lat, long]:", location)
Step 4: Plotting on the map.
步骤4: 在地图上绘制。
Plotting points on a map in Folium is like building a house. You lay the base (that’s your background map) and then you add points on top of it’s surface.
在Folium地图上绘制点就像在盖房子。 放置基础(即背景图),然后在其表面顶部添加点。
We shall first lay the base.
我们首先要打基础。
map_ = folium.Map(location=location, tiles="cartodbpositron", zoom_start=8)map_
You can also play around with the tileset and zoom by referring here.
您还可以通过参考此处来玩游戏并缩放。
Now we plot the points on the map. We shall color-code according to the attribute ‘type’ and size it as per the ‘brightness’ of the fire. So let’s get those attributes in order first.
现在我们在地图上绘制点。 我们将根据属性“类型”对代码进行颜色编码,并根据火的“亮度”对其进行大小调整。 因此,让我们先按顺序获取这些属性。
# create color column to correspond to typecolors = ["red","yellow","orange", "green"]indices = sorted(list(df["type"].unique()))df["color"] = df["type"].apply(lambda x: colors[indices.index(x)])## scaling the sizescaler = preprocessing.MinMaxScaler(feature_range=(3,15))df["size"] = scaler.fit_transform( df['brightness'].values.reshape(-1,1)).reshape(-1)We finally add points on top of the map using folium.
最后,我们使用叶片将点添加到地图顶部。
df.apply(lambda row: folium.CircleMarker( location=[row['latitude'],row['longitude']], popup=row['type'], color=row["color"], fill=True, radius=row["size"]).add_to(map_), axis=1)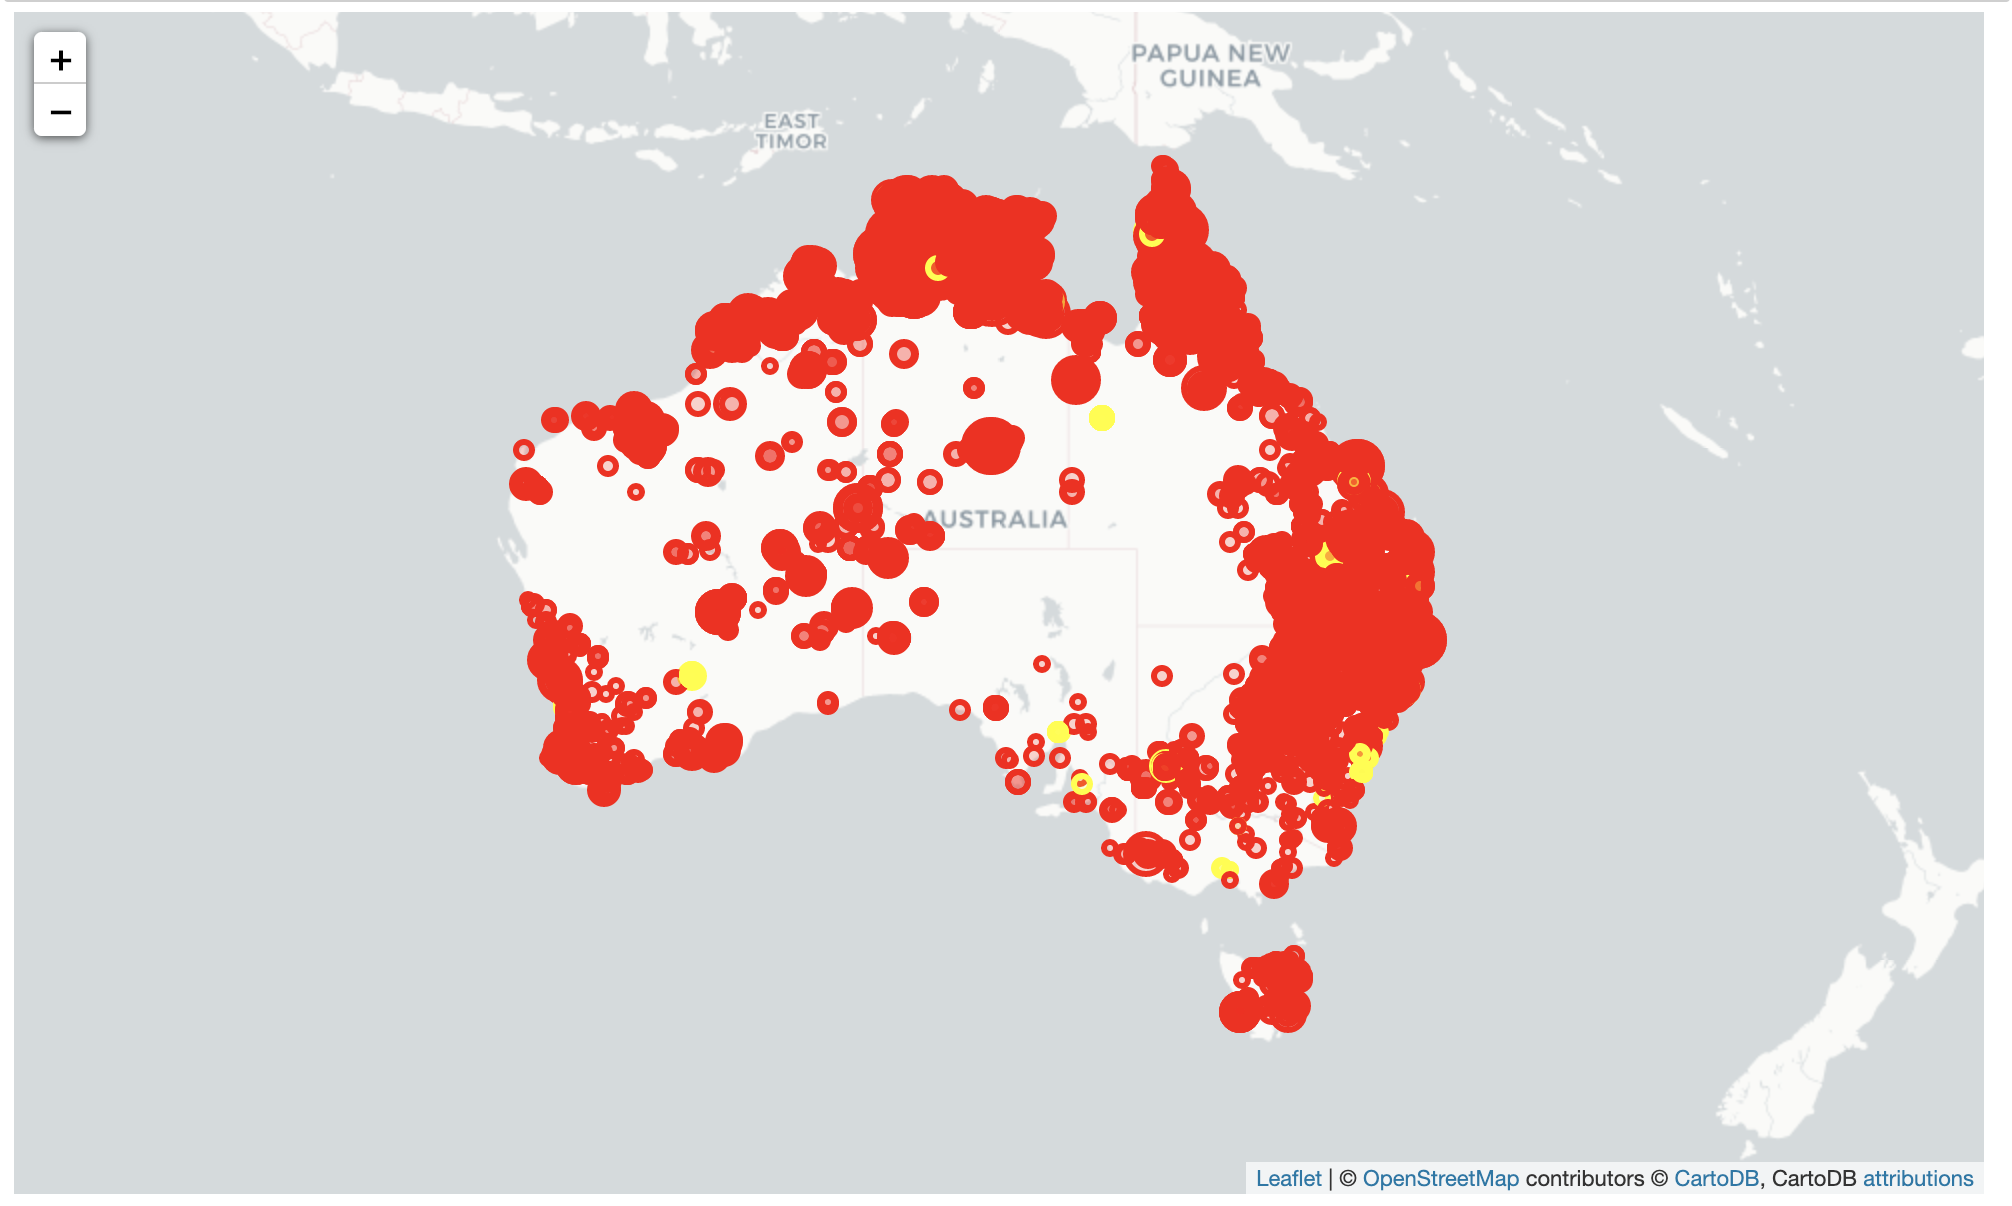
Finally, we move to adding a legend to the map. I used this reference for adding a legend. There are a variety of other methods but this was what I found the easiest.
最后,我们开始向地图添加图例。 我使用此参考来添加图例。 还有许多其他方法,但这是我发现的最简单的方法。
legend_html = """<div style="position:fixed; top:10px; right:10px; border:2px solid black; z-index:9999; font-size:14px;"> <b>"""+color+""":</b><br>"""for i in lst_elements: legend_html = legend_html+""" <i class="fa fa-circle fa-1x" style="color:"""+lst_colors[lst_elements.index(i)]+""""> </i> """+str(i)+"""<br>"""legend_html = legend_html+"""</div>"""map_.get_root().html.add_child(folium.Element(legend_html))#plotmap_
Here’s the whole piece of code:
这是整个代码段:
import numpy as npimport pandas as pdimport matplotlib.pyplot as pltfrom sklearn import preprocessingimport scipy## for geospatialimport foliumimport geopydf = pd.read_csv("fire_archive_M6_96619.csv")city = "Melbourne"# get locationlocator = geopy.geocoders.Nominatim(user_agent="My app") city = locator.geocode(city)location = [city.latitude, city.longitude]print(city, "\n[lat, long]:", location)map_ = folium.Map(location=location, tiles="cartodbpositron", zoom_start=8)# create color column to correspond to typecolors = ["red","yellow","orange", "green"]indices = sorted(list(df["type"].unique()))df["color"] = df["type"].apply(lambda x: colors[indices.index(x)])## scaling the sizescaler = preprocessing.MinMaxScaler(feature_range=(3,15))df["size"] = scaler.fit_transform( df['brightness'].values.reshape(-1,1)).reshape(-1)df.apply(lambda row: folium.CircleMarker( location=[row['latitude'],row['longitude']], popup=row['type'], color=row["color"], fill=True, radius=row["size"]).add_to(map_), axis=1)legend_html = """<div style="position:fixed; top:10px; right:10px; border:2px solid black; z-index:9999; font-size:14px;"> <b>"""+color+""":</b> <br>"""for i in lst_elements: legend_html = legend_html+""" <i class="fa fa-circle fa-1x" style="color:"""+lst_colors[lst_elements.index(i)]+""""> </i> """+str(i)+"""<br>"""legend_html = legend_html+"""</div>"""map_.get_root().html.add_child(folium.Element(legend_html))#plotmap_You can also find it on my Github. Hope this article helped.
您也可以在我的Github上找到它。 希望本文对您有所帮助。
翻译自: https://towardsdatascience.com/represent-your-geospatial-data-using-folium-c2a0d8c35c5c
用folium模块画地理图
http://www.taodudu.cc/news/show-997559.html
相关文章:
- python创建类统计属性_轻松创建统计数据的Python包
- knn分类 knn_关于KNN的快速小课程
- 机器学习集群_机器学习中的多合一集群技术在无监督学习中应该了解
- 政府公开数据可视化_公开演讲如何帮助您设计更好的数据可视化
- 消费者行为分析_消费者行为分析-是否点击广告?
- 魅族mx5游戏模式小熊猫_您不知道的5大熊猫技巧
- 数据科学中的数据可视化
- 多重线性回归 多元线性回归_了解多元线性回归
- 如何使用Python处理丢失的数据
- 为什么印度盛产码农_印度农产品价格的时间序列分析
- tukey检测_回到数据分析的未来:Tukey真空度的整洁实现
- 到2025年将保持不变的热门流行技术
- 马尔科夫链蒙特卡洛_蒙特卡洛·马可夫链
- 数据分布策略_有效数据项目的三种策略
- 密度聚类dbscan_DBSCAN —基于密度的聚类方法的演练
- 从完整的新手到通过TensorFlow开发人员证书考试
- 移动平均线ma分析_使用动态移动平均线构建交互式库存量和价格分析图
- 静态变数和非静态变数_统计资料:了解变数
- 不知道输入何时停止_知道何时停止
- 掌握大数据数据分析师吗?_要掌握您的数据吗? 这就是为什么您应该关心元数据的原因...
- 微信支付商业版 结算周期_了解商业周期
- mfcc中的fft操作_简化音频数据:FFT,STFT和MFCC
- r语言怎么以第二列绘制线图_用卫星图像绘制世界海岸线图-第二部分
- rcp rapido_Rapido使用数据改善乘车调度
- 飞机上的氧气面罩有什么用_第2部分—另一个面罩检测器……(
- 数字经济的核心是对大数据_大数据崛起为数字世界的核心润滑剂
- azure第一个月_MLOps:两个Azure管道的故事
- 编译原理 数据流方程_数据科学中最可悲的方程式
- 解决朋友圈压缩_朋友中最有趣的朋友[已解决]
- pymc3 贝叶斯线性回归_使用PyMC3进行贝叶斯媒体混合建模,带来乐趣和收益
用folium模块画地理图_使用Folium表示您的地理空间数据相关推荐
- Python遥感可视化 — folium模块展示热力图
欢迎关注博主的微信公众号:"智能遥感". 该公众号将为您奉上Python地学分析.爬虫.数据分析.Web开发.机器学习.深度学习等热门源代码. 本人的GitHub代码资料主页(持续 ...
- pythonturtle画房子_用python的turtle模块实现给女票画个小心心
晚上自习无聊 正好拿自己的平板电脑用python写了个小程序,运用turtle模块画一个小心心,并在心上画女票名字的首字母缩写,单纯只为红颜一笑. 代码贴出来,很简单 import turtle im ...
- 用python函数画德国国旗代码_用Python的turtle模块画国旗
最近在学Python,发现Python的海龟绘图非常有趣,就分享一下!话不多说,先来Python turtle的官方文档链接: Python turtle.这里面有turtle的各类指令.turtle ...
- 用python函数画德国国旗代码_使用Python的turtle模块画国旗
Python的turtle模块画国旗主要用到两个函数:draw_rentangle和draw_star. 至于函数的调用就和我们学的C,C++是一样的.对于turtle画国旗的程序中,首先是查找国旗的 ...
- 如何用python画雪人_pygame画雪人_函数与图形示例.py
"""pygame画雪人_函数与图形示例.py """ # 导入pygame模块 import pygame def draw_snowma ...
- 用python画雪人-pygame画雪人_函数与图形示例.py
"""pygame画雪人_函数与图形示例.py """ # 导入pygame模块 import pygame def draw_snowma ...
- python 模块 包 库_模块(包、库)
模块的基本概念: 模块是程序,它就是一个扩展名为.py的python程序.因此对于一个.py的python文件而言,既可以把它当作程序来执行,也可以将它作为模块引入. 导入一个模块时,python解释 ...
- python画画需要什么模块_python实战练手项目---使用turtle模块画奥运五环
python实战练手项目---使用turtle模块画奥运五环 2020年将举办东京奥运会,本篇实践文章将带你使用turtle模块画一个五环图,先来看效果图 1. 定义一个类继承Turtle class ...
- Python的turtle模块画爱心箭(附源码)
Python的turtle模块画爱心箭源码 import turtle as t t.hideturtle() t.speed(100) def f(a,b):#画箭,a,b为箭尖坐标t.penup( ...
最新文章
- Framework 4.0 新关键字dynamic 之我见(二)
- 周志华教授发表首届国际学习与推理联合大会IJCLR开场Keynote:探索从纯学习到学习+推理的AI...
- JavaWeb中post提交乱码之编码拦截器Filter
- Python3 replace()实现字符串替换
- python antlr4需要的python 版本_python多版本管理器pyenv
- System.Math.Min(System.Threading.Interlocked.Increment(i), i - 1)
- 交通标志识别项目教程
- 【2019浙江省赛 - A】Vertices in the Pocket(权值线段树下二分,图,思维)
- python logisticregression_python – 关于scikit-learn中LogisticRegression的GridSearchCV
- 华为笔记本支持鸿蒙,华为 EMUI11 多屏协同说明新增支持鸿蒙 2.0 手机连接
- python基于水色图像的水质评价_零基础学习Python的学习路线及教程
- 最长递增子序列 两种做法
- Axure RP 8 Pro 破解版软件安装包
- 【OR】YALMIP 行列式最大化
- MySQL Mac 终端环境变量配置
- 计算机视觉教程章毓晋课后答案6,计算机视觉教程 教学课件 章毓晋 CCV01.pdf
- 【项目复习篇】EGO电商项目技术总结与学习笔记
- 中级微观经济学:Chap 9 购买和销售
- 【DA】用户粘性指标:日活/月活
- 平面设计的基础知识有哪些?