Docker 部署ELK 日志分析
Docker 部署ELK 日志分析
elk集成镜像包 名字是 sebp/elk
安装 docke、启动
yum install docke
service docker start
Docker至少得分配3GB的内存;不然得加参数 -e ES_MIN_MEM=128m -e ES_MAX_MEM=1024m 加了-e参数限制使用最小内存及最大内存。
Elasticsearch至少需要单独2G的内存;
vm.max_map_count至少需要262144,修改vm.max_map_count 参数
解决:
# vi /etc/sysctl.conf
末尾添加一行
vm.max_map_count=262144
查看结果
# sysctl -p
vm.max_map_count = 262144
首先创建相应存储日志目录
/var/log/elasticsearch/elasticsearch.log
/var/log/logstash/logstash-plain.log
/var/log/kibana/kibana5.log
不然启动启动docker,elk报错如下
#############################################
[root@node01 ~]# docker run -p 5601:5601 -p 9200:9200 -p 5044:5044 -it -v /etc/localtime:/etc/localtime --name elk sebp/elk* Starting periodic command scheduler cron                              [ OK ] * Starting Elasticsearch Server                                         [fail]
###################################################
[root@node01 ~]# docker run -p 5601:5601 -p 9200:9200 -p 5044:5044 -it --name elk sebp/elk
 * Starting periodic command scheduler cron                              [ OK ] * Starting Elasticsearch Server                                         [ OK ]
waiting for Elasticsearch to be up (1/30)
waiting for Elasticsearch to be up (2/30)
waiting for Elasticsearch to be up (3/30)
waiting for Elasticsearch to be up (4/30)
waiting for Elasticsearch to be up (5/30)
waiting for Elasticsearch to be up (6/30)
waiting for Elasticsearch to be up (7/30)
waiting for Elasticsearch to be up (8/30)
waiting for Elasticsearch to be up (9/30)
waiting for Elasticsearch to be up (10/30)
waiting for Elasticsearch to be up (11/30)
waiting for Elasticsearch to be up (12/30)
waiting for Elasticsearch to be up (13/30)
waiting for Elasticsearch to be up (14/30)
waiting for Elasticsearch to be up (15/30)
waiting for Elasticsearch to be up (16/30)
waiting for Elasticsearch to be up (17/30)
waiting for Elasticsearch to be up (18/30)
waiting for Elasticsearch to be up (19/30)
Waiting for Elasticsearch cluster to respond (1/30)
logstash started.* Starting Kibana5                                                                                                                                                                                                                                                    [ OK ]
==> /var/log/elasticsearch/elasticsearch.log <==
[2018-06-08T05:58:05,018][INFO ][o.e.n.Node               ] [cJhUW1e] starting ...
[2018-06-08T05:58:05,780][INFO ][o.e.t.TransportService   ] [cJhUW1e] publish_address {172.17.0.2:9300}, bound_addresses {0.0.0.0:9300}
[2018-06-08T05:58:06,001][INFO ][o.e.b.BootstrapChecks    ] [cJhUW1e] bound or publishing to a non-loopback address, enforcing bootstrap checks
[2018-06-08T05:58:08,219][WARN ][o.e.m.j.JvmGcMonitorService] [cJhUW1e] [gc][young][2][11] duration [1.1s], collections [1]/[2.1s], total [1.1s]/[3s], memory [73.1mb]->[72.5mb]/[1015.6mb], all_pools {[young] [31.4mb]->[17.5mb]/[66.5mb]}{[survivor] [8.3mb]->[8.3mb]/[8.3mb]}{[old] [33.7mb]->[46.7mb]/[940.8mb]}
[2018-06-08T05:58:08,220][WARN ][o.e.m.j.JvmGcMonitorService] [cJhUW1e] [gc][2] overhead, spent [1.1s] collecting in the last [2.1s]
[2018-06-08T05:58:09,842][INFO ][o.e.c.s.MasterService    ] [cJhUW1e] zen-disco-elected-as-master ([0] nodes joined), reason: new_master {cJhUW1e}{cJhUW1ejQ7e19a4PNTpn1A}{CGmd3ROoTiKeGqXg7ldcNA}{172.17.0.2}{172.17.0.2:9300}
[2018-06-08T05:58:10,708][INFO ][o.e.c.s.ClusterApplierService] [cJhUW1e] new_master {cJhUW1e}{cJhUW1ejQ7e19a4PNTpn1A}{CGmd3ROoTiKeGqXg7ldcNA}{172.17.0.2}{172.17.0.2:9300}, reason: apply cluster state (from master [master {cJhUW1e}{cJhUW1ejQ7e19a4PNTpn1A}{CGmd3ROoTiKeGqXg7ldcNA}{172.17.0.2}{172.17.0.2:9300} committed version [1] source [zen-disco-elected-as-master ([0] nodes joined)]])
[2018-06-08T05:58:10,854][INFO ][o.e.h.n.Netty4HttpServerTransport] [cJhUW1e] publish_address {172.17.0.2:9200}, bound_addresses {0.0.0.0:9200}
[2018-06-08T05:58:10,855][INFO ][o.e.n.Node               ] [cJhUW1e] started
[2018-06-08T05:58:13,451][INFO ][o.e.g.GatewayService     ] [cJhUW1e] recovered [0] indices into cluster_state
==> /var/log/logstash/logstash-plain.log <==
==> /var/log/kibana/kibana5.log <==
{"type":"log","@timestamp":"2018-06-08T05:58:22Z","tags":["status","plugin:kibana@6.2.4","info"],"pid":269,"state":"green","message":"Status changed from uninitialized to green - Ready","prevState":"uninitialized","prevMsg":"uninitialized"}
{"type":"log","@timestamp":"2018-06-08T05:58:22Z","tags":["status","plugin:elasticsearch@6.2.4","info"],"pid":269,"state":"yellow","message":"Status changed from uninitialized to yellow - Waiting for Elasticsearch","prevState":"uninitialized","prevMsg":"uninitialized"}
{"type":"log","@timestamp":"2018-06-08T05:58:22Z","tags":["status","plugin:console@6.2.4","info"],"pid":269,"state":"green","message":"Status changed from uninitialized to green - Ready","prevState":"uninitialized","prevMsg":"uninitialized"}
{"type":"log","@timestamp":"2018-06-08T05:58:24Z","tags":["status","plugin:timelion@6.2.4","info"],"pid":269,"state":"green","message":"Status changed from uninitialized to green - Ready","prevState":"uninitialized","prevMsg":"uninitialized"}
{"type":"log","@timestamp":"2018-06-08T05:58:24Z","tags":["status","plugin:metrics@6.2.4","info"],"pid":269,"state":"green","message":"Status changed from uninitialized to green - Ready","prevState":"uninitialized","prevMsg":"uninitialized"}
{"type":"log","@timestamp":"2018-06-08T05:58:24Z","tags":["listening","info"],"pid":269,"message":"Server running at http://0.0.0.0:5601"}
{"type":"log","@timestamp":"2018-06-08T05:58:25Z","tags":["status","plugin:elasticsearch@6.2.4","info"],"pid":269,"state":"green","message":"Status changed from yellow to green - Ready","prevState":"yellow","prevMsg":"Waiting for Elasticsearch"}
启动后进入容器
[root@node01 ~]# docker exec -it elk /bin/bash
执行/opt/logstash/bin/logstash -e 'input { stdin { } } output { elasticsearch { hosts => ["localhost"] } }'
root@e91fcfcc3bc0:/# /opt/logstash/bin/logstash -e 'input { stdin { } } output { elasticsearch { hosts => ["localhost"] } }'
Sending Logstash's logs to /opt/logstash/logs which is now configured via log4j2.properties
[2018-06-08T07:12:33,649][INFO ][logstash.modules.scaffold] Initializing module {:module_name=>"fb_apache", :directory=>"/opt/logstash/modules/fb_apache/configuration"}
[2018-06-08T07:12:33,698][INFO ][logstash.modules.scaffold] Initializing module {:module_name=>"netflow", :directory=>"/opt/logstash/modules/netflow/configuration"}
[2018-06-08T07:12:34,693][WARN ][logstash.config.source.multilocal] Ignoring the 'pipelines.yml' file because modules or command line options are specified
[2018-06-08T07:12:34,719][FATAL][logstash.runner          ] Logstash could not be started because there is already another instance using the configured data directory.  If you wish to run multiple instances, you must change the "path.data" setting.
[2018-06-08T07:12:34,743][ERROR][org.logstash.Logstash    ] java.lang.IllegalStateException: org.jruby.exceptions.RaiseException: (SystemExit) exit
出现如上错误:[2018-06-08T07:12:34,719][FATAL][logstash.runner          ] Logstash could not be started because there is already another instance using the configured data directory.  If you wish to run multiple instances, you must change the "path.data" setting.
解决方法:先暂停logstash服务
root@e91fcfcc3bc0:/# service logstash stop
Killing logstash (pid 204) with SIGTERM
Waiting for logstash (pid 204) to die...
Waiting for logstash (pid 204) to die...
Waiting for logstash (pid 204) to die...
Waiting for logstash (pid 204) to die...
Waiting for logstash (pid 204) to die...
logstash stop failed; still running.
重新执行/opt/logstash/bin/logstash -e 'input { stdin { } } output { elasticsearch { hosts => ["localhost"] } }',当出现【Successfully started Logstash API endpoint {:port=>9600}】时表示正常!并键入“this is a test” 字符串测试
root@e91fcfcc3bc0:/# /opt/logstash/bin/logstash -e 'input { stdin { } } output { elasticsearch { hosts => ["localhost"] } }'
Sending Logstash's logs to /opt/logstash/logs which is now configured via log4j2.properties
[2018-06-08T07:14:10,915][INFO ][logstash.modules.scaffold] Initializing module {:module_name=>"fb_apache", :directory=>"/opt/logstash/modules/fb_apache/configuration"}
[2018-06-08T07:14:10,955][INFO ][logstash.modules.scaffold] Initializing module {:module_name=>"netflow", :directory=>"/opt/logstash/modules/netflow/configuration"}
[2018-06-08T07:14:11,939][WARN ][logstash.config.source.multilocal] Ignoring the 'pipelines.yml' file because modules or command line options are specified
[2018-06-08T07:14:13,166][INFO ][logstash.runner          ] Starting Logstash {"logstash.version"=>"6.2.4"}
[2018-06-08T07:14:13,924][INFO ][logstash.agent           ] Successfully started Logstash API endpoint {:port=>9600}
[2018-06-08T07:14:17,237][INFO ][logstash.pipeline        ] Starting pipeline {:pipeline_id=>"main", "pipeline.workers"=>1, "pipeline.batch.size"=>125, "pipeline.batch.delay"=>50}
[2018-06-08T07:14:18,289][INFO ][logstash.outputs.elasticsearch] Elasticsearch pool URLs updated {:changes=>{:removed=>[], :added=>[http://localhost:9200/]}}
[2018-06-08T07:14:18,309][INFO ][logstash.outputs.elasticsearch] Running health check to see if an Elasticsearch connection is working {:healthcheck_url=>http://localhost:9200/, :path=>"/"}
[2018-06-08T07:14:18,641][WARN ][logstash.outputs.elasticsearch] Restored connection to ES instance {:url=>"http://localhost:9200/"}
[2018-06-08T07:14:18,742][INFO ][logstash.outputs.elasticsearch] ES Output version determined {:es_version=>6}
[2018-06-08T07:14:18,748][WARN ][logstash.outputs.elasticsearch] Detected a 6.x and above cluster: the `type` event field won't be used to determine the document _type {:es_version=>6}
[2018-06-08T07:14:18,779][INFO ][logstash.outputs.elasticsearch] Using mapping template from {:path=>nil}
[2018-06-08T07:14:18,820][INFO ][logstash.outputs.elasticsearch] Attempting to install template {:manage_template=>{"template"=>"logstash-*", "version"=>60001, "settings"=>{"index.refresh_interval"=>"5s"}, "mappings"=>{"_default_"=>{"dynamic_templates"=>[{"message_field"=>{"path_match"=>"message", "match_mapping_type"=>"string", "mapping"=>{"type"=>"text", "norms"=>false}}}, {"string_fields"=>{"match"=>"*", "match_mapping_type"=>"string", "mapping"=>{"type"=>"text", "norms"=>false, "fields"=>{"keyword"=>{"type"=>"keyword", "ignore_above"=>256}}}}}], "properties"=>{"@timestamp"=>{"type"=>"date"}, "@version"=>{"type"=>"keyword"}, "geoip"=>{"dynamic"=>true, "properties"=>{"ip"=>{"type"=>"ip"}, "location"=>{"type"=>"geo_point"}, "latitude"=>{"type"=>"half_float"}, "longitude"=>{"type"=>"half_float"}}}}}}}}
[2018-06-08T07:14:18,891][INFO ][logstash.outputs.elasticsearch] Installing elasticsearch template to _template/logstash
[2018-06-08T07:14:19,225][INFO ][logstash.outputs.elasticsearch] New Elasticsearch output {:class=>"LogStash::Outputs::ElasticSearch", :hosts=>["//localhost"]}
[2018-06-08T07:14:19,444][INFO ][logstash.pipeline        ] Pipeline started successfully {:pipeline_id=>"main", :thread=>"#<Thread:0x2f536475 run>"}
The stdin plugin is now waiting for input:
[2018-06-08T07:14:19,590][INFO ][logstash.agent           ] Pipelines running {:count=>1, :pipelines=>["main"]}
this is a test
使用浏览器 http://192.168.1.111:9200/_search?pretty 出现正常页面
{
"took" : 3,
"timed_out" : false,
"_shards" : {
"total" : 5,
"successful" : 5,
"skipped" : 0,
"failed" : 0
},
"hits" : {
"total" : 1,
"max_score" : 1.0,
"hits" : [
{
"_index" : "logstash-2018.06.08",
"_type" : "doc",
"_id" : "n6dB3mMBsnl4BEURH4Zb",
"_score" : 1.0,
"_source" : {
"message" : "this is a test",
"host" : "e91fcfcc3bc0",
"@timestamp" : "2018-06-08T07:16:39.142Z",
"@version" : "1"
}
}
]
}
}
安装filebeat
curl -L -O https://artifacts.elastic.co/downloads/beats/filebeat/filebeat-6.2.4-amd64.deb
dpkg -i filebeat-6.2.4-amd64.deb
Filebeat 的配置文件为 /etc/filebeat/filebeat.yml,我们需要告诉 Filebeat 两件事:
监控哪些日志文件?
将日志发送到哪里?
paths:- /var/log/*.log- /var/lib/docker/contrainers/*/*.log- /var/log/syslog#- c:\programdata\elasticsearch\logs\*
在 paths 中我们配置了两条路径:
/var/lib/docker/containers/*/*.log 是所有容器的日志文件。
/var/log/syslog 是 Host 操作系统的 syslog。
接下来告诉 Filebeat 将这些日志发送给 ELK。
Filebeat 可以将日志发送给 Elasticsearch 进行索引和保存;也可以先发送给 Logstash 进行分析和过滤,然后由 Logstash 转发给 Elasticsearch。
为了不引入过多的复杂性,我们这里将日志直接发送给 Elasticsearch。
[root@node01 ~]# cat /etc/filebeat/filebeat.yml
###################### Filebeat Configuration Example #########################
#=========================== Filebeat prospectors =============================
filebeat.prospectors:
# Each - is a prospector. Most options can be set at the prospector level, so
# you can use different prospectors for various configurations.
# Below are the prospector specific configurations.
- type: log# Change to true to enable this prospector configuration.enabled: true# Paths that should be crawled and fetched. Glob based paths.paths:- /var/log/*.log- /var/lib/docker/contrainers/*/*.log- /var/log/syslog#- c:\programdata\elasticsearch\logs\*# Exclude lines. A list of regular expressions to match. It drops the lines that are# matching any regular expression from the list.#exclude_lines: ['^DBG']# Include lines. A list of regular expressions to match. It exports the lines that are# matching any regular expression from the list.#include_lines: ['^ERR', '^WARN']# Exclude files. A list of regular expressions to match. Filebeat drops the files that# are matching any regular expression from the list. By default, no files are dropped.#exclude_files: ['.gz$']# Optional additional fields. These fields can be freely picked# to add additional information to the crawled log files for filtering#fields:#  level: debug#  review: 1### Multiline options# Mutiline can be used for log messages spanning multiple lines. This is common# for Java Stack Traces or C-Line Continuation# The regexp Pattern that has to be matched. The example pattern matches all lines starting with [#multiline.pattern: ^\[# Defines if the pattern set under pattern should be negated or not. Default is false.#multiline.negate: false# Match can be set to "after" or "before". It is used to define if lines should be append to a pattern# that was (not) matched before or after or as long as a pattern is not matched based on negate.# Note: After is the equivalent to previous and before is the equivalent to to next in Logstash#multiline.match: after
#============================= Filebeat modules ===============================
filebeat.config.modules:# Glob pattern for configuration loadingpath: ${path.config}/modules.d/*.yml# Set to true to enable config reloadingreload.enabled: false# Period on which files under path should be checked for changes#reload.period: 10s
#==================== Elasticsearch template setting ==========================
setup.template.settings:index.number_of_shards: 3#index.codec: best_compression#_source.enabled: false
#================================ General =====================================
# The name of the shipper that publishes the network data. It can be used to group
# all the transactions sent by a single shipper in the web interface.
#name:
# The tags of the shipper are included in their own field with each
# transaction published.
#tags: ["service-X", "web-tier"]
# Optional fields that you can specify to add additional information to the
# output.
#fields:
#  env: staging
#============================== Dashboards =====================================
# These settings control loading the sample dashboards to the Kibana index. Loading
# the dashboards is disabled by default and can be enabled either by setting the
# options here, or by using the `-setup` CLI flag or the `setup` command.
#setup.dashboards.enabled: false
# The URL from where to download the dashboards archive. By default this URL
# has a value which is computed based on the Beat name and version. For released
# versions, this URL points to the dashboard archive on the artifacts.elastic.co
# website.
#setup.dashboards.url:
#============================== Kibana =====================================
# Starting with Beats version 6.0.0, the dashboards are loaded via the Kibana API.
# This requires a Kibana endpoint configuration.
setup.kibana:# Kibana Host# Scheme and port can be left out and will be set to the default (http and 5601)# In case you specify and additional path, the scheme is required: http://localhost:5601/path# IPv6 addresses should always be defined as: https://[2001:db8::1]:5601#host: "localhost:5601"
#============================= Elastic Cloud ==================================
# These settings simplify using filebeat with the Elastic Cloud (https://cloud.elastic.co/).
# The cloud.id setting overwrites the `output.elasticsearch.hosts` and
# `setup.kibana.host` options.
# You can find the `cloud.id` in the Elastic Cloud web UI.
#cloud.id:
# The cloud.auth setting overwrites the `output.elasticsearch.username` and
# `output.elasticsearch.password` settings. The format is `<user>:<pass>`.
#cloud.auth:
#================================ Outputs =====================================
# Configure what output to use when sending the data collected by the beat.
#-------------------------- Elasticsearch output ------------------------------
output.elasticsearch:# Array of hosts to connect to.hosts: ["192.168.1.111:9200"]template.name: "filebeat"  template.path: "filebeat.template.json"  template.overwrite: false # Optional protocol and basic auth credentials.#protocol: "https"#username: "elastic"#password: "changeme"
启动filebeat
systemctl start filebeat.service
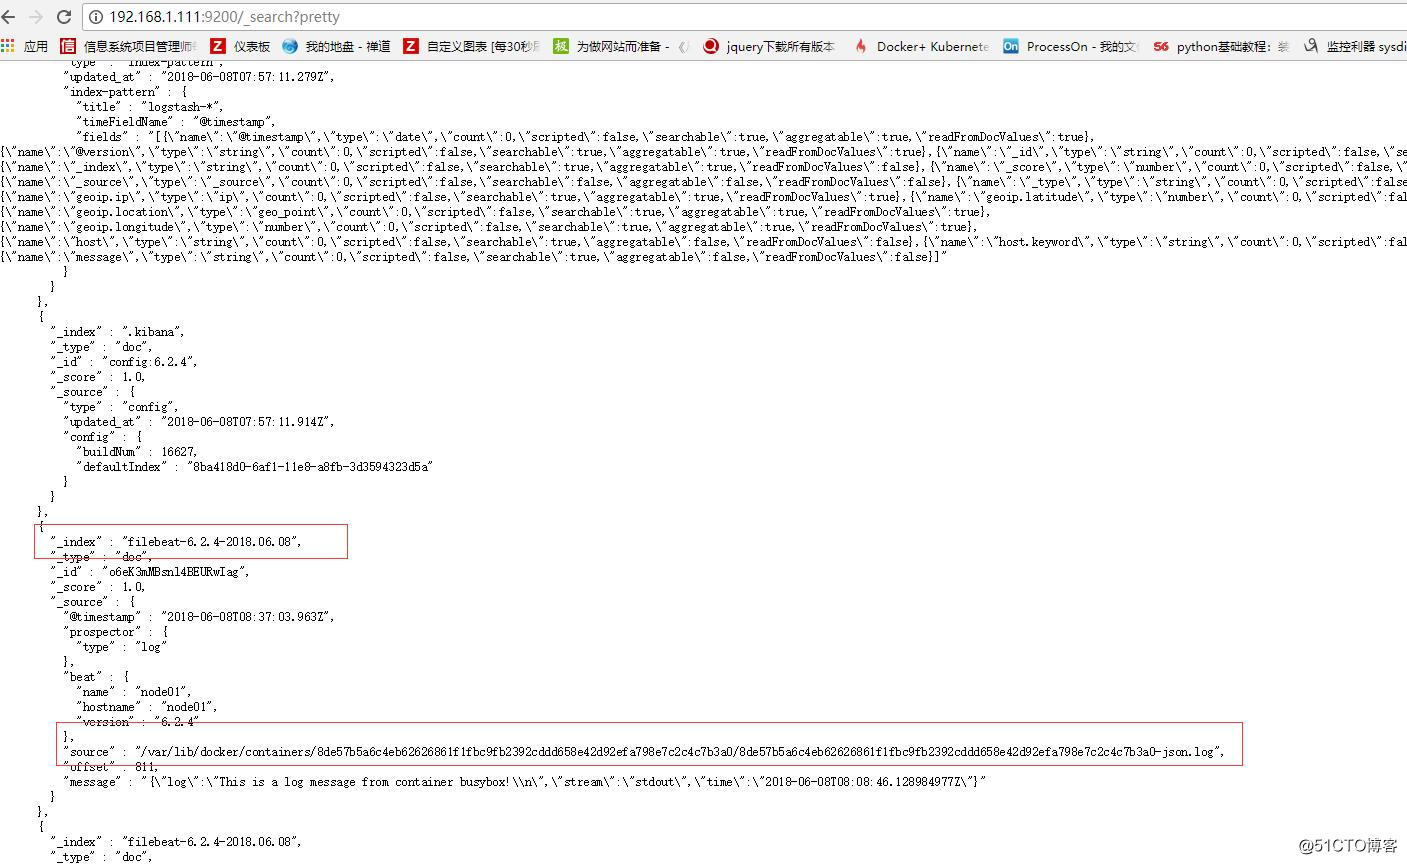
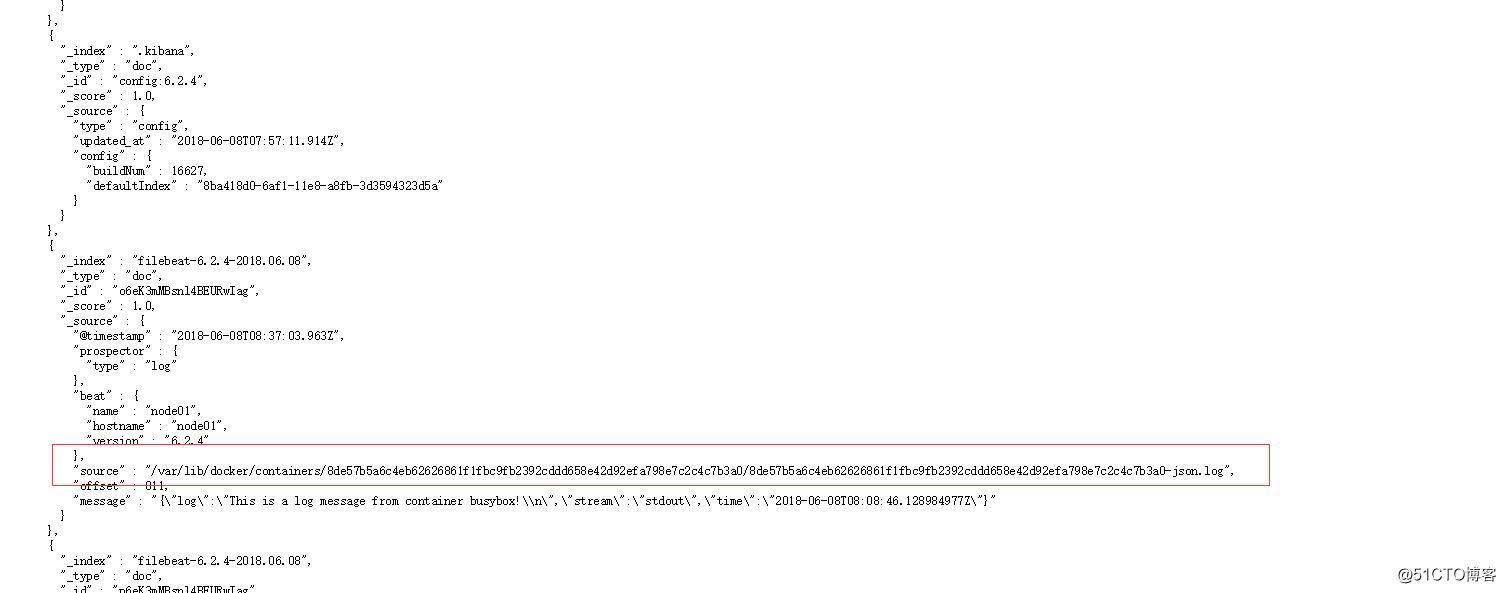
Filebeat 启动后,正常情况下会将监控的日志发送给 Elasticsearch。刷新 Elasticsearch 的 JSON 接口 http://192.168.1.111:9200/_search?pretty 进行确认。能够看到 filebeat-* 的 index,以及 Filebeat 监控的那两个路径下的日志。

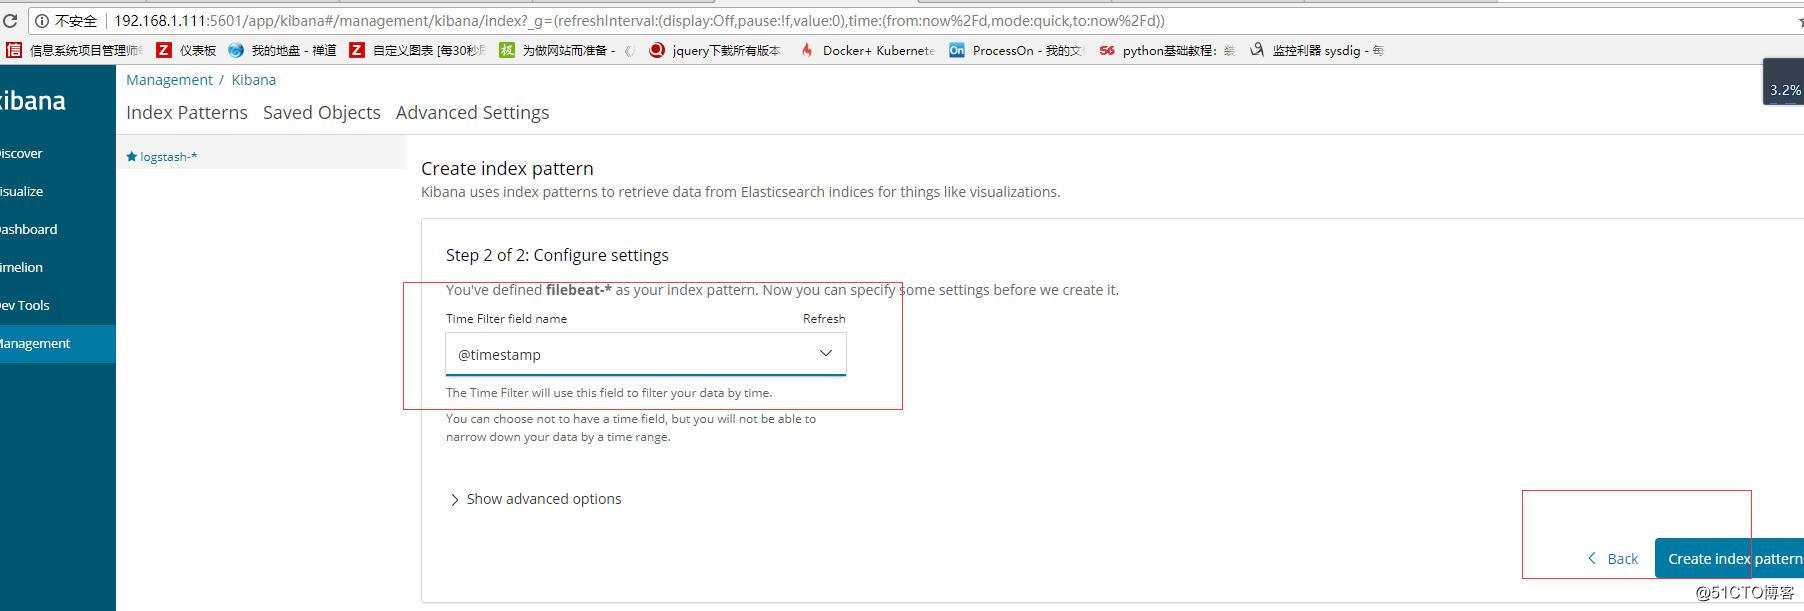
kibana页面 http://192.168.1.111:5601 添加相应的索引,Create index pattern,指定 index pattern 为 filebeat-*,这与 Elasticsearch 中的 index一致。
Time-field name 选择 @timestamp。
点击 Create 创建 index pattern。
点击 Kibana 左侧 Discover 菜单,便可看到容器和 syslog 日志信息。


启动一个新的容器,该容器将向控制台打印信息,模拟日志输出。
docker run busybox sh -c 'while true; do echo "This is a log message from container busybox!"; sleep 10; done;'

注意:ELK还可以对日志进行归类汇总、分析聚合、创建炫酷的 Dashboard 等,可以挖掘的内容很多,玩法很丰富
转载于:https://blog.51cto.com/daisywei/2126519
Docker 部署ELK 日志分析相关推荐
- 超详细部署ELK日志分析系统!每一步骤都有记录!ELK的详细使用!
目录 一.ELK简介 二.Elasticsearch简介 三.Logstash简介 四.Kibana简介 五.ELK案例部署 5.1 案例环境 5.2 部署elasticsearch 5.3 部署Ap ...
- Docker部署graylog日志分析系统
日志分析系统可以实时收集.分析.监控日志并报警,当然也可以非实时的分析日志.splunk是功能强大且用起来最省心的,但是要收费,免费版有每天500M的限制,超过500M的日志就没法处理了.ELK系统是 ...
- Docker部署ELK 日志归集
ELK ELK是Elasticsearch.Logstash.Kibana的缩写,使用ELK的原因是因为公司使用Spring cloud部署了多个微服务,不同的微服务有不同的日志文件,当生产上出现问题 ...
- ELK日志分析系统概述及部署
这里写目录标题 一.ELK日志分析系统 1.日志服务器 2.日志处理步骤 二.Elasticsearch概述 1.Elasticsearch特性 三.LogStash概述 1.LogStash主要组件 ...
- 搭建ELK日志分析系统详解
日志分析是运维工程师解决系统故障.发现问题的主要手段.日志包含多种类型,包括程序日志.系统日志以及安全日志等.通过对日志的分析,既可以做到未雨绸缪.预防故障的发生,又可以在故障发生时,寻找蛛丝马迹.快 ...
- ELK日志分析系统及相关
目录 前言 一.ELK概述 1.ELK日志分析系统 2.ELK中日志处理步骤 二.Elasticsearch介绍 1.Elasticsearch的基础核心概念 2.mysql关系型数据库与Elasti ...
- 运维必备——ELK日志分析系统
目录 一.ELK日志分析系统概述 (1)传统日志服务器的优点与缺点和为什么要使用ELK日志分析系统 (2)ELK日志分析系统日志的分类 (3)ELK日志分析系统的分类 --Elasticsearch: ...
- ELK日志分析系统(一)之ELK原理
文章目录 引言 一.ELK简介 1.ELK日志分析系统组成 1.1 Elasticsearch(es) 1.2 Logstash 1.3 Kibana 2.日志处理步骤 二.Elasticsearch ...
- 超实用的ELK日志分析系统
文章目录 前言: 一.ELK日志分析系统简介 (一).日志服务器 (二).ELK日志分析系统 补充: (三).日志处理步骤 (四).Elasticsearch 介绍 (五).Logstash介绍 (六 ...
最新文章
- TC264信标组 双车组 资源规划 库函数示例
- python读写excel数据--pandas
- 全国计算机一级wps网络,全国计算机一级《WPS》考试试题及答案
- an tu tu html5 test,Design an Accuracy Test System for Resolver-To-Digital Converter Based on PXI
- 通达信缠论三买三卖指标公式_【新增选股指标:中枢突破】通达信版缠论自动画线选股指标今天更新1个重要新版...
- 前端开源项目周报0418
- 方法的创建、重载及递归调用
- SVG_16_defs标签_use标签_style标签_红绿灯效果
- 越来越喜欢SQL语法了,Linq什么时候出来啊,半年了,咋没见更新了呢!真是望眼欲穿。...
- Python实现回文
- Notepad 追加字符
- html与css编程证书,利用CSS布局做一个简单的荣誉证书(代码示例)
- python 爬虫模拟点击_爬虫——模拟点击动态页面
- frequentism-and-bayesianism-chs-ii
- 一知半解对 fcitx5 + openbox + SLiM 的暂时解法
- 音乐节拍识别 计算机,科学网—音乐节拍跟踪或音乐节拍检测软件,LilyBeats alpha - 石自强的博文...
- 【Android】来电监听
- 分享几个值得信赖的网站
- sourcetree如何修改用户名
- 一文详解私募基金投资策略(8大类17小类)
