数据科学数据清理和可视化,适合使用python的初学者
In this article, I am discussing an educational project work in the fascinating field of Data Science while trying to learn the ropes of Data Science. This write-up intends to share the project journey with the larger world and the outcome.
在本文中,我将在尝试学习数据科学的精髓的同时,讨论数据科学引人入胜的领域中的教育项目工作。 本文旨在与更广阔的世界分享项目历程和成果。
Data science is a discipline that is both artistic and scientific simultaneously. A typical project journey in Data Science involves extracting and gathering insightful knowledge from data that can either be structured or unstructured. The entire tour commences with data gathering and ends with exploring the data entirely for deriving business value. The cleansing of the data, selecting the right algorithm to use on the data, and finally devising a machine learning function is the objective in this journey. The machine learning function derived is the outcome of this art that would solve the business problems creatively.
数据科学是一门同时具有艺术性和科学性的学科。 数据科学中的典型项目历程涉及从可以结构化或非结构化的数据中提取和收集有见地的知识。 整个导览从数据收集开始,最后是完全探索数据以获取业务价值。 数据清理,选择对数据使用正确的算法以及最终设计机器学习功能是此过程的目标。 派生的机器学习功能是该技术的成果,它将创造性地解决业务问题。
I will be focussing exclusively on the Data cleansing, imputation, exploration, and visualization of the data. I presume the reader has a basic knowledge of Python or even any equivalent language such as Java or C or Cplusplus to follow the code snippets. The coding was done in Python and executed using Jupyter notebook. I will describe the steps we undertook in this project journey, forming this write-up’s crux.
我将只专注于数据的数据清理,插补,探索和可视化。 我假设读者具有Python甚至是Java,C或Cplusplus之类的任何等效语言的基本知识,可以遵循代码段。 编码是用Python完成的,并使用Jupyter notebook执行。 我将描述我们在此项目旅程中采取的步骤,从而构成本文的重点。
Import Libraries
导入库
We began by importing the libraries that are needed to preprocess, impute, and render the data. The Python libraries that we used are Numpy, random, re, Mat- plotlib, Seaborn, and Pandas. Numpy for everything mathematical, random for random numbers, re for regular expression, Pandas for importing and managing the datasets, Matplotlib.pyplot, and Seaborn for drawing figures. Import the libraries with a shortcut alias as below.
我们首先导入预处理,估算和呈现数据所需的库。 我们使用的Python库是Numpy,random,re,Matplotlib,Seaborn和Pandas。 对于数学上的所有事物都是小块,对于随机数是随机的,对于正则表达式是re,对于导入和管理数据集,Pandas,对于Matplotlib.pyplot,是Seaborn,用于绘制图形。 如下导入带有快捷方式别名的库。
Loading the data set
加载数据集
The dataset provided was e-commerce data to explore. The data set was loaded using Pandas.
提供的数据集是要探索的电子商务数据。 数据集是使用Pandas加载的。
The ‘info’ method gets a summary of the dataset object.
“ info”方法获取数据集对象的摘要。
The shape of the dataset was determined to be 10000 rows and 14 columns. The describe specifies the basic statistics of the dataset.
数据集的形状确定为10000行14列。 describe指定数据集的基本统计信息。

The ‘nunique’ method gives the number of unique elements in the dataset.
“唯一”方法给出了数据集中唯一元素的数量。
Initial exploration of the data set
初步探索数据集
This step involved exploring the various facets of the loaded data. This step helps in understanding the data set columns and also the contents.
此步骤涉及探索已加载数据的各个方面。 此步骤有助于理解数据集列以及内容。
Interpreting and transforming the data set
解释和转换数据集
In a real-world scenario, the data information that one starts with could be either raw or unsuitable for Machine Learning purposes. We will need to transform the incoming data suitably.
在现实世界中,一开始的数据信息可能是原始数据,也可能不适合机器学习目的。 我们将需要适当地转换传入的数据。
We wanted to drop any duplicate rows in the data set using the ‘duplicate’ method. However, as you would note below, the data set we received did not contain any duplicates.
我们想使用“ duplicate”方法删除数据集中的所有重复行。 但是,正如您将在下面指出的那样,我们收到的数据集不包含任何重复项。

Impute the data
估算数据
While looking for invalid values in the data set, we determined that the data set was clean. The question placed on us in the project was to introduce errors at the rate of 10% overall if the data set supplied was clean. So given this ask, we decided to introduced errors into a data set column forcibly. We consciously choose to submit the errors in the
在数据集中寻找无效值时,我们确定该数据集是干净的。 项目中摆在我们面前的问题是,如果提供的数据集是干净的,那么总体上以10%的比率引入错误。 因此,鉴于此问题,我们决定将错误强行引入数据集列。 我们有意识地选择将错误提交给
‘Purchase Price’ column as this has the maximum impact on the dataset outcome. Thus, about 10% of the ‘Purchase Price’ data randomly set with ‘numpy — NaN.’
“购买价格”列,因为这对数据集结果具有最大的影响。 因此,约有10%的“购买价格”数据随机设置为“ numpy-NaN”。
We could have used the Imputer class from the scikit-learn library to fill in missing values with the data (mean, median, most frequent). However, to keep experimenting with hand made code; instead, I wrote a re-usable data frame impute class named ‘DataFrameWithImputor’ that has the following capabilities.
我们本可以使用scikit-learn库中的Imputer类用数据(均值,中位数,最频繁)填充缺失值。 但是,要继续尝试手工代码; 相反,我编写了一个名为“ DataFrameWithImputor”的可重复使用的数据框架归因类,它具有以下功能。
- Be instantiated with a data frame as a parameter in the constructor.在构造函数中以数据框作为参数实例化。
- Introduce errors to any numeric column of a data frame at a specified error rate.以指定的错误率将错误引入数据框的任何数字列。
- Introduce errors across the dataframe in any cell of the dataframe at a specified error rate.在数据框的任何单元中以指定的错误率在数据框内引入错误。
- Impute error values in a column of the data set.在数据集的列中估算错误值。
- Find empty strings in rows of the data set.在数据集的行中查找空字符串。
- Get the’ nan’ count in the data set.获取数据集中的“ nan”计数。
- Possess an ability to describe the entire data set in the imputed object.具备描述估算对象中整个数据集的能力。
- Have an ability to express any column of the dataset in the impute object.能够表达归因对象中数据集的任何列。
- Perform forward fill on the entire data set.对整个数据集执行正向填充。
- Perform backward fill on the entire data set.向后填充整个数据集。
Shown below is the impute class.
下面显示的是归类。
The un-imputed data set was checked for any Nan or missing strings for one final time before introducing errors.
在引入错误之前,最后一次对未插补的数据集进行了任何Nan或缺失字符串检查。
A helper function ‘do_impute’ was defined to introduce errors in a column of the data set and impute the data set column afterwords. This function would take a condition parameter to perform imputation.
定义了一个辅助函数'do_impute ',以在数据集的列中引入错误并插补数据集的列后缀。 此函数将采用条件参数来执行插补。
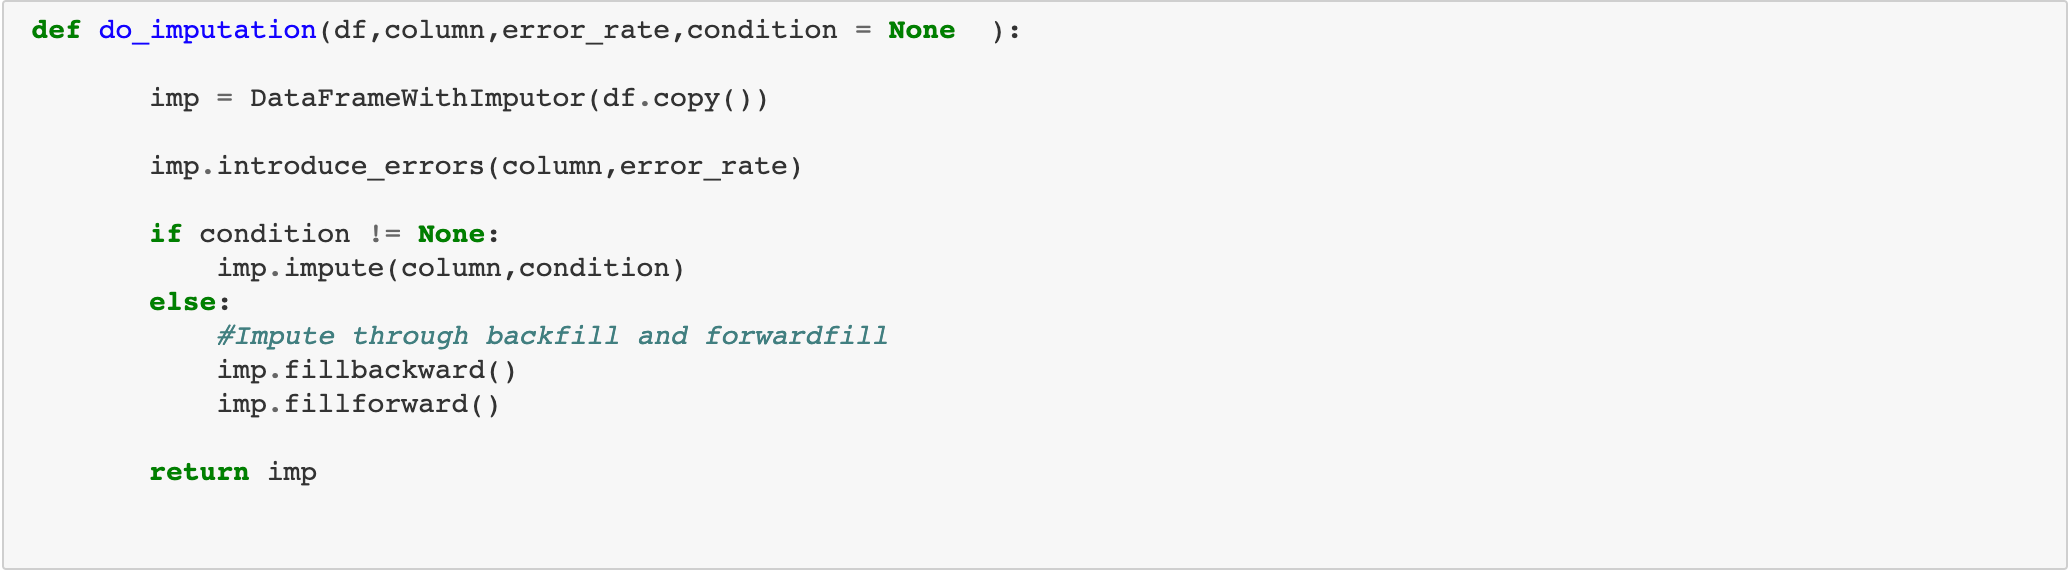
To introduce error, random cells in the ‘Purchase Price’ column is set to ‘NaN.’ Once set, there are several ways to fill up missing values or ‘NaN’:
为了引入错误,将“购买价格”列中的随机单元格设置为“ NaN”。 设置好之后,可以通过以下几种方法来填充缺失值或“ NaN”:
- We can remove the missing value rows itself from the data set. However, in this case, the error percentage is low at just 10%, so this method was not needed.我们可以从数据集中删除缺失值行本身。 但是,在这种情况下,错误百分率很低,仅为10%,因此不需要此方法。
- Fill in the null cell in the data set column with a constant value.用常量值填充数据集列中的空单元格。
- Filling the invalid section with mean and median values用平均值和中值填充无效部分
- Fill the nulls with a random value.用一个随机值填充空值。
- Filling null using data frame backfill and forward fill使用数据框回填和正向填充填充null
The above mentioned are some common strategies applied to impute the data set. However, there are no limits to designing a radically different approach to the data set imputation itself.
上面提到的是一些适用于估算数据集的常用策略。 但是,对数据集估算本身设计根本不同的方法没有任何限制。
Each of the imputed outcomes was studied separately — the fill (backfill and forward fill) and constant value imputations outcome shown below.
每个推算结果都分别进行了研究-填充(回填和正向填充)和恒定值推算结果如下所示。
The median and random value imputations are in the code below.
中值和随机值的估算在下面的代码中。
Then the mean imputed outcome is visually compared with an un-imputed or clean data column as below.
然后,将平均估算结果与未估算或干净数据列进行目视比较,如下所示。
From the above techniques, mean imputation was found closer to the un- imputed clean data, thus preferred. Other choices such as fill(forward and backward) also seemed to produce data set column qualitatively very close to clean data from the study above. However, the mean imputation was preferred as it gives a consistent result and a more widespread impute technique.
通过上述技术,发现平均插值更接近于未插值的干净数据,因此是优选的。 诸如填充(向前和向后)之类的其他选择似乎也定性地产生了与上面研究中的干净数据非常接近的数据集列。 但是,平均插补是可取的,因为它可以提供一致的结果和更广泛的插补技术。
The data frame adopted for further visualization was the mean imputed data set.
进一步可视化所采用的数据框是平均估算数据集。
Exploring and Analysing the data
探索和分析数据
A cleaned up and structured data is suitable for analyzing and finding exemplars using visualization.
清理和结构化的数据适用于使用可视化分析和查找示例。
Find relationship between Job designation and purchase amount?
查找工作指定和购买金额之间的关系?
2. How does purchase value depend on the Internet Browser used and Job (Profession) of the purchaser?
2.购买价值如何取决于所使用的Internet浏览器和购买者的工作(专业)?

3.根据位置(州)和购买时间(上午或下午),购买的模式(如果有)是什么? (3. What are the patterns, if any, on the purchases based on Location (State) and time of purchase (AM or PM)?)
4.购买如何取决于“ CC”提供商和购买时间“ AM或PM”? (4. How does purchase depend on ‘CC’ provider and time of purchase ‘AM or PM’?)

5.购买的前5个位置(州)是什么? (5. What are top 5 Location(State) for purchases?)
We plotted a sub-plot as below.
我们绘制了如下子图。
We can similarly repeat this subplot to view the top 5 credit cards, the top 5 email providers, and the top 5 languages involved in purchases. There are many other visualizations techniques beyond what I have described in this article, with each one capable of giving unique insights into the dataset.
我们可以类似地重复此子图,以查看购物涉及的前5名信用卡,前5名电子邮件提供商和前5种语言。 除了我在本文中介绍的内容外,还有许多其他可视化技术,每种技术都可以对数据集提供独特的见解。
Acknowledgment
致谢
I acknowledge my fellow project collaborators below, without whose contribution this project would not have been so exciting.
我感谢以下我的项目合作伙伴,没有他们的贡献,这个项目就不会那么令人兴奋。
The Team
团队
Rajesh Ramachander: linkedin.com/in/rramachander/
拉杰什(Rajesh Ramachander): linkedin.com/in/rramachander/
Ranjith Gnana Suthakar Alphonse Raj: linkedin.com/in/ranjith-alphonseraj-21666323/
Ranjith Gnana Suthakar Alphonse Raj: linkedin.com/in/ranjith-alphonseraj-21666323/
Yashaswi Gurumurthy: linkedin.com/mwlite/in/yashaswi-gurumurthy-020521113
Yashaswi Gurumurthy:l inkedin.com/mwlite/in/yashaswi-gurumurthy-020521113
Praveen Manohar G: linkedin.com/in/praveen-manohar-g-9006a232
Praveen Manohar G: linkedin.com/in/praveen-manohar-g-9006a232
Rahul A linkedin.com/in/rahulayyappan
拉胡尔Alinkedin.com/in/rahulayyappan
Closing Words
结束语
The Github link to the codebase is https://github.com/RajeshRamachander/ecom/blob/master/ecom_eda.ipynb.
Github到代码库的链接是https://github.com/RajeshRamachander/ecom/blob/master/ecom_eda.ipynb 。
We had fun and many learnings while doing some of these fundamental steps required to work through a large data set, clean, impute, and visualize the data for further work. We finished the project here, and of course, the real journey does not end here as it will progress into modeling, training, and testing phases. For us, this is only the beginning of a long trip. Every data science project that has a better and cleaner data will generate awe-inspiring results!
我们在完成一些通过大型数据集进行工作,清理,估算和可视化数据以进行进一步工作所需的一些基本步骤时,从中获得了很多乐趣和学习。 我们在这里完成了项目,当然,真正的旅程不会在这里结束,因为它将进入建模,培训和测试阶段。 对我们来说,这只是漫长旅程的开始。 每个拥有更好,更干净数据的数据科学项目都将产生令人敬畏的结果!
翻译自: https://medium.com/the-innovation/data-science-data-cleansing-and-visualization-for-beginners-using-python-3f55323768f1
http://www.taodudu.cc/news/show-2558339.html
相关文章:
- BEGAN(Boundary Equilibrium GenerativeAdversarial Networks)-pyTorch实现
- 大数据可视化设计师丹尼斯_自助数据可视化设计师如何谋生
- 数据科学数据分析_使用数据科学进行营销分析
- 什么是Usenet | 第2部分
- 数据铁笼-郑州Android项目ViewPager刷新问题
- MySQL中文存到数据库是,springMVC保存数据到mysql数据库中文乱码问题解决方法
- gan处理自己的数据集_数据集难找?GAN生成你想要的数据!!!
- 登峰造极__边界均衡生成对抗网络(BEGAN)(七)
- 小试牛刀__GAN实战项目之mnist数据集(二)
- Python数据分析学习系列 六 数据加载、存储与文件格式
- 什么事数据补全_事无补
- 税收和成本计算器php,企业税收计算器的使用方便吗?
- C++实验3个人所得税计算器
- 税收学考试可以带计算机吗,税务师考试能带计算器和草纸吗?简答题需要用笔吗?...
- 第九周上机项目3:个人所得税计算器
- 用计算机税额怎么计算,企业所得税计算器(企业税收怎么算计算器)
- 10-税收计算器
- c++实验3——个人税收计算器
- DA转换器原理及应用(报告)
- 推荐几款2021好用的可视化报表工具
- 完全java实现一款开源的报表工具简表(JOR)
- EasyReport报表工具
- Davinci BI报表工具~
- 推荐几款流行的开源报表工具
- 一款简单易用的web报表工具
- java定制化报表_定制自己的报表!7款实用开源报表工具
- python开源报表工具_12个最好的开源报表工具
- java 报表工具_最好用的5款java web免费报表工具
- 推荐5款开源报表工具!
- 4款报表工具功能对比,哪款最实用?
数据科学数据清理和可视化,适合使用python的初学者相关推荐
- python数据科学入门_干货!小白入门Python数据科学全教程
前言本文讲解了从零开始学习Python数据科学的全过程,涵盖各种工具和方法 你将会学习到如何使用python做基本的数据分析 你还可以了解机器学习算法的原理和使用 说明 先说一段题外话.我是一名数据工 ...
- 数据科学系列:plotly可视化入门介绍
导读 在入道数据岗位之初,曾系列写过多个数据科学工具包的入门教程,包括Numpy.Pandas.Matplotlib.Seaborn.Sklearn等,这些也构成了自己当初的核心工具栈.在这5个工具包 ...
- 敏捷数据科学pdf_敏捷数据科学数据科学可以并且应该是敏捷的
敏捷数据科学pdf TL;DR; TL; DR; I have encountered a lot of resistance in the data science community agains ...
- 大数据毕设选题 - 旅游数据分析可视化系统(python 大数据)
文章目录 0 前言 1 课题背景 2 数据处理 3 数据可视化工具 3.1 django框架介绍 3.2 ECharts 4 Django使用echarts进行可视化展示(mysql数据库) 4.1 ...
- 数据分析案例-数据科学相关岗位薪资可视化分析
- python数据科学-数据预处理
总第88篇 数据预处理是我们在做机器学习之前必经的一个过程,在机器学习中常见的数据预处理包括缺失值处理,缩放数据以及对数据进行标准化处理这三个过程. 01|缺失值处理: 缺失值处理是我们在做数据分析/ ...
- 计算思维与数据科学 K-Means聚类模型信用卡用户风险评估 python连接数据库来处理数据
实验目的 1.处理信用卡数据异常值 1)读取信用卡数据: 2)丢弃逾期.呆账.强制停卡.退票.拒往记录为1.瑕疵户为2的记录: 3)丢弃呆账.强制停卡.退票为1.拒往记录为2的记录: 4)丢弃频率为5 ...
- 大数据毕设选题 - 疫情数据分析可视化系统(python flask 爬虫)
文章目录 0 前言 1 课题背景 2 实现效果 2.1 整体界面展示 2.2 31省病例柱形图 2.3 全国现有确诊人数趋势 2.4 中国累计确诊时间线 2.5 中国疫情情况饼状图 2.6 高风险树状 ...
- 爬取BOSS直聘信息并进行清理和可视化分析(python小白)
年底了,学习数据分析快四个月了.为了尽快找到一份数据分析相关的工作,计划把BOSS直聘上的相关职位都爬取下来分析分析,也好检验一下最近的学习成果.python新手,代码写的乱,将就看吧.首先,对给BO ...
- web数据交互_通过体育运动使用定制的交互式Web应用程序数据科学探索任何数据...
web数据交互 Most good data projects start with the analyst doing something to get a feel for the data th ...
最新文章
- spark读取文件源码分析-1
- Eclipse如何导入第三方jar包
- 数据库基础:什么是SQL
- java值传递和引用传递的例子,Java中的值传递和引用传递实例介绍
- mysql bcnf_bcnf范式
- [译] APT分析报告:02.钓鱼邮件网址混淆URL逃避检测
- 高德离线数据api_高德开放平台数据开放情况和调用实验
- macbook历代_你都见过吗?苹果Mac历代台式机回忆录
- 移动端百度点击软件操作方法及常见问题
- 【19调剂】南方科技大学2019年硕士研究生招生预调剂公告
- Introduction to Robotics 总结1~6
- nginx反向代理是什么?
- Class的基本语法
- PHP源码整站文件是什么,2015年2月14日,农历腊月二十六出生的宝宝属相是什么...农历2015年3月14日十二生肖属什么?...
- 考研线性代数手写笔记3 向量
- [FreeBSD] pf+altq实战[转]
- PHP文字间距怎么调,在html中怎么设置文字间距
- Topic7——279. 完全平方数
- latex 中画✔(打勾)
- 立体视觉 -- 相机畸变矫正(去畸变)