双城记s001_双城记! (使用数据讲故事)
双城记s001
Keywords: Data science, Machine learning, Python, Web scraping, Foursquare
关键字:数据科学,机器学习,Python,Web抓取,Foursquare

The post covers the methodology and analysis used for the final capstone project in the IBM Data Science Professional course. Detailed report, code and results can be found on Github and are linked towards the end of the post.
这篇文章涵盖了 IBM Data Science Professional 课程中 用于最终顶点项目的方法和分析 。 可以在Github上找到详细的报告,代码和结果,并在文章末尾链接。
1.简介 (1. Introduction)
Picking a city, when it comes to London and Paris is always a hard decision as both these cities are truly global, multicultural, and cosmopolitan cities found at the heart of two European nations. Along with being two of Europe’s most important diplomatic centres, they are major centres for finance, commerce, sciences, fashion, arts, culture and gastronomy. Both London (capital of the United Kingdom) and Paris (capital of France) have a rich history and are two of the most visited and sought-after cities in Europe. London is the largest city within the UK and stands on River Thames in South East England. Paris, on the other hand, is located in the north-central part of the nation. Similar to London, the city also stands along a river, commonly known as the Seine River.
在伦敦和巴黎时,选择一个城市始终是一个艰难的决定,因为这两个城市都是真正的全球化,多元文化和国际化城市,位于两个欧洲国家的心脏地带。 它们是欧洲最重要的两个外交中心,也是金融,商业,科学,时尚,艺术,文化和美食的主要中心。 伦敦(英国首都)和巴黎(法国首都)都有着悠久的历史,并且是欧洲访问量最大,最受欢迎的两个城市。 伦敦是英国最大的城市,位于英格兰东南部的泰晤士河上。 另一方面,巴黎位于该国中北部。 与伦敦类似,这座城市也沿着一条河流而行,通常被称为塞纳河。
Our goal is to perform a comparison of the two cities to see how similar or dissimilar they are. Such techniques allow users to identify similar neighbourhoods among cities based on amenities or services being offered locally, and thus can help in understanding the local area activities, what are the hubs of different activities, how citizens are experiencing the city, and how they are utilising its resources.
我们的目标是对两个城市进行比较,以了解它们之间的相似程度或相异程度。 此类技术使用户可以根据本地提供的便利设施或服务在城市中识别相似的社区,从而有助于理解本地活动,不同活动的枢纽是什么,市民如何体验城市以及他们如何利用它的资源。
What kind of clientele would benefit from such an analysis?
什么样的客户将从这种分析中受益?
- A potential job seeker with transferable skills may wish to search for jobs in selective cities which provide the most suitable match for their qualifications and experience in terms of salaries, social benefits, or even in terms of a culture fit for expats.潜在的具有可转让技能的求职者可能希望在选择的城市中寻找工作,这些城市在薪资,社会福利乃至适合外籍人士的文化方面提供与其资格和经验最匹配的职位。
- Further, a person buying or renting a home in a new city may want to look for recommendations for locations in the city similar to other cities known to them.此外,在新城市中购买或租赁房屋的人可能希望寻找与他们所熟悉的其他城市相似的城市中的位置的推荐。
- Similarly, a large corporation looking to expand its locations to other cities might benefit from such an analysis.同样,希望将其地点扩展到其他城市的大型公司可能会从这种分析中受益。
- Many within-city urban planning computations might also benefit from modelling a city’s relationship to other cities.城市内部许多城市规划计算也可能会受益于对城市与其他城市的关系进行建模。
2.数据准备 (2. Data Preparation)
To solve the problem at hand, data extraction was done as follows:
为了解决当前的问题,数据提取按以下方式进行:
Web scraping: City data was extracted from the respective Wikipedia pages [1][2] using the Requests and BeautifulSoup libraries.
Web抓取:使用Requests和BeautifulSoup库从相应的Wikipedia页面[1] [2]中提取城市数据。
## URL to extract City neighbourhood informationurlL = "https://en.wikipedia.org/wiki/List_of_London_boroughs"urlP = "https://en.wikipedia.org/wiki/Arrondissements_of_Paris"pageLondon = urllib.request.urlopen(urlL)pageParis = urllib.request.urlopen(urlP)wikitablesL = read_html(urlL, attrs={"class":"wikitable"})print ("Extracted {num} wikitables from London Wikipedia".format(num=len(wikitablesL)))wikitablesP = read_html(urlP, attrs={"class":"wikitable"})print ("Extracted {num} wikitables from Paris Wikipedia".format(num=len(wikitablesP)))dfP = wikitablesP[0]dfL0 = wikitablesL[0]dfL1 = wikitablesL[1]## Request & response s = requests.Session()responseL = s.get(urlL,timeout=10)Further data cleaning was performed on the extracted data in order to store relevant information about its neighbourhoods, their corresponding coordinates, area and population, and the corresponding borough numbers.
为了对提取的数据进行进一步的数据清理,以便存储有关其邻域,其相应坐标,面积和人口以及相应区号的相关信息。
def scrapeLondonTable(table): c1=[] c2=[] c3=[] c4=[] c5=[] c6=[] c7=[] c8=[] c9=[] c10=[] c11=[] for row in table.findAll("tr"): cellsL = row.findAll('td') if len(cellsL)==10: #Only extract table body not heading c1.append(cellsL[0].find('a').text) c2.append(cellsL[1].find(text=True)) c3.append(cellsL[2].find(text=True)) c4.append(cellsL[3].find(text=True)) c5.append(cellsL[4].find(text=True)) c6.append(cellsL[5].find(text=True)) c7.append(cellsL[6].find(text=True)) c8.append(cellsL[7].find(text=True)) c9.append(cellsL[8].find('span',{'class': 'geo'})) c10.append(cellsL[9].find(text=True)) # create a dictionary d = dict([(x,0) for x in headerL]) # append dictionary with corresponding data list d['Borough'] = c1 d['Inner']= c2 d['Status']=c3 d['Local authority']=c4 d['Political control']=c5 d['Headquarters']=c6 d['Area (sq mi)']=c7 d['Population (2013 est)[1]']=c8 d['Co-ordinates']=c9 d[' Nr. in map']=c10 # convert dict to DataFrame dfL_table = pd.DataFrame(d) ## convert Area units to kms^2 #dfL["Area"] = 2.59 * (pd.to_numeric(dfL["Area"])) Latitude = [] Longitude = [] for i in range(len(dfL_table)): locationSplit = dfL_table['Co-ordinates'].iloc[i].getText().split("; ") Latitude.append(locationSplit[0]) Longitude.append(locationSplit[1]) dfL_table['Latitude'] = Latitude dfL_table['Longitude'] = Longitude dfL_table.drop(['Inner','Status','Local authority','Political control','Headquarters','Co-ordinates'],axis=1,inplace=True) dfL = dfL_table.rename(columns={'Area (sq mi)': 'Area', 'Population (2013 est)[1]': 'Population',' Nr. in map':'District Number'}) dfL['District Number'] = dfL['District Number'].astype(int) for i in range(len(dfL)): dfL['Area'].iloc[i] = float(re.findall(r'[\d\.\d]+', dfL['Area'].iloc[i])[0]) dfL['Population'].iloc[i] = int(dfL['Population'].iloc[i].replace(',','')) return dfLAfter the necessary data cleaning, we get the following data frames for our study:
经过必要的数据清洁后,我们将获得以下数据框用于研究:


Foursquare location data: Foursquare is a social location service that allows users to explore the world around them. Foursquare API provides location based experiences with diverse information about venues, users, photos, and check-ins. We took advantage of Foursquare data to extract venue based information for all of the neighbourhoods under study. The call to the API returns a JSON file and we need to turn that into a data-frame. The location data was then used to find the top and unique venues in each of the neighbourhoods. I decided to pick 100 most popular spots in each neighbourhood within a radius of 1 km.
Foursquare位置数据: Foursquare是一种社交位置服务,允许用户探索周围的世界。 Foursquare API提供基于位置的体验,其中包含有关场所,用户,照片和签到的各种信息。 我们利用Foursquare数据为正在研究的所有街区提取基于场所的信息。 对该API的调用会返回一个JSON文件,我们需要将其转换为数据帧。 然后使用位置数据查找每个街区中最重要的地点。 我决定在方圆1公里以内的每个社区中挑选100个最受欢迎的景点。
3.探索性数据分析 (3. Exploratory Data Analysis)
城市资料 (City data)
Wikipedia data provided us with information about the coordinates, area, and population of each borough in the respective cities. One can use this information to visualise a map of the city marking each Borough according to its population density. ‘Geocoder’ and the ‘folium map’ libraries were used for data visualisation on leaflet maps, where boroughs were marked according to its population density. The higher the density, the bigger the radius of the marker.
维基百科的数据为我们提供了有关各个城市中每个自治市镇的坐标,面积和人口的信息。 可以使用此信息来可视化根据自治市镇的人口密度标记每个自治市镇的城市地图。 “ 地理 编码器 ”和“ 叶片地图 ”库用于在传单地图上进行数据可视化,在传单地图上根据人口密度对行政区进行标记。 密度越高,标记的半径越大。


场地数据 (Venue data)
Foursquare location data gave information about the list of venues within a 1 km radius of each borough. This is a reasonable distance to understand the characteristics of the neighbourhood.
Foursquare位置数据提供了有关每个市镇1公里半径内的场所列表的信息。 这是理解社区特征的合理距离。
## Extracting Foursquare venue dataLIMIT = 100 # limit of number of venues returned by Foursquare APIradius = 1000 # define radiusdef getNearbyVenues(names, latitudes, longitudes, radius=500):

    venues_list=[]    for name, lat, lng in zip(names, latitudes, longitudes):        print(name)

        # create the API request URL        url = 'https://api.foursquare.com/v2/venues/explore?&client_id={}&client_secret={}&v={}&ll={},{}&radius={}&limit={}'.format(            CLIENT_ID,             CLIENT_SECRET,             VERSION,             lat,             lng,             radius,             LIMIT)

        # make the GET request        results = requests.get(url).json()["response"]['groups'][0]['items']        # return only relevant information for each nearby venue        venues_list.append([(            name,             lat,             lng,             v['venue']['name'],             v['venue']['location']['lat'],             v['venue']['location']['lng'],              v['venue']['categories'][0]['name']) for v in results])

    nearby_venues = pd.DataFrame([item for venue_list in venues_list for item in venue_list])    nearby_venues.columns = ['Borough',                   'Borough Latitude',                   'Borough Longitude',                   'Venue',                   'Venue Latitude',                   'Venue Longitude',                   'Venue Category']

    return(nearby_venues)print("Getting venues inside the following Boroughs of London:")London_venues = getNearbyVenues(names=tableL['Borough'],                                   latitudes=tableL['Latitude'],                                   longitudes=tableL['Longitude']                                  )
In total, there were around 219 unique venue categories in London and 180 in Paris. I used this information to visualise the most common venues in some of the central London and central Paris boroughs on a bar chart.
总体而言,伦敦大约有219种独特的场馆类别,而巴黎则有180种。 我使用此信息以条形图可视化了伦敦市中心和巴黎市中心的一些最常见场所。
## Picking major districts inside inner London and inner Paris respectivelydistrictsL = ['City of London','Westminster','Kensington and Chelsea','Hammersmith and Fulham', 'Wandsworth']districtsP = ['Louvre, Bourse, Temple, Hôtel-de-Ville', 'Panthéon', 'Luxembourg', 'Palais-Bourbon', 'Élysée']def nearbyvenues_count(venues_df, district):    venues_count = venues_df    venues_count = venues_count.rename(columns={'Venue Category': 'Category'})    venues_count = venues_count.groupby(['Borough']).Category.value_counts().to_frame("Counts")    fig, ax = plt.subplots(1,1,figsize=(20, 7))     fig.subplots_adjust(left=0.115, right=0.88)    venues_plot =  venues_count['Counts'].loc[district][:10].head(10)     pos = np.arange(len(venues_plot))    ax.set_title(district,size=20)    freqchart = ax.barh(pos, venues_plot,align='center',height=0.5,tick_label=venues_plot.index)

    return freqchart


While the most common venues in central London varied between cafes/coffee shops, pubs, juice bars or hotels, the most common venues in Boroughs in the central or major areas of Paris were mostly French or Italian restaurants along with hotels.
伦敦市中心最常见的场所因咖啡馆/咖啡店,酒吧,果汁吧或酒店而异,而巴黎市中心或主要地区的自治市镇最常见的场所主要是法国或意大利餐厅以及酒店。
In order to explore the venue data in a more comprehensive way and further use it for analysis, foursquare venue data was arranged into pandas data frame as follows:
为了更全面地探索场馆数据并进一步用于分析,将Foursquare场馆数据整理到熊猫数据框中,如下所示:
First, create a data-frame with pandas one hot encoding for each of the venue categories
首先,为每个场所类别的熊猫创建一个数据编码的热编码
Obtain the mean of each one-hot encoded venue categories using pandas groupby method on the borough column
使用自治市镇列上的pandas groupby方法获得每个热门编码场所类别的平均值
- Use the venue category mean to obtain a venue based data frame for each city giving the ten most common venues for each borough使用场所类别的意思是获取每个城市的场所数据框架,并给出每个行政区的十个最常见场所
## Categorizing venues into pandas# one hot encodingLondon_onehot = pd.get_dummies(London_venues[['Venue Category']], prefix="", prefix_sep="")# add neighborhood column back to dataframeLondon_onehot['Borough'] = London_venues['Borough'] # move neighborhood column to the first columnfixed_columns = [London_onehot.columns[-1]] + list(London_onehot.columns[:-1])London_onehot = London_onehot[fixed_columns]London_onehot.head()London_grouped = London_onehot.groupby('Borough').mean().reset_index()def return_most_common_venues(row, num_top_venues): row_categories = row.iloc[1:] row_categories_sorted = row_categories.sort_values(ascending=False) return row_categories_sorted.index.values[0:num_top_venues]num_top_venues = 10indicators = ['st', 'nd', 'rd']# create columns according to number of top venuescolumns = ['Borough']for ind in np.arange(num_top_venues): try: columns.append('{}{} Most Common Venue'.format(ind+1, indicators[ind])) except: columns.append('{}th Most Common Venue'.format(ind+1))# create a new dataframe for LondonLondonboroughs_venues_sorted = pd.DataFrame(columns=columns)Londonboroughs_venues_sorted['Borough'] = London_grouped['Borough']for ind in np.arange(London_grouped.shape[0]): Londonboroughs_venues_sorted.iloc[ind, 1:] = return_most_common_venues(London_grouped.iloc[ind, :], num_top_venues)Londonboroughs_venues_sorted.head(10)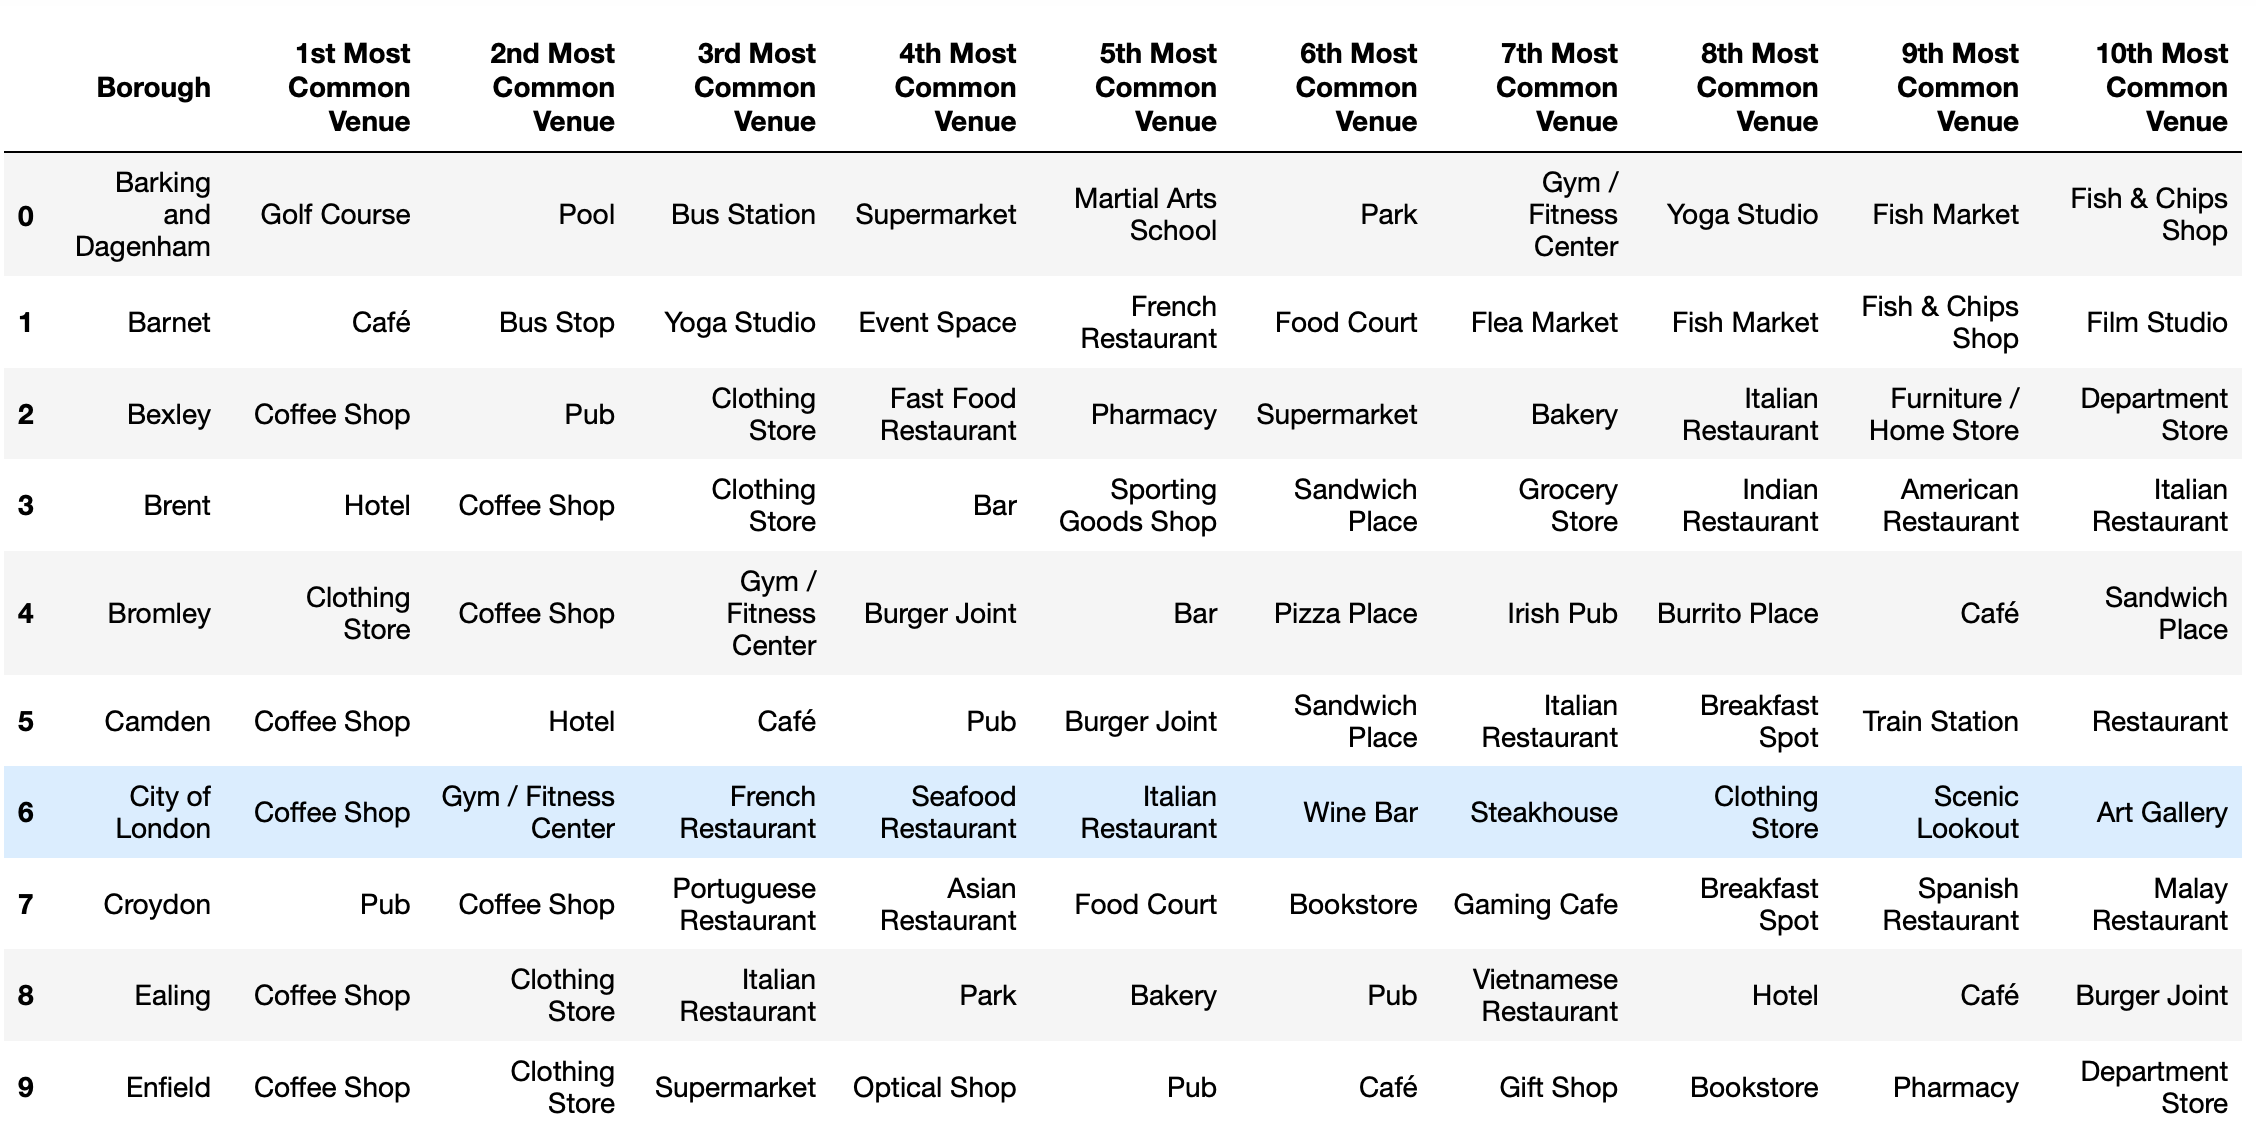

The information providing the most common venue data per borough was then used to categorise the neighbourhoods into clusters using ‘k-means’.
然后使用每个行政区提供最常见场地数据的信息,使用“ k均值 ”将邻域分类为聚类。
4.聚集邻里 (4. Clustering Neighbourhoods)
I performed a clustering analysis using the ‘k-means’ algorithm in order to categorise similar neighbourhoods into clusters based on the similarities provided by the venue categories. To gain some understanding, I decided to do some investigation into the number of clusters (k) to be used as follows:
我使用“ k-means ”算法进行了聚类分析,以便根据会场类别提供的相似性将相似的邻域分类为聚类。 为了获得一些了解,我决定对要使用的簇数(k)进行如下调查:

Elbow method: I tried to determine the effective number of clusters (k) using the elbow method for London clustering analysis and saw a small kink around k = 6 (although not clear and sharp). The elbow method uses Within-Cluster-Sum of Squared Errors (WSS) for different values of k and one can choose the value of k for which WSS starts to diminish and can be seen as an elbow in the WSS-versus-k plot. However for Paris data, no kink was explicitly seen so I tried to look into the Silhouette score for clustering for each value of k. The silhouette value measures how similar a point is to its own cluster (cohesion) compared to other clusters (separation). A value of around k = 2 gave the global maximum for the silhouette score. Although one can see from these studies that we do not have clearly clustered data, I decided to categorise London neighbourhoods into 6 set of clusters and Paris neighbourhoods into 2 set of clusters for the purpose of our analysis. It might be useful to look into a more detailed analysis to optimise k in the future for such studies.
弯头法 :我尝试使用弯头法确定有效的聚类数(k)进行伦敦聚类分析,并在k = 6处发现了一个小扭结(尽管不清楚且清晰)。 弯头方法对k的不同值使用平方误差的簇内和之和(WSS),并且可以选择WSS开始减小的k值,并且可以将其视为WSS-vs-k图中的弯头。 但是,对于巴黎数据,没有明确看到扭结,因此我尝试查看Silhouette得分以对k的每个值进行聚类。 轮廓值衡量的是一个点与其自身的群集(内聚)相比其他群集(分离)的相似程度。 k = 2左右的值给出了轮廓分数的全局最大值。 尽管可以从这些研究中看出我们没有明确的聚类数据,但出于分析的目的,我还是决定将伦敦社区分为6组聚类,将巴黎社区分为2组聚类。 对于此类研究,将来进行更详细的分析以优化k可能会很有用。
5.结果讨论 (5. Discussion of Results)
In order to solve the business problem at hand, we considered the 33 boroughs of inner and outer London and 16 districts of inner Paris. Although each of these neighbourhoods might be unique, some of them might be more similar in terms of the kind of amenities they offer. A clustering analysis was performed to find those similar neighbourhoods. One thing to note is that the data extracted from the London Wiki gave information about boroughs in inner and outer London and thus taking the suburban area into account. While the data provided by the Paris Wiki, only gave information about the districts inside inner Paris and not including much information about the large suburbs surrounding Paris where a decent fraction of the population is spread. Thus, the analysis performed in this study would need more information to compare the cities on an equal footing.
为了解决当前的业务问题,我们考虑了伦敦内部和外部的33个行政区和巴黎内部的16个区。 尽管这些社区中的每一个都可能是唯一的,但就其提供的便利设施而言,其中一些社区可能更加相似。 进行聚类分析以找到那些相似的社区。 要注意的一件事是,从伦敦Wiki提取的数据提供了有关伦敦内部和外部伦敦自治市镇的信息,因此考虑了郊区。 尽管巴黎Wiki提供的数据仅提供了有关巴黎内部地区的信息,但并未提供有关巴黎周围人口分散的大郊区的大量信息。 因此,在这项研究中进行的分析将需要更多信息,以平等地比较城市。
Some of the inferences which were drawn from the explanatory analysis are:
从解释性分析中得出的一些推论是:
- Most of the areas in inner Paris are more densely populated than similar areas in inner London. While there are 9 (out of 33) boroughs in London with a density greater than 10000, only 3 districts (out of 16) in Paris have a density of less than 10000 and 4 of the neighbourhoods above 30000.巴黎内的大多数地区比伦敦内的类似地区人口稠密。 伦敦有9个行政区(33个行政区)的密度大于10000,而巴黎仅有3个区(16个行政区)的密度小于10000,而4个街区的30000以上。
- The dense boroughs are more concentrated towards the inner regions of London in the map than the outer regions and for Paris the most dense boroughs lie towards north of Seine river.在地图中,稠密的行政区比伦敦更集中于伦敦的内部区域,而对于巴黎来说,最密集的行政区位于塞纳河以北。
- Initial exploration of the Foursquare venue data revealed that coffee shops, cafes, pubs and juice bars are the most common venues in five main boroughs in inner London. Similarly French restaurants, Italian restaurants, and hotels were the most common venues seen in five main boroughs of inner Paris.对Foursquare场地数据的初步探索显示,咖啡店,咖啡馆,酒吧和果汁吧是伦敦市中心五个主要行政区中最常见的场所。 同样,法国餐厅,意大利餐厅和酒店是巴黎市中心五个主要行政区中最常见的场所。
Further, machine learning analysis of the venue based data revealed most of the boroughs of London can be grouped together into one cluster. The most common venues in such boroughs were always coffee shops, cafes, pubs, hotels or restaurants followed by some kind of clothing, convenience stores or pharmacies. Paris was categorised into two separate clusters in total. Although the most common venue in both the clusters was always a French restaurant, it was followed by a high number of Italian restaurants, hotels, and cafes in the first cluster and variations of other cuisine restaurants, bars, bistros, clothing stores or supermarkets in the second cluster.
此外,对基于场所的数据进行的机器学习分析表明,伦敦大部分行政区都可以归为一个集群。 在这些自治市镇中,最常见的场所通常是咖啡店,咖啡馆,酒吧,酒店或饭店,然后是某些服装,便利店或药店。 巴黎总共分为两个单独的类别。 尽管这两个集群中最常见的场所始终是法国餐厅,但在第一个集群中紧随其后的是大量意大利餐厅,酒店和咖啡馆,以及其他美食餐厅,酒吧,小酒馆,服装店或超市第二个集群。


The most common type of venues in either of the cities are mostly restaurants, cafes, hotels, pubs/bars, clothing stores or parks. This in a way highlights that how similar the cities of London and Paris are in terms of services being offered.
在这两个城市中,最常见的场所类型主要是餐馆,咖啡馆,酒店,酒馆/酒吧,服装店或公园。 这从某种程度上突出了伦敦和巴黎城市在提供服务方面的相似程度。
One can further use the venue data to compare the cities is a more comprehensive way where one can also explore different levels of spatial aggregation, namely grids, neighbourhoods, and the city as a whole. The level of spatial aggregation can be an important factor when characterising a city in terms of its venues.
人们可以进一步使用场馆数据来比较城市,这是一种更全面的方法,其中还可以探索不同级别的空间聚合,即网格,街区和整个城市。 当根据地点来表征城市时,空间聚集的水平可能是重要的因素。
Some of the questions one can answer with different levels of spatial aggregation could be:
人们可以用不同级别的空间聚合来回答的一些问题可能是:
- How are the venue categories distributed inside a neighbourhood, i.e., is the neighbourhood more of a residential or a commercial one.场地类别如何在邻里分布,即邻里更多是住宅或商业场所。
- Which city has the highest number of each of the amenities (bars, restaurants, parks, universities, libraries, shopping centres, etc.)每种设施(酒吧,饭店,公园,大学,图书馆,购物中心等)中哪个城市拥有最多的设施
六,结论 (6. Conclusion)
To summarise, analysing cities using venue based data from Foursquare lead to an overall understanding of the type of venues in each neighbourhood and presented some of the key features of the cities but the level of data is not adequate to provide a comprehensive analysis for a city-to-city comparison. For a potential interested person (job-seeker or person deciding to move to either of the cities) or a bigger clientele like a business corporation or city planners, one would need to do a more detailed analysis adding features such as rents, salaries, transportation, cost of living, growth rate, economy, etc.
总而言之,使用来自Foursquare的基于场所的数据来分析城市,可以全面了解每个社区中场所的类型,并介绍了城市的一些关键特征,但是数据水平不足以对城市进行全面分析到城市比较。 对于潜在的有兴趣的人(求职者或决定搬到两个城市的人)或更大的客户(例如商业公司或城市规划师),您需要进行更详细的分析,添加诸如租金,薪水,交通等功能,生活费用,增长率,经济状况等。
The capstone project provided a medium to understand in depth about how real life data science projects work and what all steps go in building a data science methodology. All steps from understanding the business problem, data understanding to data preparation, and model building were discussed in detail here. Many drawbacks of the current analysis and further ways to improve the analysis were also mentioned. This was an initial attempt to understand and solve the business problem at hand. However, there still exists a huge potential to extend this project in real life scenarios.
最高项目为深入了解现实生活中的数据科学项目的工作方式以及构建数据科学方法论的所有步骤提供了一种媒介。 这里详细讨论了从理解业务问题,数据理解到数据准备以及模型构建的所有步骤。 还提到了当前分析的许多缺点以及改进分析的其他方法。 这是理解和解决当前业务问题的最初尝试。 但是,在现实生活中仍存在将这个项目扩展的巨大潜力。
About Me:
关于我:
I am a Physicist and have been analysing particle physics data for several years now. I have moved for work between Karlsruhe, Geneva, Sao Paulo, and Chicago in the last few years and currently am residing in Paris. Although such a data analysis would be a stepping stone to design a methodology to compare any of the cities, comparing London and Paris was driven by a personal choice of love for those cities. ❤
我是物理学家,多年来一直在分析粒子物理数据。 过去几年中,我曾在卡尔斯鲁厄,日内瓦,圣保罗和芝加哥之间工作,目前居住在巴黎。 尽管这样的数据分析将成为设计比较任何城市的方法的垫脚石,但伦敦和巴黎的比较是由个人对这些城市的热爱所推动的。 ❤
You can find more about me on Linkedin.
您可以在Linkedin上找到有关我的更多信息。
Links to the project summary and code.
链接到项目摘要和代码 。

翻译自: https://towardsdatascience.com/a-tale-of-two-cities-e693c15b3ddb
双城记s001
http://www.taodudu.cc/news/show-997480.html
相关文章:
- rfm模型分析与客户细分_如何使用基于RFM的细分来确定最佳客户
- 数据仓库项目分析_数据分析项目:仓库库存
- 有没有改期末考试成绩的软件_如果考试成绩没有正常分配怎么办?
- 探索性数据分析(EDA):Python
- 写作工具_4种加快数据科学写作速度的工具
- 大数据(big data)_如何使用Big Query&Data Studio处理和可视化Google Cloud上的财务数据...
- 多元时间序列回归模型_多元时间序列分析和预测:将向量自回归(VAR)模型应用于实际的多元数据集...
- 数据分析和大数据哪个更吃香_处理数据,大数据甚至更大数据的17种策略
- 批梯度下降 随机梯度下降_梯度下降及其变体快速指南
- 生存分析简介:Kaplan-Meier估计器
- 使用r语言做garch模型_使用GARCH估计货币波动率
- 方差偏差权衡_偏差偏差权衡:快速介绍
- 分节符缩写p_p值的缩写是什么?
- 机器学习 预测模型_使用机器学习模型预测心力衰竭的生存时间-第一部分
- Diffie Hellman密钥交换
- linkedin爬虫_您应该在LinkedIn上关注的8个人
- 前置交换机数据交换_我们的数据科学交换所
- 量子相干与量子纠缠_量子分类
- 知识力量_网络分析的力量
- marlin 三角洲_带火花的三角洲湖:什么和为什么?
- eda分析_EDA理论指南
- 简·雅各布斯指数第二部分:测试
- 抑郁症损伤神经细胞吗_使用神经网络探索COVID-19与抑郁症之间的联系
- 如何开始使用任何类型的数据? - 第1部分
- 机器学习图像源代码_使用带有代码的机器学习进行快速房地产图像分类
- COVID-19和世界幸福报告数据告诉我们什么?
- lisp语言是最好的语言_Lisp可能不是数据科学的最佳语言,但是我们仍然可以从中学到什么呢?...
- python pca主成分_超越“经典” PCA:功能主成分分析(FPCA)应用于使用Python的时间序列...
- 大数据平台构建_如何像产品一样构建数据平台
- 时间序列预测 时间因果建模_时间序列建模以预测投资基金的回报
双城记s001_双城记! (使用数据讲故事)相关推荐
- 【数据科学】5个数据讲故事技巧,用于创建更有说服力的图和表
使用数字通常不被认为是性感的工作.毕竟,会计和数据录入等职业并不是这个数字时代最激动人心的职业. 但就像现在统治世界的曾经无耻的计算机爱好者一样,数据分析师目前被视为"就业市场的独角兽&qu ...
- 用数据讲故事:十大统计学/机器学习魔法指数
统计学和机器学习为数据分析提供理论基础,入门时我看过很多统计学相关书籍,复杂的公式和推导过程让我一度陷入迷茫.对于数据科学/分析师来说,如何使用统计学知识并应用到我们的分析场景中更为重要.本文主要基于 ...
- 用数据讲故事 英文版_使用数据的十大策略讲故事
用数据讲故事 英文版 介绍:(Introduction:) Creating charts and graphs is easy. Extracting the story from those gr ...
- 用数据讲故事 英文版_建立数据科学产品组合:讲故事与数据
用数据讲故事 英文版 This is the first in a series of posts on how to build a Data Science Portfolio. If you l ...
- 用数据讲故事:基于分析场景的17条Python使用小结
数据科学的编程需要非常灵活的语言,以最少的代码处理复杂的数据建模场景.作为一名数科小白,我对Python的第一认知是丰富的机器学习算法,但Python有超过12万个第三方库,覆盖从数据预处理.统计分析 ...
- 《用数据讲故事》读书笔记PPT——数据可视化与故事思维
20年初,首次阅读,制作了PPT. 21年夏天,重读该书,完善了PPT. 今发布于此.网站所限,图片清晰度有所降低. 2021/8/10 图书信息: 作者: [美] Cole Nussbaumer K ...
- 深度学习数据自动编码器_如何学习数据科学编码
深度学习数据自动编码器 意见 (Opinion) When I first wanted to learn programming, I coded along to a 4 hour long Yo ...
- 熊猫数据集_为数据科学拆箱熊猫
熊猫数据集 If you are already familiar with NumPy, Pandas is just a package build on top of it. Pandas pr ...
- Python:在Pandas数据框中查找缺失值
How to find Missing values in a data frame using Python/Pandas 如何使用Python / Pandas查找数据框中的缺失值 介绍: (In ...
最新文章
- 内核变量——Jiffies
- python多线程加速for循环_多线程-如何在Python的循环中对操作进行多线程
- Android多线程
- C语言改造二分法(Modified Binary Search)算法(附完整源码)
- php将字符串转换为json格式,js中将字符串转换为json格式的三种方法
- matlab符号函数绘图法_转载:MATLAB 符号函数作图
- 论文浅尝 - CIKM2021 | DT-GCN: 一种双曲空间中的数据类型感知的知识图谱表示学习模型...
- C语言fread和fwrite的用法详解
- java策略文件_[讨论]java类文件保护策略
- (52)CSS hack
- sharepoint 域认证的时候给用户一个友好的登陆界面
- SpringBoot 小技巧
- 高德地图,百度地图,腾讯地图,谷歌地图,坐标拾取器
- ThinkPHP自定义错误页面
- 科技感人工智能PPT模板推荐
- 数据库基础知识(1)--数据库php连接
- 实时网速怎么看快慢_如何知道网络的实时网速?4种方法轻松查询
- caffe从秃头到入门 /usr/bin/ruby -e “$(curl -fsSL https://raw.githubusercontent.com/Homebrew/install/master
- 百度AI战疫五十天:三场战役与一次胜利
- 选购摄像头前必看,摄像头参数科普
热门文章
- idea出现找不到实体类
- Android Studio调试时遇见Install Repository and sync project的问题
- 《JavaScript DOM编程艺术》笔记
- 使用jquery解析xml
- IPHONE 开发 7 -- Object C 02 字符串NSString 与 char* ,字符串的遍历,字符串的比较,截取与大小写改变,搜索字符串与替换字符串...
- 个人材料(上报公司)
- synchronized 和Lock区别
- 同步阻塞的BIO、同步非阻塞的NIO、异步非阻塞的AIO
- 如何把一个java程序打包成exe文件,运行在没有java虚
- C# 谈谈Interface和通过Interface传递web页面数据