ipywidgets_未来价值和Ipywidgets
ipywidgets
How to use Ipywidgets to visualize future value with different interest rates.
如何使用Ipywidgets可视化不同利率下的未来价值。
There are some calculations that even being easy becoming better with a visualization of his terms. Moreover, the sooner we start investing the more gains we will have in the future. Of course, there are several other variables in the equation of “the game of saving resources for the future” but now two variables will be presented here: interest rate and time.
Ť这里有一些计算方法,甚至易于与他的条件的可视化变得更好。 此外,我们越早开始投资,将来将获得更多收益。 当然,也有“节约资源,为未来的游戏”的公式中其他几个变量,但现在两个变量将在这里介绍: 利率和时间 。
未来价值 (Future Values)
The most basic principle of finance is: a dollar today is worth more than a dollar tomorrow. That means money has a time value.
财务的最基本原则是: 今天的一美元比明天的一美元值更多。 这意味着金钱具有时间价值。
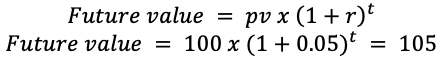
If you invest $100 in a bank account that pays interest of rate 5% a year. In the first year, you will earn interest of 0.05 $100 $5 and the value of your investment will grow to $105:
如果您在银行帐户中投资100美元,该银行帐户的年利率为5%。 在第一年,您将获得0.05美元的利息$ 100 $ 5,您的投资价值将增加到$ 105:
如果我们可以“看到”这一点? (And if we can “see” this?)
Now the same equation above can be presented using python. We can use the future value formula or utilize the library Numpy Financial .
现在,可以使用python呈现上述相同的方程式。 我们可以使用未来价值公式或使用Numpy Financial库。
The numpy financial module contains a function future value, .fv(rate, nper, pmt, pv), which allows you to calculate the future value of an investment as before with a few simple parameters:
numpy金融模块包含一个功能终值.fv(rate,nper,pmt,pv) ,它允许您像以前一样通过一些简单的参数来计算投资的终值:
rate: the rate of return of the investment
rate :投资回报率
nper: the lifespan of the investment
nper :投资寿命
pmt: the (fixed) payment at the beginning or end of each period (which is 0 in our example)
pmt :每个期间开始或结束时的(固定)付款(在我们的示例中为0)
pv: the present value of the investment
pv :投资的现值
It is important to note that in this function call, you must pass a negative value into the pv parameter if it represents a negative cash flow (cash going out).
重要的是要注意,在此函数调用中,如果它表示负现金流量(现金支出),则必须将负值传递到pv参数中。
First, we must import the libraries:
首先,我们必须导入库:
# Importing the librariesimport numpy as npimport numpy_financial as npfimport matplotlib.pyplot as pltThen, use Numpy’s .fv() function, calculate the future value of a $100 investment returning 5% per year for 2 years.
然后,使用Numpy的.fv()函数,计算100美元的投资在2年内每年返回5%的终值。
# Calculate investmentinvestment = npf.fv(rate=.05, nper=2, pmt=0, pv=-100)print("$" + str(round(investment, 2)))$110.25利率越高,您的储蓄增长越快 (The higher the interest rate, the faster your savings will grow)
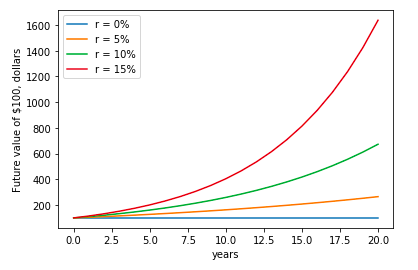
Next, you’ll see how plot different interest rates (0%, 5%, 10%, and 15%) with an investment of $100 in the same graph.
接下来,您将看到如何在同一张图中绘制以100美元投资的不同利率(0%,5%,10%和15%)。
figure = figsize=(10,8)y = [npf.fv(rate=np.linspace(0,0.15,num=4), nper=i, pmt=0, pv=-100) for i in range(21)]Using the function np.linspace(0, 0.15 , num=4) at rate allows plot 4 curves(num=4), in a range between 0 and 0.15.
以速率使用函数np.linspace(0,0.15,num = 4)允许绘制4条曲线(num = 4),范围在0到0.15之间。
plt.plot(y)plt.legend(["r = 0%", "r = 5%","r = 10%" , "r = 15%"])plt.ylabel('Future value of $100, dollars')plt.xlabel('years')As the rates are plotted from a function, to write the legend as an array is a way to present the four rates.
由于比率是从函数中绘制的,因此将图例写为数组是表示这四个比率的一种方法。
与Ipywidgets互动 (Interact with Ipywidgets)
Another way to see the impact of interest rate in your future value is by applying an interactive tool in your data. Ipywidgets is a library that uses interface (UI) controls for exploring code and data interactively.
查看利率对未来价值的影响的另一种方法是在数据中应用交互式工具。 Ipywidgets是一个使用界面(UI)控件以交互方式浏览代码和数据的库。
import ipywidgets as widgetsfrom IPython.display import display%matplotlib inlinedef show_fv(rate):    figure = figsize=(10,8)    y = [npf.fv(rate, nper=i, pmt=0, pv=-100) for i in range(21)]plt.plot(y)plt.ylabel('Future value of $100, dollars')    plt.xlabel('years')

controls = widgets.interactive(show_fv,rate=(0, .20, .01))display(controls)
The result is the graph interactive below:
结果是下面的交互式图:
Figure 2 presents the output of the code using the library Ipywidgets. This is a way to use this tool and know at the time the influence of a variable in your results.
图2展示了使用库Ipywidgets的代码输出。 这是使用此工具并了解变量在结果中的影响的一种方式。
翻译自: https://medium.com/analytics-vidhya/future-values-and-ipywidgets-ce45e4d6a076
ipywidgets
http://www.taodudu.cc/news/show-997560.html
相关文章:
- 用folium模块画地理图_使用Folium表示您的地理空间数据
- python创建类统计属性_轻松创建统计数据的Python包
- knn分类 knn_关于KNN的快速小课程
- 机器学习集群_机器学习中的多合一集群技术在无监督学习中应该了解
- 政府公开数据可视化_公开演讲如何帮助您设计更好的数据可视化
- 消费者行为分析_消费者行为分析-是否点击广告?
- 魅族mx5游戏模式小熊猫_您不知道的5大熊猫技巧
- 数据科学中的数据可视化
- 多重线性回归 多元线性回归_了解多元线性回归
- 如何使用Python处理丢失的数据
- 为什么印度盛产码农_印度农产品价格的时间序列分析
- tukey检测_回到数据分析的未来:Tukey真空度的整洁实现
- 到2025年将保持不变的热门流行技术
- 马尔科夫链蒙特卡洛_蒙特卡洛·马可夫链
- 数据分布策略_有效数据项目的三种策略
- 密度聚类dbscan_DBSCAN —基于密度的聚类方法的演练
- 从完整的新手到通过TensorFlow开发人员证书考试
- 移动平均线ma分析_使用动态移动平均线构建交互式库存量和价格分析图
- 静态变数和非静态变数_统计资料:了解变数
- 不知道输入何时停止_知道何时停止
- 掌握大数据数据分析师吗?_要掌握您的数据吗? 这就是为什么您应该关心元数据的原因...
- 微信支付商业版 结算周期_了解商业周期
- mfcc中的fft操作_简化音频数据:FFT,STFT和MFCC
- r语言怎么以第二列绘制线图_用卫星图像绘制世界海岸线图-第二部分
- rcp rapido_Rapido使用数据改善乘车调度
- 飞机上的氧气面罩有什么用_第2部分—另一个面罩检测器……(
- 数字经济的核心是对大数据_大数据崛起为数字世界的核心润滑剂
- azure第一个月_MLOps:两个Azure管道的故事
- 编译原理 数据流方程_数据科学中最可悲的方程式
- 解决朋友圈压缩_朋友中最有趣的朋友[已解决]
ipywidgets_未来价值和Ipywidgets相关推荐
- 使用Python和MetaTrader在5分钟内开始构建您的交易策略
In one of my last posts, I showed how to create graphics using the Plotly library. To do this, we im ...
- 迈向数据科学的第一步:在Python中支持向量回归
什么是支持向量回归? (What is Support Vector Regression?) Support vector regression is a special kind of regre ...
- scikit keras_Scikit学习,TensorFlow,PyTorch,Keras…但是天秤座呢?
scikit keras Welcome all! In the first episode of this series, I investigated the four most known ma ...
- 鸽子 迷信_人工智能如何帮助我战胜鸽子
鸽子 迷信 鸽子回避系统 (Pigeon Avoidance System) Disclaimer: You are reading Part 1 that gives an overview of ...
- 傅里叶变换 直观_A / B测试的直观模拟
傅里叶变换 直观 Many of us have heard, read, or even performed an A/B Test before, which means we have cond ...
- sap中泰国有预扣税设置吗_泰国餐厅密度细分:带有K-means聚类的python
sap中泰国有预扣税设置吗 Hi! I am Tung, and this is my first stories for my weekend project. What inspired this ...
- 地图 c-suite_C-Suite的模型
地图 c-suite We've all seen a great picture capture an audience of stakeholders. 我们所有人都看到了吸引利益相关者听众的美好 ...
- 置信区间估计 预测区间估计_估计,预测和预测
置信区间估计 预测区间估计 Estimation implies finding the optimal parameter using historical data whereas predict ...
- 学习深度学习需要哪些知识_您想了解的有关深度学习的所有知识
学习深度学习需要哪些知识 有关深层学习的FAU讲义 (FAU LECTURE NOTES ON DEEP LEARNING) Corona was a huge challenge for many ...
最新文章
- 47%德国企业认为人工智能较大的优势是提高生产效率
- python面试-Python面试
- Vue3中遇到问题:PostCSS plugin tailwindcss requires PostCSS 8 解决方案
- 前端要凉?微软开源Sketch2Code,草图秒变代码
- realmeq参数配置详情_realmeq2i参数_realmeq2i参数配置详情
- java网络编程实例_关于java网络编程的实例代码
- 网易“吃鸡”,干腾讯何事?
- CDI Features
- [Linux]磁盘端口I/O
- iptv鉴权 php,小白的IPTV折腾教程-双网融合/IPTV共享 - OPENWRT专版 - 恩山无线论坛 - Powered by Discuz!...
- mimics能导出什么格式_mimics教程
- Android WebView性能分析与优化
- C#使用libVLC制作视频播放器时自定义鼠标事件的捕获或者忽略
- BZOJ 5336: [TJOI2018]party Dp套Dp
- AI生成新春祝福海报,AIGC从“炫技”走向日常
- Matlab上位机开发(一) —— 了解上位机
- oracle期初余额录入,用金蝶kis录入数量初始数据的方法
- PDF Extra Premium v7.0.4622 多合一 PDF 编辑器直装版
- Linux文件类型之 管道
- 【软件工程大作业】快递代拿小程序项目 (第十组)