使用华盛顿特区地铁数据确定可获利的广告位置
深度分析 (In-Depth Analysis)
Living in Washington DC for the past 1 year, I have come to realize how WMATA metro is the lifeline of this vibrant city. The metro network is enormous and well-connected throughout the DMV area. When I first moved to the Capital city with no car, I often used to hop on the metro to get around. I have always loved train journeys and therefore unsurprisingly, metro became my most favorite way to explore this beautiful city. On my travels, I often notice the product placements and advertisements on metro platforms, near escalators/elevators, inside the metro trains, etc. A good analysis of the metro rider data would help the advertisers to identify which metro stops are the busiest at what times so as to increase the ad exposure. I chanced upon this free dataset and decided to plunge deep into it. In this article, I’ll walk you through my analysis.
在过去的一年中,住在华盛顿特区,我逐渐意识到WMATA地铁是这座充满活力的城市的生命线。 地铁网络非常庞大,并且在DMV区域内连接良好。 当我第一次没有汽车搬到首都时,我经常跳上地铁到处走走。 我一直喜欢火车旅行,因此毫不奇怪,地铁成为我探索这座美丽城市的最喜欢的方式。 在旅途中,我经常注意到地铁站台,自动扶梯/电梯附近,地铁列车内等的产品位置和广告。对地铁乘客数据的良好分析将有助于广告商确定哪些地铁站最繁忙时间,以增加广告曝光率。 我偶然发现了这个免费数据集,并决定深入其中。 在本文中,我将指导您进行分析。
Step 1: Importing necessary libraries
步骤1:导入必要的库
import pandas as pdimport numpy as npimport seaborn as snsimport matplotlib.pyplot as pltimport warningswarnings.filterwarnings("ignore")Step 2: Reading the data
步骤2:读取资料
Let us call our pandas dataframe as ‘df_metro’ which will contain the original data.
让我们将熊猫数据框称为“ df_metro”,它将包含原始数据。
df_metro = pd.read_csv("DC MetroData.csv"Step 3: Eyeballing the data and length of the dataframe
步骤3:查看数据和数据帧的长度
df_metro.head()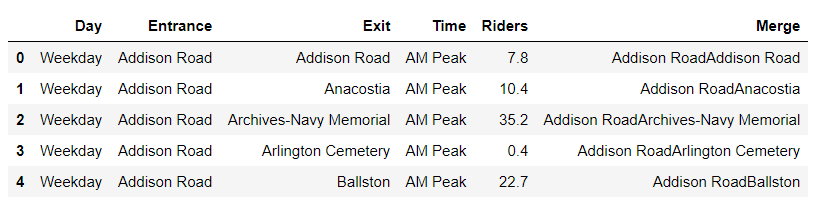
df_metro.columns
len(df_metro)
Step 4: Checking distinct values under different columns
步骤4:检查不同列下的不同值
Let us check what are the unique values in the column ‘Time’
让我们检查“时间”列中的唯一值是什么
df_metro['Time'].value_counts().sort_values()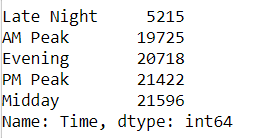
Unique values in the column ‘Day’ are as follows:
“天”列中的唯一值如下:
df_metro['Day'].value_counts().sort_values()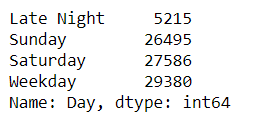
Next step is to analyze few questions.
下一步是分析一些问题。
Q1。 什么是受欢迎的入口和出口? (Q1. What are the popular entrances and exits?)
The distinct count of records for each metro stop arranged in descending order will give us which are popular entrances and exits.
每个地铁站按降序排列的独特记录数将为我们提供受欢迎的出入口。
df_metro['Entrance'].value_counts().sort_values(ascending=False).head()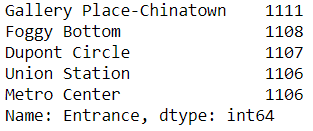
df_metro['Exit'].value_counts().sort_values(ascending=False).head()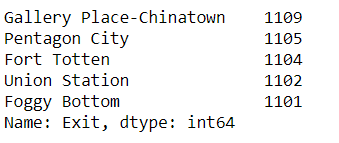
Popular locations seem to be
热门地点似乎
Gallery Place-Chinatown: Major attractions are Capital One Arena (drawing big crowds for sporting events and music concerts), restaurants, bars, etc.
唐人街画廊广场:主要景点是首都一号竞技场(吸引大量体育赛事和音乐会),餐馆,酒吧等。
Foggy Bottom: Government offices in the area makes it a popular commute destination
有雾的底部:该地区的政府机关使其成为受欢迎的通勤目的地
Pentagon City: Its location just 2 miles away from the National Mall in downtown Washington makes the area a popular site for hotels and businesses.
五角大楼市:其位置距华盛顿市中心的国家购物中心仅2英里,使该地区成为酒店和企业的热门地点。
Dupont Circle: International Embassies located in the area
杜邦环岛:位于该地区的国际使馆
Union Station: An important location for the long-distance travelers
联合车站:长途旅行者的重要位置
Metro center: A popular downtown location
地铁中心:市中心热门地点
Fort Totten: Its Metro station serves as a popular transfer point for the Green, Yellow and Red lines
托滕堡(Fort Totten):其地铁站是绿线,黄线和红线的热门换乘点
Takeaway: Advertisers should target the above popular metro stations that have the high rider footfall to grab maximum buyer attention.
要点:广告商应该针对那些拥有较高人流的热门地铁站,以吸引最大的买家注意力。
Q2。 在一周的不同日期/时间,乘车情况如何? (Q2. What does the ridership look like during different days/times of the week?)
This can be answered by simply plotting the riders’ data across different days and times. We will make use of the seaborn library to create this viz.
只需绘制不同日期和时间的骑手数据即可解决。 我们将利用seaborn库来创建此viz。
sns.set_style("whitegrid") ax = sns.barplot(x="Day", y="Riders", hue="Time", data = df_metro, palette = "inferno_r")ax.set(xlabel='Day', ylabel='# Riders')plt.title("Rider Footfall on different Days/Times")plt.show(ax)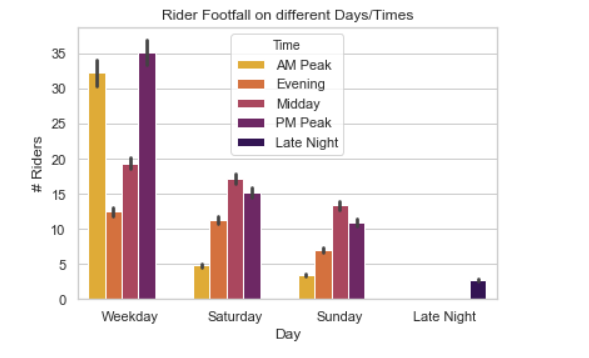
Takeaway: Metro is a popular choice of work commute in the city and therefore, as expected the rider footfall is the highest during the Weekday, particularly more so during AM Peak and PM Peak. Companies planning to roll out new products should target these slots to attract attention and generate interest in the consumers. For advertising opportunities during the weekend, the most attractive time slot seems to be Midday, closely followed by PM Peak.
要点:地铁是城市通勤的一种流行选择,因此,正如预期的那样,乘客的人流量在工作日最高,尤其是在AM Peak和PM Peak。 计划推出新产品的公司应针对这些广告位,以吸引注意力并引起消费者的兴趣。 对于周末的广告机会而言,最吸引人的时间段似乎是中午,紧随其后的是PM Peak。
Q3。 在典型的工作日中,哪些繁忙的路线? (Q3. What are the busy routes during a typical weekday?)
To analyze this question, we are going to consider a footfall of more than 500 riders at any given metro station. First, we will create a dataframe ‘busy_routes’ that contain data about routes with >500 riders. Second, we will filter this dataframe to contain data for only ‘AM Peak’. Third, we will sort this filtered output.
为了分析这个问题,我们将考虑在任何给定的地铁站有500多名乘客的人流。 首先,我们将创建一个数据框“ busy_routes”,其中包含有关骑行人数超过500人的数据。 其次,我们将过滤此数据框以仅包含“ AM Peak”的数据。 第三,我们将对过滤后的输出进行排序。
busy_routes = weekday[weekday['Riders']>500][['Merge', 'Time', 'Riders']]peak_am = busy_routes.query('Time=="AM Peak"')peak_am.sort_values('Riders').tail()
Repeating the same steps for ‘PM Peak’.
对“ PM Peak”重复相同的步骤。
peak_pm = busy_routes.query('Time=="PM Peak"')len(peak_pm)peak_pm.sort_values('Riders').tail()
Takeaway: We see that the routes with high footfall during AM Peak are the same with high footfall during the PM Peak such as West Falls Church — Farragut West, Vienna-Farragut West, Shady Grove — Farragut North. This tells us that these are the popular work commute routes as people going to work in Farragut during AM peak return to their homes in Vienna/Falls Church/Shady Grove during PM peak. Advertisers should target these high traffic commute routes to maximize on their advertisements and product placements.
要点:我们发现,在AM峰期间人流量大的路线与PM峰期间人流量大的路线相同,例如西瀑布教堂-西法拉格特,西维也纳-法拉古特,谢迪格罗夫-北法拉格特。 这告诉我们,这是最受欢迎的工作通勤路线,因为人们在AM高峰期间前往Farragut的工作在PM高峰期间返回维也纳/ Falls教堂/ Shady Grove的家中。 广告商应针对这些高流量的通勤路线,以最大程度地利用其广告和产品展示位置。
Q4。 周末有哪些热门的地铁路线? (Q4. What are the popular metro routes during the weekends?)
Let us perform a similar analysis as we did for the weekday. Since we are dealing with the weekend data here, we will consider metro stations with a footfall of more than 200 riders.
让我们进行与工作日相似的分析。 由于我们在这里处理周末数据,因此我们将考虑拥有200多名乘客的地铁站。
saturday = df_metro[df_metro['Day']=='Saturday']busy_routes_sat = saturday[saturday['Riders']>200][['Merge', 'Time', 'Riders']]busy_routes_sat.sort_values('Riders').tail()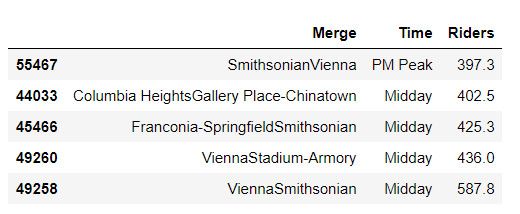
sunday = df_metro[df_metro['Day']=='Sunday']busy_routes_sun = sunday[sunday['Riders']>200][['Merge', 'Time', 'Riders']]busy_routes_sun.sort_values('Riders').tail()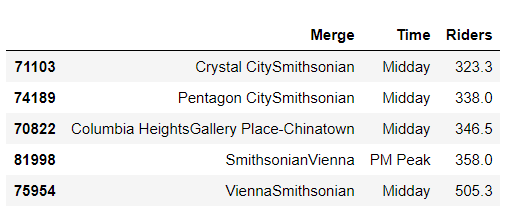
Takeaway: Smithsonian is an extremely popular destination with tourists as well as city-dwellers alike because of several museums and proximity to White House, The Capitol, national monuments, war memorials, etc. Our analysis tells us that the crowds head out from Crystal City, Pentagon City, Vienna, Franconia to the Smithsonian during the Midday, and return in the PM Peak. Most of these crowds are young families with kids which are an ideal audience for companies launching products meant for younger populations including children.
要点:史密森尼博物馆是一个非常受游客和城市居民欢迎的目的地,因为它拥有数个博物馆,而且邻近白宫,国会大厦,国家古迹,战争纪念馆等。我们的分析告诉我们,人群从水晶城出发,五角大楼市,维也纳,弗兰肯行政区到中午的史密森尼博物馆,然后在PM山顶返回。 这些人群中大多数是有孩子的年轻家庭,这是公司推出针对包括儿童在内的年轻人口产品的理想受众。
Q5。 作为广告客户,我应该在“深夜”中定位到哪些位置? (Q5. As an advertiser, which locations should I target during Late Night?)
We will do a similar analysis as above to identify which metro stations are ideal for putting out advertisements late in the night. For the ‘Late Night’, we will consider metro stations with a footfall of >50 riders.
我们将进行与上述类似的分析,以确定哪些地铁站最适合在深夜发布广告。 对于“深夜”,我们将考虑载客量超过50人的地铁站。
late_night = df_metro[df_metro['Day']=='Late Night']busy_routes_latenight = late_night[late_night['Riders']>50][['Merge', 'Time', 'Riders']]busy_routes_latenight.sort_values('Riders').tail()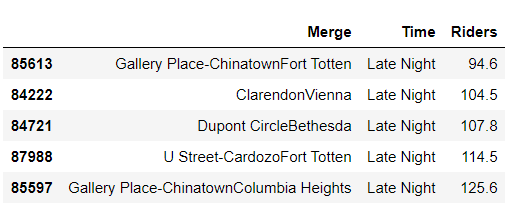
Takeaway: We see that late night the riders ride the metro from popular locations such as Gallery Place, Clarendon, Dupont Circle and U Street with a buzzing nightlife. Therefore, advertisers wanting to appeal to this section of the population (which normally would be a younger population) should potentially target these metro stations to grab maximum attention.
要点:我们看到深夜的时候,骑手们从热门的地方乘坐地铁,例如Gallery Place,Clarendon,Dupont Circle和U Street,那里的夜生活很热闹。 因此,想要吸引这一部分人群(通常是较年轻的人群)的广告商应该以这些地铁站为目标,以吸引最大的关注。
Closing remarks: This dataset was fairly straightforward and hence, we did not spend a lot of time cleaning and wrangling the data. With the given data, we were able to find sweet spots that would ensure maximum moolah for advertisers’ money. Thanks for reading!
结束语:该数据集非常简单,因此,我们没有花费很多时间来清理和整理数据。 根据给定的数据,我们能够找到最佳点,以确保最大程度地减少广告客户的收入。 谢谢阅读!
翻译自: https://towardsdatascience.com/identify-profitable-advertising-locations-using-washington-dc-metro-data-a03c5c4fc18f
http://www.taodudu.cc/news/show-4440244.html
相关文章:
- 地铁读书笔记-容量规划
- 地铁自动驾驶模型,地铁列车牵引系统整车模型。
- 地铁线路图显示效果php,基于HTML5制作在线上海地铁图
- 一道对10年间中国行政区划个数进行对比的Python考试题
- 省市区行政区编码和具体行政区名转换
- 百度地图根据经纬度判断点是否在行政区内
- R语言地图可视化
- 爬取2017年底最新中国全国五级行政区划代码省市区县乡镇村MySQL数据库
- JadePool应用范例:实现中国行政区划管理
- 全球行政区划数据库 地理数据库
- java 中国地图_高级UI-svg实现可交互的中国地图
- Python 爬虫 中国行政区划信息爬取 (初学者)
- 信息技术时代杂志信息技术时代杂志社信息技术时代编辑部2022年第9期目录
- python课程设计 文字游戏 魔塔3
- 贪官产生的本质是什么——谈谈人性与制度的博弈未来
- 等保培训.04.主机系统安全测评
- 操作系统实验:添加系统调用修改主机名(hostname)
- VMware虚拟机解决空间不足,增加磁盘空间(磁盘扩容)
- 详谈 UNIX 环境进程异常退出
- mysql 遗失对主机的连接,MySQL远程连接丢失问题解决方法(Lost connection to MySQL server)...
- gethostbyname函数用域名或主机名获取IP地址
- VMware虚拟机 扩展Ubuntu系统磁盘空间方法
- Linux网络管理,NAT网络配置,修改主机名称,主机映射,防火墙,系统启动级别,用户和用户组,为用户配置sudoer权限,文件权限管理,打包和压缩
- Docker的退出后进入
- 主机连接VMware虚拟机的配置过程
- docker与宿主机共享内存通信
- Docker的名称空间
- Linux 主机网络接入配置
- ESXi处理主机错误无法进入维护模式
- ansible主机清单和动态主机清单
使用华盛顿特区地铁数据确定可获利的广告位置相关推荐
- 华盛顿特区与其他地区的差别_使用华盛顿特区地铁数据确定可获利的广告位置...
华盛顿特区与其他地区的差别 深度分析 (In-Depth Analysis) Living in Washington DC for the past 1 year, I have come to r ...
- 实战 | Kaggle竞赛:华盛顿特区首都自行车租赁预测
大家好,我是木木~ 今天为大家带来一篇关于Kaggle竞赛的实战!话不多说,直接上代码 01 准备数据 使用数据集: 华盛顿特区首都自行车租赁数据集 背景描述: 自行车共享系统是租用自行车的一种方式, ...
- 全国各大城市的地铁数据、json格式
地铁线数据是常用的基础数据,本人利用爬虫程序爬取了全国所有城市地铁数据,整理成了json文件格式,可供下载,目前全国有40多个城市有地铁,全部包含,以各大城市名称拼音做key,值是数组,数组内每个一个 ...
- 如何从高德获取地铁数据
概述 本文讲讲如何在高德获取地铁数据及后期处理,以北京为例. 实现 获取数据 打开高德地铁,按下F12打开调试模式,切换到network面板,如下: 点击右键,"Open in new ta ...
- Python爬虫实战,pyecharts模块,Python实现中国地铁数据可视化
前言 利用Python实现中国地铁数据可视化.废话不多说. 让我们愉快地开始吧~ 开发工具 Python 版本:3.6.4 相关模块: requests模块; wordcloud模块; 熊猫模块; n ...
- php地铁,php 抓取自如友家首页的区域和地铁数据
步骤 使用composer安装 php抓取扩展包 composer require jaeger/querylist 分析自如首页html结构 经过分析发现区域和地铁数据在类名.clearfix.fi ...
- 2019全球人才竞争力指数显示,华盛顿特区在城市排名中表现最出色
创业人才已经成为衡量相对人才竞争力的关键因素. 小型高收入经济体和美国依然吸引人才 华盛顿特区在城市排名中表现最出色. 五年分析显示,不平等经济体之间的人才差距不断扩大. 2019全球人才竞争力指数( ...
- 如何搜集一个区域的地铁数据、地质/水文图、卫星/电子图,并整合到ArcGIS中
在此分享一个实习经历:如何收集广州的在建地铁数据.地质/水文图.人口分布图,以及如何在ArcGIS中进行配准. 1.地铁数据 搜集在建地铁数据时,我最先想到的是访问广州地铁局的官网,当然它并没有,类似 ...
- 【Python Onramp】7. web端可视化:北京地铁数据统计分析实例以及简易Echarts绘图
系列文章目录 见[Python Onramp] 0. 卷首语 上一篇:[Python Onramp]6.一篇文章了解web开发要点:用Python开发简易的网页端成绩查询系统 下一篇:[Python ...
最新文章
- canvas js 绘图插件_[开盖即食]小程序图表插件eCharts实战
- Eclipse 自动注释的设置
- NopCommerce用.net core重写ef
- 公司新来的小可爱,竟然把内存搞崩了!
- 关于lock_guard使用细节
- web可用性测试_Web开发人员和设计人员的最佳可用性测试工具
- C语言课后习题(56)
- 【原创】大端和小端字节序的细节
- mkfs.xfs 命令找不到的解决方法
- SNS网站获取导入MSN联系人的方法
- 网站整体策划书的撰写
- 51单片机一些软件的使用
- 软件性能测试pdf,软件性能测试报告模板.pdf
- 确定自动驾驶汽车安全评估指标的挑战
- 变上限积分的连续性和可导性
- XYplorer使用教程
- 挪威是这样养三文鱼的--转帖
- 南宁琅东的机器人餐厅_南宁这几家私房菜藏得深,人气却只增不减,真是菜香不怕巷子深~...
- 用illustrator、AI将边框线转换为填充形状
- php fpm 重启命令,php-fpm怎么重新启动