先知模型 facebook_Facebook先知
先知模型 facebook
什么是先知? (What is Prophet?)
“Prophet” is an open-sourced library available on R or Python which helps users analyze and forecast time-series values released in 2017. With developers’ great efforts to make the time-series data analysis be available without expert works, it is highly user-friendly but still highly customizable, even to non-expert users. How lovely!!
“ Prophet”是可在R或Python上使用的开源库,可帮助用户分析和预测2017年发布的时间序列值。由于开发人员的巨大努力,使得无需专家工作即可进行时间序列数据分析,用户友好,但仍然高度可定制,甚至对非专业用户也是如此。 多么可爱!!
In this article, starting from default model run, I tried to summarize any available tuning options, particularly useful ones, to provide better prediction, although it may not be literally everything because there are so many customizable options in Prophet! I also gave some Python example codes and cheat sheet-like exhibits.
在本文中,从默认模型运行开始,我试图总结任何可用的调整选项,尤其是有用的调整选项,以提供更好的预测,尽管由于Prophet中有许多可自定义的选项,所以它可能并不是全部内容! 我还给出了一些Python示例代码和类似备忘单的展览。
目录: (Table of Contents:)
-具有默认选项设置的快速入门代码(在Python中) (- Quick Start Code (in Python) with Default Option Setting)
-先知选项备忘单和使用示例 (- Prophet Options Cheat Sheets And Use Examples)
- Uncertainty Options / Trend Options / Holiday Options不确定性选项/趋势选项/假日选项
- Seasonality Options季节性选项
- Adding Regressors / Model Diagnostics添加回归器/模型诊断
-先知的背景数学 (- Background Math of Prophet)
-先知不做的事 (- What Prophet Does Not Do)
- Prophet does not allow non-Gaussian noise distribution (at the moment)先知不允许(此时)非高斯噪声分布
- Prophet does not take autocorrelation on residual into account先知不考虑残差的自相关
- Prophet does not assume stochastic trend先知不假设随机趋势
-尾注 (- End Note)
具有默认选项设置的快速入门代码(在Python中) (Quick Start Code (in Python) with Default Option Setting)
Prophet can handle;
先知可以应付;
- trend with its changepoints,趋势及其变化点,
- seasonality (yearly, weekly, daily, and other user-defined seasonality),季节性(每年,每周,每天和其他用户定义的季节性),
- holiday effect, and假期效应,以及
- input regressors输入回归
as model components, and there’s also uncertainty options to control the prediction uncertainty interval.
作为模型的组成部分,还有不确定性选项来控制预测不确定性间隔。
Here’s what Prophet default functions provide to each of the components.
这是Prophet默认功能提供给每个组件的功能。

Below is a quick-start Python code, with default setups.
以下是具有默认设置的快速入门Python代码。
You may find everything is prepared to be user-friendly without any special care about the time-series data handling. Once you are familiar with basic Python data modeling using sklearn APIs, Prophet code should also look similar.
您可能会发现所有内容都易于使用,无需对时间序列数据处理进行任何特别护理。 熟悉使用sklearn API的基本Python数据建模后,Prophet代码也应该看起来相似。
Data used in the exercise throughout this post is the data of log-transformed daily page views of the Wikipedia page for Peyton Manning, an American Football player, prepared and distributed by Prophet team.
在本博文中,练习中使用的数据是先知团队准备和分发的,美国足球运动员佩顿·曼宁 ( Peyton Manning)维基百科页面上日志转换后的每日页面浏览量数据。
import pandas as pd
import matplotlib.pyplot as pltfrom fbprophet import Prophet# Load test data: log-transformed daily page views for the Wikipedia page for Peyton Manning.
df = pd.read_csv("https://raw.githubusercontent.com/facebook/prophet/master/examples/example_wp_log_peyton_manning.csv")# Model fit
m = Prophet() #Instanticate from Prophet class.
m.fit(df) # Fit the Prophet model.# Predict
future = m.make_future_dataframe(periods=365) # Make future date data frame for the next 365 days (it gives daily because it follows the frequency in input dataframe by default).
forecast = m.predict(future) # Predict future value.# Plot results
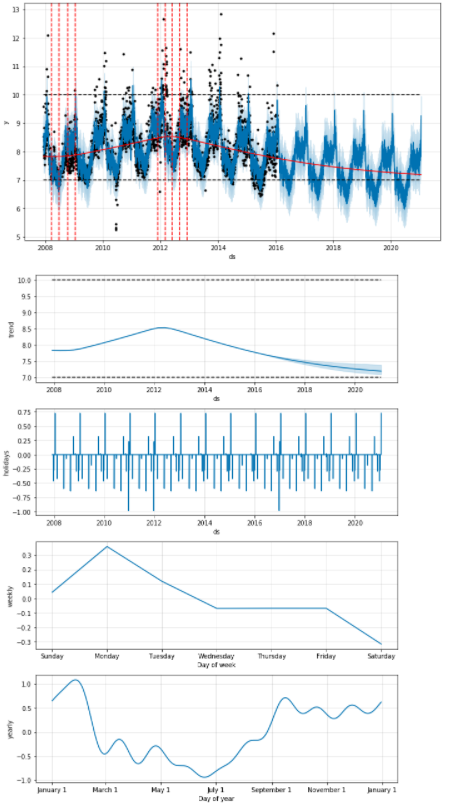
fig1 = m.plot(forecast) # Plot the fit to past data and future forcast.
fig2 = m.plot_components(forecast) # Plot breakdown of components.
plt.show()
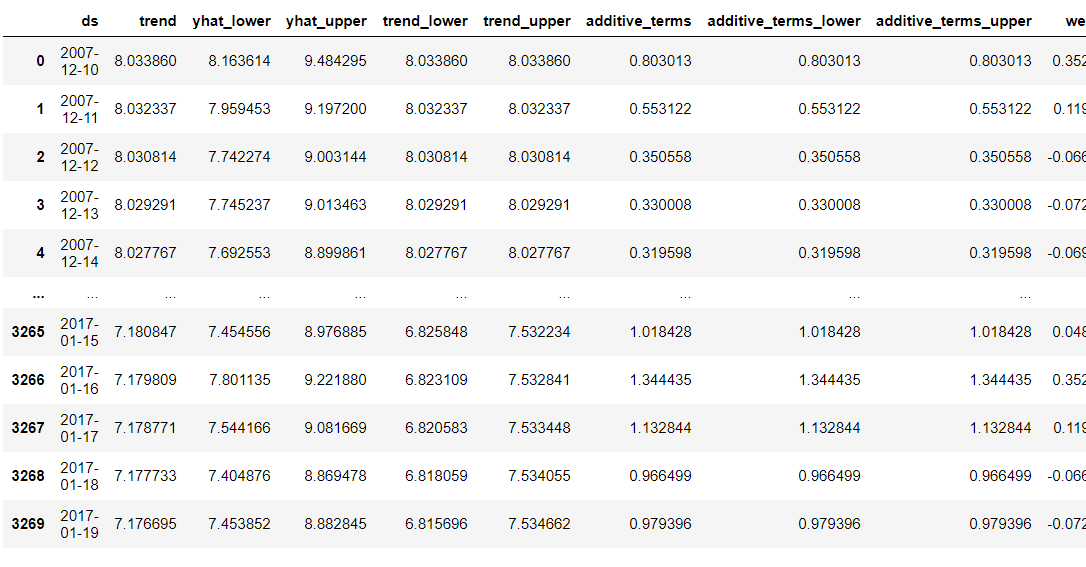
forecast # Displaying various results in table format.What I like here particularly is “make_future_dateframe” function because making a dataset for future prediction in time-series analysis is usually unpleasant moment because it requires datetime handling. Here with Prophet, just giving the length of future period will provide you the necessary dataframe.
我在这里特别喜欢的是“ make_future_dateframe”函数,因为为时序分析中的将来预测生成数据集通常是不愉快的时刻,因为它需要日期时间处理。 在先知的帮助下,只要给出未来的时长即可为您提供必要的数据框。
Here’s the set of output plots I got from the code.
这是我从代码中获得的一组输出图。

先知选项备忘单和使用示例 (Prophet Options Cheat Sheets And Use Examples)
不确定性选项/趋势选项/假日选项 (Uncertainty Options / Trend Options / Holiday Options)
There are options to control uncertainty, trend (type (or mode), changepoint, and visualization), and holiday effect (country or user-input). Here’s a summary:
有一些选项可控制不确定性,趋势(类型(或模式),变更点和可视化)和假日影响(国家或用户输入)。 总结如下:

Also, here’s a Python code example with the use of some of the options.
另外,这是一个使用某些选项的Python代码示例。
import pandas as pd
import matplotlib.pyplot as pltfrom fbprophet import Prophet
from fbprophet.plot import add_changepoints_to_plot# Load test data: log-transformed daily page views for the Wikipedia page for Peyton Manning.
df = pd.read_csv("https://raw.githubusercontent.com/facebook/prophet/master/examples/example_wp_log_peyton_manning.csv")
df['cap'] = 10 # Saturating maximum
df['floor'] = 7 # Saturating minimum# Model setup
m = Prophet(growth='logistic')
m.add_country_holidays(country_name='US') # Adding US holiday regressor
m.fit(df) # Future data generation
future = m.make_future_dataframe(periods=365*5)
future['cap'] = 10 # Saturating maximum
future['floor'] = 7 # Saturating minimum# Future forecast
forecast = m.predict(future) # Visualize
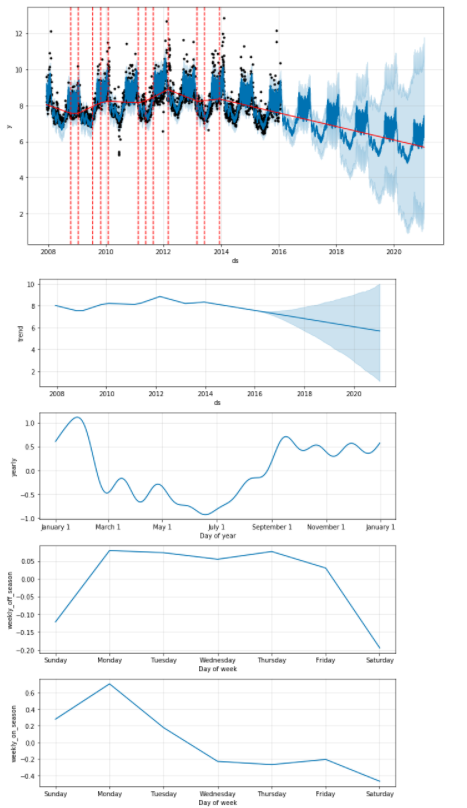
fig1 = m.plot(forecast) # Plot the fit to past data and future forcast.
a = add_changepoints_to_plot(fig1.gca(), m, forecast)
fig2 = m.plot_components(forecast) # Plot breakdown of components.
plt.show()You can see the plot now has the trade changepoints information, and the trade follow the logistic curve having floor and cap, although I don’t think it is reasonable to apply logistic trend for the data after log-transformation. See the component plots now also show the holiday effect.
您可以看到该图现在具有交易变更点信息,并且交易遵循具有下限和上限的逻辑曲线,尽管我认为对数转换后对数据应用逻辑趋势并不合理。 现在查看组件图也显示了假日效果。
季节性选项 (Seasonality Options)
There are a lot of options in Prophet to control seasonality. Yearly, weekly, and daily seasonality and their granularity; mode of seasonality (additive/multiplicative); user-defined seasonality including conditional seasonality.
先知有很多选择来控制季节性。 每年,每周和每天的季节性及其粒度; 季节性模式(加法/乘法); 用户定义的季节性,包括有条件的季节性。

Here’s an example using conditional weekly seasonality.
这是一个使用有条件的每周季节性的示例。
import pandas as pd
import matplotlib.pyplot as pltfrom fbprophet import Prophet
from fbprophet.plot import add_changepoints_to_plot# Load test data: log-transformed daily page views for the Wikipedia page for Peyton Manning.
df = pd.read_csv("https://raw.githubusercontent.com/facebook/prophet/master/examples/example_wp_log_peyton_manning.csv")def is_nfl_season(ds):date = pd.to_datetime(ds)return (date.month > 8 or date.month < 2)df['on_season'] = df['ds'].apply(is_nfl_season) #on_season dummy.
df['off_season'] = ~df['ds'].apply(is_nfl_season) #off_season dummy.# set user-defined seasonality and fit
m = Prophet(weekly_seasonality=False)
m.add_seasonality(name='weekly_on_season', period=7, fourier_order=3, condition_name='on_season')
m.add_seasonality(name='weekly_off_season', period=7, fourier_order=3, condition_name='off_season')
m.fit(df)# Make the same columns to future data.
future = m.make_future_dataframe(periods=365*5) # Make future date data frame for the next 365 days (it gives daily because it follows the frequency in input dataframe by default).
future['on_season'] = future['ds'].apply(is_nfl_season)
future['off_season'] = ~future['ds'].apply(is_nfl_season)# Predict future value.
forecast = m.predict(future)# Plot results
fig1 = m.plot(forecast) # Plot the fit to past data and future forcast.
a = add_changepoints_to_plot(fig1.gca(), m, forecast)
fig2 = m.plot_components(forecast) # Plot breakdown of components.
plt.show()
You can find the on-season weekly seasonality and off-season weekly seasonality are also plotted (and look very different, which indicates they worth splitting.)
您会发现还绘制了季节的每周季节性和季节的每周季节性(并且看起来非常不同,表明它们值得拆分)。
添加回归器/模型诊断 (Adding Regressors / Model Diagnostics)
Prophet also allow to input regressors (or explanatory variables, or features). Just adding columns to input data and future data and tell the model about them using ‘add_regressor’.
先知还允许输入回归变量(或解释变量或特征)。 只需在输入数据和将来的数据中添加列,然后使用“ add_regressor”将其告知模型。
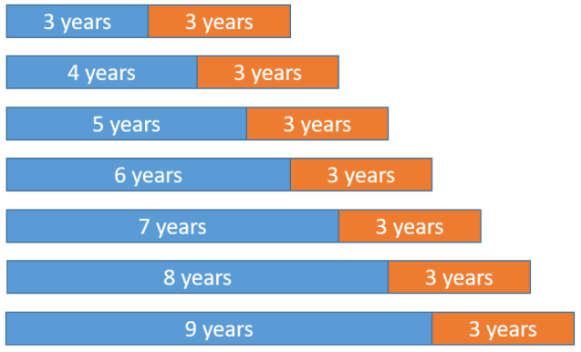
Last but not the least, Prophet has many useful functionality to do model diagnostics, cross-validation in a way of “rolling origin” (see picture on the left), and output of performance metrics.
最后但并非最不重要的一点是,Prophet具有许多有用的功能,可以进行模型诊断,以“滚动原点”的方式进行交叉验证(参见左图)以及性能指标的输出。

Here’s an example using cross-validation option.
这是使用交叉验证选项的示例。
import pandas as pd
import matplotlib.pyplot as plt
from IPython.display import displayfrom fbprophet import Prophet
from fbprophet.diagnostics import cross_validation, performance_metrics
from fbprophet.plot import add_changepoints_to_plot, plot_cross_validation_metric# Load test data: log-transformed daily page views for the Wikipedia page for Peyton Manning.
df = pd.read_csv("https://raw.githubusercontent.com/facebook/prophet/master/examples/example_wp_log_peyton_manning.csv")m = Prophet()
m.fit(df)# Execute cross validation
df_cv = cross_validation(m, initial='730 days', period='180 days', horizon = '365 days')
pm = performance_metrics(df_cv, rolling_window=0.1)
display(pm.head(),pm.tail())
fig = plot_cross_validation_metric(df_cv, metric='mape', rolling_window=0.1)
plt.show()
Here are what we get from the codes. 6 different types of metrics are shown by each time horizon, but by taking moving average over 37 days in this case (can be changed by ‘rolling_window’ option).
这是我们从代码中得到的。 每个时间范围都会显示6种不同类型的指标,但是在这种情况下,可以采用37天的移动平均值(可以通过“ rolling_window”选项进行更改)。
The metrics can be also plotted so that you can check visually how things change over the time horizons.
还可以绘制度量标准,以便您可以直观地检查时间范围内事物的变化。

先知的背景数学 (Background Math of Prophet)
Math in Prophet is well-discussed in their paper “Forecasting at Scale” or other Medium articles.
先知数学在他们的论文“大规模预测”或其他Medium文章中得到了充分讨论。
Based on “Forecasting at Scale” and their model in the Prophet module, the main formula of the model is described as follows:
基于Prophet模块中的“大规模预测”及其模型,模型的主要公式描述如下:
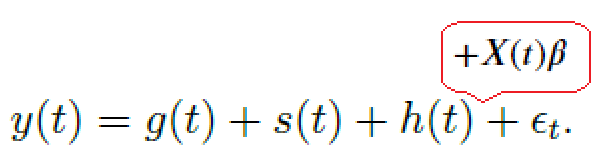
, where
,在哪里

Respectively,
分别,
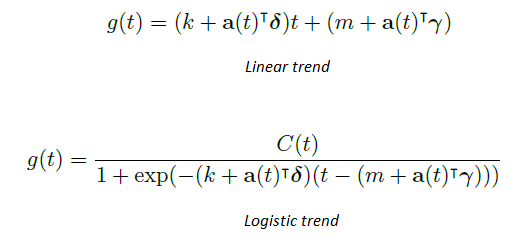
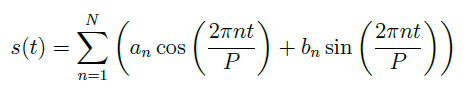
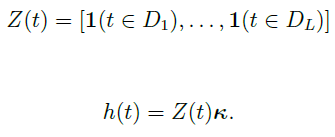
I will not talk too much about the details of the formula here, just recommend reading their paper “Forecasting at Scale” once for more details.
在这里,我不会过多地讨论公式的详细信息,只建议阅读他们的论文“大规模预测”以获取更多详细信息。
Any parameters are inferred using MCMC simulated on Stan — MAP estimate (Newton method or L-BFGS) or sampling depending on ‘mcmc_samples’ option.
使用在Stan — MAP估计(牛顿法或L-BFGS)上模拟的MCMC或根据“ mcmc_samples”选项进行采样可以推断出任何参数。
先知不做什么 (What Prophet Does Not Do)
先知不允许(此时)非高斯噪声分布 (Prophet does not allow non-Gaussian noise distribution (at the moment))
In Prophet, noise distribution is always Gaussian and pre-transformation of y values is the only way to handle the values following skewed distribution.
在先知中,噪声分布始终是高斯分布,并且y值的预转换是处理倾斜分布后的值的唯一方法。
This is a topic actively discussed in one of issues of the Prophet GitHub repository here and possible code customization to allow Poisson and Negative Binomial distribution in case the target value is a count data was given in the discussion.
这是在此处的Prophet GitHub存储库中的一个问题中积极讨论的主题,并且可能的代码自定义以允许Poisson和负二项式分布,以防在讨论中给出目标值为计数数据的情况。
先知不考虑残差的自相关 (Prophet does not take autocorrelation on residual into account)
Since epsilon noise portion in the formula assume i.i.d. normal distribution, the residual is not assumed to have autocorrelation, unlike ARIMA model.
由于公式中的ε噪声部分呈正态分布,因此与ARIMA模型不同,残差不具有自相关性。
Actually, when we plot the ACF and PACF after the fit of Peyton Manning data, we will see clear AR(1) tendency — exponentially decaying ACF, high PACF at t=1 and close to zero PACF at t≥2.
实际上,当我们根据Peyton Manning数据拟合绘制ACF和PACF时,将看到清晰的AR(1)趋势-ACF呈指数衰减,t = 1时PACF高,t≥2时PACF接近零。
# After getting forecast dataframe using user-defined seasonality "on-season"/"off-season" above...from statsmodels.graphics.tsaplots import plot_pacf, plot_acfdf['ds'] = pd.to_datetime(df['ds'],format='%Y-%m-%d')
df_res = df.merge(forecast,how="inner",on="ds")
df_res['residual'] = df_res['y'] - df_res['yhat']
plot_acf(df_res['residual'])
plot_pacf(df_res['residual'])
plt.show()
And, when I created a new data frame having lagged value and tested to add it as a regressor just like manually prepared AR(1) model, the ACF and PACF indicated the white noise’s ones, although this approach is not implemented in the Prophet therefore unable to give future prediction in a regular use of the Prophet functions.
而且,当我创建一个具有滞后值的新数据帧并像手动准备的AR(1)模型一样进行测试以将其添加为回归变量时,ACF和PACF会指示白噪声,尽管先知没有实现此方法。无法定期使用先知函数给出未来的预测 。


This topic is discussed in one of the issues of the Prophet GitHub repository here. An interesting idea from Ben Letham about MA(1) case was to use the prior time point’s residual for a regressor of next time point value. Since we do not know the true value of residual until we fit the true model, the estimation would be iterative, something like boosting. Again, in this approach the future prediction can not be given by the regular use of Prophet functions.
在此处的Prophet GitHub存储库中的一个问题中讨论了此主题。 本·莱瑟姆(Ben Letham)关于MA(1)情况的一个有趣想法是将先前时间点的残差用于下一时间点值的回归。 由于在拟合真实模型之前,我们不知道残差的真实值,因此估算将是迭代的,类似于增强。 同样,在这种方法中,无法通过常规使用先知函数来给出未来的预测。
先知不假设随机趋势 (Prophet does not assume stochastic trend)
Prophet’s trend component is always deterministic+possible changepoints and it won’t assume stochastic trend unlike ARIMA. See this web page for the discussion of ‘stochastic trend vs. deterministic trend’.
先知的趋势成分始终是确定性+可能的变化点,并且不会像ARIMA那样假设随机趋势。 请参阅此网页 ,以了解“随机趋势与确定性趋势”。
Usually, we do unit root tests to know if the data is stationary or trend stationary. When rejected, we do differencing the data until we know the data is stationary, which also give stochastic trend component. Using deterministic trend (without changepoints) underestimates the uncertainty compared to stochastic trend, although Prophet looks using changepoints components and its future uncertainty to cover up that underestimate.
通常,我们进行单位根检验以了解数据是平稳的还是趋势平稳的。 当被拒绝时,我们将对数据进行差异化处理,直到我们知道数据是固定的为止,这也将给出随机趋势分量。 与随机趋势相比,使用确定性趋势(无变化点)会低估不确定性,尽管先知似乎使用变化点成分及其未来的不确定性来掩盖这一低估。
尾注 (End Note)
Prophet has high usability with many customizable options to handle most of the necessary extensions to model the time-series data. It is well-modularized as one package so that users can enjoy them without embarrassing exposure to the math of the model.
Prophet具有很高的可用性,具有许多可自定义的选项,可以处理大多数必要的扩展,以对时间序列数据进行建模。 它作为一个组件进行了很好的模块化,因此用户可以在不尴尬地接触模型数学的情况下享受它们。
Model itself is based on simple building blocks of separate components of the effects. Those effects are estimated by MCMC on Stan. This simplicity gives high visibility to each effect and should provide a great basis of discussion between experts and non-experts, although it somewhat sacrifices some of time-series modeling considerations, which are beyond the ‘building block’ approach, such as autocorrelation or stochastic trend.
模型本身基于效果的独立组件的简单构建块。 MCMC对Stan估计了这些影响。 这种简单性使每种效果都具有很高的可视性,并且应该为专家和非专家之间的讨论提供良好的基础,尽管它在某种程度上牺牲了一些时间序列建模方面的考虑,这超出了“构建模块”方法的范围,例如自相关或随机性。趋势。
翻译自: https://medium.com/swlh/facebook-prophet-426421f7e331
先知模型 facebook
http://www.taodudu.cc/news/show-997392.html
相关文章:
- 项目案例:qq数据库管理_2小时元项目:项目管理您的数据科学学习
- 查询数据库中有多少个数据表_您的数据中有多少汁?
- 数据科学与大数据技术的案例_作为数据科学家解决问题的案例研究
- 商业数据科学
- 数据科学家数据分析师_站出来! 分析人员,数据科学家和其他所有人的领导和沟通技巧...
- 分析工作试用期收获_免费使用零编码技能探索数据分析
- 残疾科学家_数据科学与残疾:通过创新加强护理
- spss23出现数据消失_改善23亿人口健康数据的可视化
- COVID-19研究助理
- 缺失值和异常值的识别与处理_识别异常值-第一部分
- 梯度 cv2.sobel_TensorFlow 2.0中连续策略梯度的最小工作示例
- yolo人脸检测数据集_自定义数据集上的Yolo-V5对象检测
- 图深度学习-第2部分
- 量子信息与量子计算_量子计算为23美分。
- 失物招领php_新奥尔良圣徒队是否增加了失物招领?
- 客户细分模型_Avarto金融解决方案的客户细分和监督学习模型
- 梯度反传_反事实政策梯度解释
- facebook.com_如何降低电子商务的Facebook CPM
- 西格尔零点猜想_我从埃里克·西格尔学到的东西
- 深度学习算法和机器学习算法_啊哈! 4种流行的机器学习算法的片刻
- 统计信息在数据库中的作用_统计在行业中的作用
- 怎么评价两组数据是否接近_接近组数据(组间)
- power bi 中计算_Power BI中的期间比较
- matplotlib布局_Matplotlib多列,行跨度布局
- 回归分析_回归
- 线性回归算法数学原理_线性回归算法-非数学家的高级数学
- Streamlit —使用数据应用程序更好地测试模型
- lasso回归和岭回归_如何计划新产品和服务机会的回归
- 贝叶斯 定理_贝叶斯定理实际上是一个直观的分数
- 文本数据可视化_如何使用TextHero快速预处理和可视化文本数据
先知模型 facebook_Facebook先知相关推荐
- 先知模型 facebook_使用Facebook先知进行犯罪率预测
先知模型 facebook Time series prediction is one of the must-know techniques for any data scientist. Ques ...
- 时间序列模型预测_时间序列预测,使用facebook先知模型预测股价
时间序列模型预测 1.简介 (1. Introduction) 1.1. 时间序列和预测模型 (1.1. Time-series & forecasting models) Tradition ...
- 先知ppt_用先知预测时间序列数据–第3部分
先知ppt This is the third in a series of posts about using Prophet to forecast time series data. The o ...
- 机器学习模型 非线性模型_机器学习:通过预测菲亚特500的价格来观察线性模型的工作原理...
机器学习模型 非线性模型 Introduction 介绍 In this article, I'd like to speak about linear models by introducing y ...
- 数据可视化分析票房数据报告_票房收入分析和可视化
数据可视化分析票房数据报告 Welcome back to my 100 Days of Data Science Challenge Journey. On day 4 and 5, I work ...
- 呼吁开放外网_服装数据集:呼吁采取行动
呼吁开放外网 Getting a dataset with images is not easy if you want to use it for a course or a book. Yes, ...
- 机器学习 来源框架_机器学习的秘密来源:策展
机器学习 来源框架 成功的机器学习/人工智能方法 (Methods for successful Machine learning / Artificial Intelligence) It's wi ...
- 多维空间可视化_使用GeoPandas进行空间可视化
多维空间可视化 Recently, I was working on a project where I was trying to build a model that could predict ...
- 客户行为模型 r语言建模_客户行为建模:汇总统计的问题
客户行为模型 r语言建模 As a Data Scientist, I spend quite a bit of time thinking about Customer Lifetime Value ...
最新文章
- Linux 高性能服务器编程——socket选项
- 教你如何用Python追踪快递信息!
- java ubuntu 14.04,ubuntu14.04下安装JAVA
- MySQL之练习题5
- 高可用服务 AHAS 在消息队列 MQ 削峰填谷场景下的应用...
- mysql hql查询语句_常用HQL语句
- Matlab Tricks(十一)—— 向量的逆序输出
- 操作系统——实时操作系统和分时操作系统
- PPT文件限制编辑如何取消
- 新媒体运营:如何策划出一场完整高效的活动方案?(一) | 黎想
- 九大PHP开源Wiki(维基百科)程序评测
- 程序员学英语 英语语法框架 10种词性 9种成分 8种句型
- java实现qq聊天室功能
- 本科去向选择之一——保研
- Pygame合集】回忆杀-“童年游戏”,看看你中几枪?(附五款源码自取)
- Python处理Excel表格匹配问题
- 盲人程序员是怎样炼成的
- Unsupervised Learning of Visual Features by Contrasting Cluster Assignments
- webstorm 常用快捷键大全归纳总结
- 通用人工智能(AGI):人工智能的下一个阶段
热门文章
- me shy是什么歌 抖音make_内含活动福利 | 小红书、抖音爆赞的高颜值的北欧家居神店开到卜蜂中心啦!...
- Java中key可以重复的Map集合:IdentityHashMap
- windows下GitHub的SSH Key 配置
- 个人技术博客Alpha----Android Studio UI学习
- java枚举的简单介绍
- 76. Minimum Window Substring
- HTTP基本认证(Basic Authentication)的JAVA示例
- PHP代码20个实用技巧(转)
- Win7/8出现An error occurred on the server when processing the URL解决办法
- iPhone使用CoreTelephony获得SIM卡网络运营商资讯和通话资料