数据可视化分析票房数据报告_票房收入分析和可视化
数据可视化分析票房数据报告
Welcome back to my 100 Days of Data Science Challenge Journey. On day 4 and 5, I work on TMDB Box Office Prediction Dataset available on Kaggle.
欢迎回到我的100天数据科学挑战之旅。 在第4天和第5天,我将研究Kaggle上提供的TMDB票房预测数据集。
I’ll start by importing some useful libraries that we need in this task.
我将从导入此任务中需要的一些有用的库开始。
import pandas as pd# for visualizationsimport matplotlib.pyplot as pltimport seaborn as sns%matplotlib inlineplt.style.use('dark_background')数据加载与探索 (Data Loading and Exploration)
Once you downloaded data from the Kaggle, you will have 3 files. As this is a prediction competition, you have train, test, and sample_submission file. For this project, my motive is only to perform data analysis and visuals. I am going to ignore test.csv and sample_submission.csv files.
从Kaggle下载数据后,您将拥有3个文件。 由于这是一场预测比赛,因此您具有训练,测试和sample_submission文件。 对于这个项目,我的动机只是执行数据分析和视觉效果。 我将忽略test.csv和sample_submission.csv文件。
Let’s load train.csv in data frame using pandas.
让我们使用熊猫在数据框中加载train.csv。
%time train = pd.read_csv('./data/tmdb-box-office-prediction/train.csv')# outputCPU times: user 258 ms, sys: 132 ms, total: 389 msWall time: 403 ms关于数据集: (About the dataset:)
id: Integer unique id of each moviebelongs_to_collection: Contains the TMDB Id, Name, Movie Poster, and Backdrop URL of a movie in JSON format.budget: Budget of a movie in dollars. Some row contains 0 values, which mean unknown.genres: Contains all the Genres Name & TMDB Id in JSON Format.homepage: Contains the official URL of a movie.imdb_id: IMDB id of a movie (string).original_language: Two-digit code of the original language, in which the movie was made.original_title: The original title of a movie in original_language.overview: Brief description of the movie.popularity: Popularity of the movie.poster_path: Poster path of a movie. You can see full poster image by adding URL after this link → https://image.tmdb.org/t/p/original/production_companies: All production company name and TMDB id in JSON format of a movie.production_countries: Two-digit code and the full name of the production company in JSON format.release_date: The release date of a movie in mm/dd/yy format.runtime: Total runtime of a movie in minutes (Integer).spoken_languages: Two-digit code and the full name of the spoken language.status: Is the movie released or rumored?tagline: Tagline of a movietitle: English title of a movieKeywords: TMDB Id and name of all the keywords in JSON format.cast: All cast TMDB id, name, character name, gender (1 = Female, 2 = Male) in JSON formatcrew: Name, TMDB id, profile path of various kind of crew members job like Director, Writer, Art, Sound, etc.revenue: Total revenue earned by a movie in dollars.Let’s have a look at the sample data.
让我们看一下样本数据。
train.head()As we can see that some features have dictionaries, hence I am dropping all such columns for now.
如我们所见,某些功能具有字典,因此我暂时删除所有此类列。
train = train.drop(['belongs_to_collection', 'genres', 'crew','cast', 'Keywords', 'spoken_languages', 'production_companies', 'production_countries', 'tagline','overview','homepage'], axis=1)Now it time to have a look at statistics of the data.
现在该看一下数据统计了。
print("Shape of data is ")train.shape# OutputShape of data is(3000, 12)Dataframe information.
数据框信息。
train.info()# Output<class 'pandas.core.frame.DataFrame'>RangeIndex: 3000 entries, 0 to 2999Data columns (total 12 columns): # Column Non-Null Count Dtype --- ------ -------------- ----- 0 id 3000 non-null int64 1 budget 3000 non-null int64 2 imdb_id 3000 non-null object 3 original_language 3000 non-null object 4 original_title 3000 non-null object 5 popularity 3000 non-null float64 6 poster_path 2999 non-null object 7 release_date 3000 non-null object 8 runtime 2998 non-null float64 9 status 3000 non-null object 10 title 3000 non-null object 11 revenue 3000 non-null int64 dtypes: float64(2), int64(3), object(7)memory usage: 281.4+ KBDescribe dataframe.
描述数据框。
train.describe()Let’s create new columns for release weekday, date, month, and year.
让我们为发布工作日,日期,月份和年份创建新列。
train['release_date'] = pd.to_datetime(train['release_date'], infer_datetime_format=True)train['release_day'] = train['release_date'].apply(lambda t: t.day)train['release_weekday'] = train['release_date'].apply(lambda t: t.weekday())train['release_month'] = train['release_date'].apply(lambda t: t.month)train['release_year'] = train['release_date'].apply(lambda t: t.year if t.year < 2018 else t.year -100)数据分析与可视化 (Data Analysis and Visualization)
问题1:哪部电影的收入最高? (Question 1: Which movie made the highest revenue?)
train[train['revenue'] == train['revenue'].max()]train[['id','title','budget','revenue']].sort_values(['revenue'], ascending=False).head(10).style.background_gradient(subset='revenue', cmap='BuGn')# Please note that output has a gradient style, but in a medium, it is not possible to show.The Avengers movie has made the highest revenue.
复仇者联盟电影的收入最高。
问题2:哪部电影的预算最高? (Question 2 : Which movie has the highest budget?)
train[train['budget'] == train['budget'].max()]train[['id','title','budget', 'revenue']].sort_values(['budget'], ascending=False).head(10).style.background_gradient(subset=['budget', 'revenue'], cmap='PuBu')Pirates of the Caribbean: On Stranger Tides is most expensive movie.
加勒比海盗:惊涛怪浪是最昂贵的电影。
问题3:哪部电影是最长的电影? (Question 3: Which movie is longest movie?)
train[train['runtime'] == train['runtime'].max()]plt.hist(train['runtime'].fillna(0) / 60, bins=40);plt.title('Distribution of length of film in hours', fontsize=16, color='white');plt.xlabel('Duration of Movie in Hours')plt.ylabel('Number of Movies')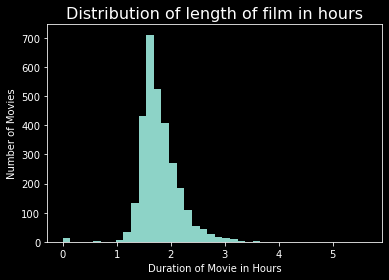
train[['id','title','runtime', 'budget', 'revenue']].sort_values(['runtime'],ascending=False).head(10).style.background_gradient(subset=['runtime','budget','revenue'], cmap='YlGn')Carlos is the longest movie, with 338 minutes (5 hours and 38 minutes) of runtime.
卡洛斯(Carlos)是最长的电影,有338分钟(5小时38分钟)的运行时间。
问题4:大多数电影在哪一年发行的? (Question 4: In which year most movies were released?)
plt.figure(figsize=(20,12))edgecolor=(0,0,0),sns.countplot(train['release_year'].sort_values(), palette = "Dark2", edgecolor=(0,0,0))plt.title("Movie Release count by Year",fontsize=20)plt.xlabel('Release Year')plt.ylabel('Number of Movies Release')plt.xticks(fontsize=12,rotation=90)plt.show()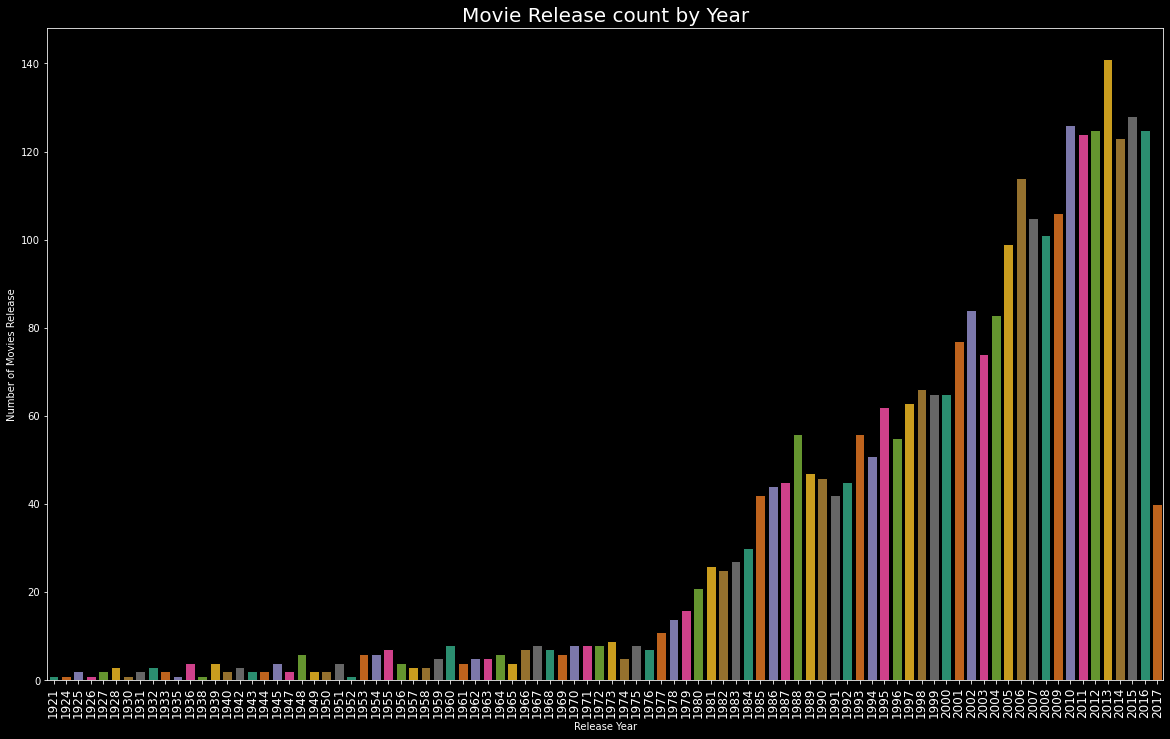
train['release_year'].value_counts().head()# Output2013 1412015 1282010 1262016 1252012 125Name: release_year, dtype: int64In 2013 total 141 movies were released.
2013年,总共发行了141部电影。
问题5:最受欢迎和最低人气的电影。 (Question 5 : Movies with Highest and Lowest popularity.)
Most popular Movie:
最受欢迎的电影:
train[train['popularity']==train['popularity'].max()][['original_title','popularity','release_date','revenue']]Least Popular Movie:
最不受欢迎的电影:
train[train['popularity']==train['popularity'].min()][['original_title','popularity','release_date','revenue']]Lets create popularity distribution plot.
让我们创建人气分布图。
plt.figure(figsize=(20,12))edgecolor=(0,0,0),sns.distplot(train['popularity'], kde=False)plt.title("Movie Popularity Count",fontsize=20)plt.xlabel('Popularity')plt.ylabel('Count')plt.xticks(fontsize=12,rotation=90)plt.show()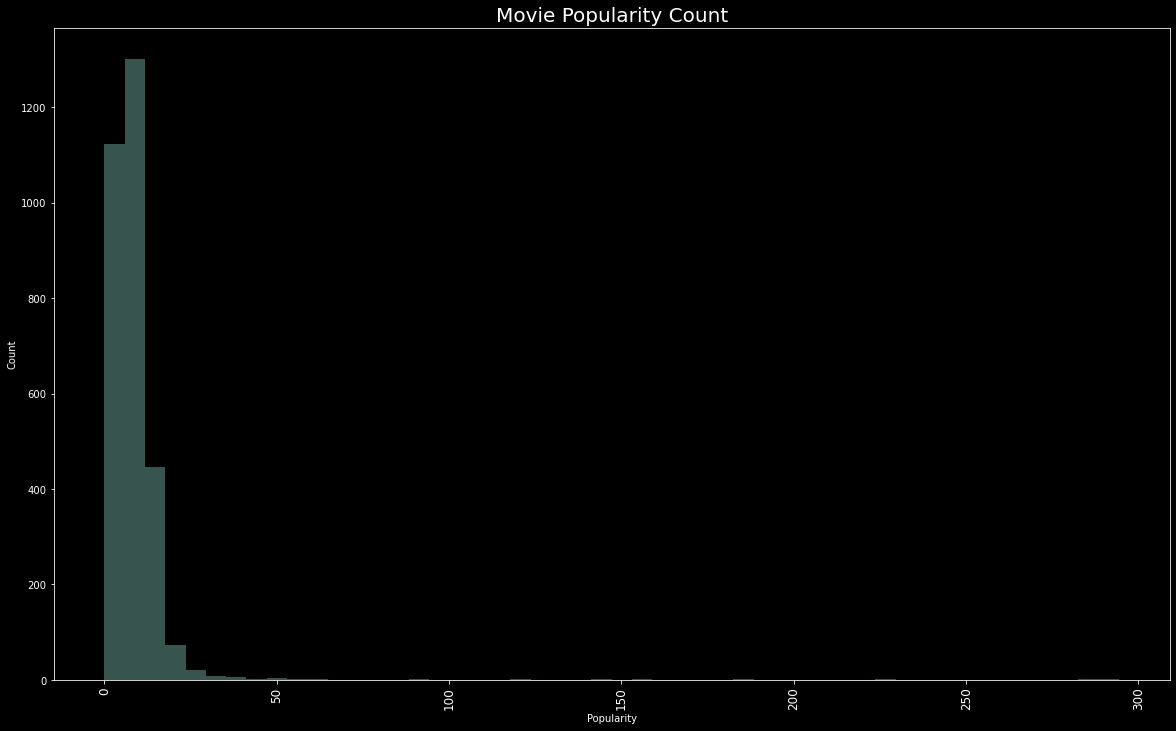
Wonder Woman movie have highest popularity of 294.33 whereas Big Time movie have lowest popularity which is 0.
《神奇女侠》电影的最高人气为294.33,而《大时代》电影的最低人气为0。
问题6:从1921年到2017年,大多数电影在哪个月发行? (Question 6 : In which month most movies are released from 1921 to 2017?)
plt.figure(figsize=(20,12))edgecolor=(0,0,0),sns.countplot(train['release_month'].sort_values(), palette = "Dark2", edgecolor=(0,0,0))plt.title("Movie Release count by Month",fontsize=20)plt.xlabel('Release Month')plt.ylabel('Number of Movies Release')plt.xticks(fontsize=12)plt.show()
train['release_month'].value_counts()# Output9 36210 30712 2638 2564 2453 2386 2372 2265 22411 2211 2127 209Name: release_month, dtype: int64In september month most movies are relesed which is around 362.
在9月中,大多数电影都已发行,大约362。
问题7:大多数电影在哪个月上映? (Question 7 : On which date of month most movies are released?)
plt.figure(figsize=(20,12))edgecolor=(0,0,0),sns.countplot(train['release_day'].sort_values(), palette = "Dark2", edgecolor=(0,0,0))plt.title("Movie Release count by Day of Month",fontsize=20)plt.xlabel('Release Day')plt.ylabel('Number of Movies Release')plt.xticks(fontsize=12)plt.show()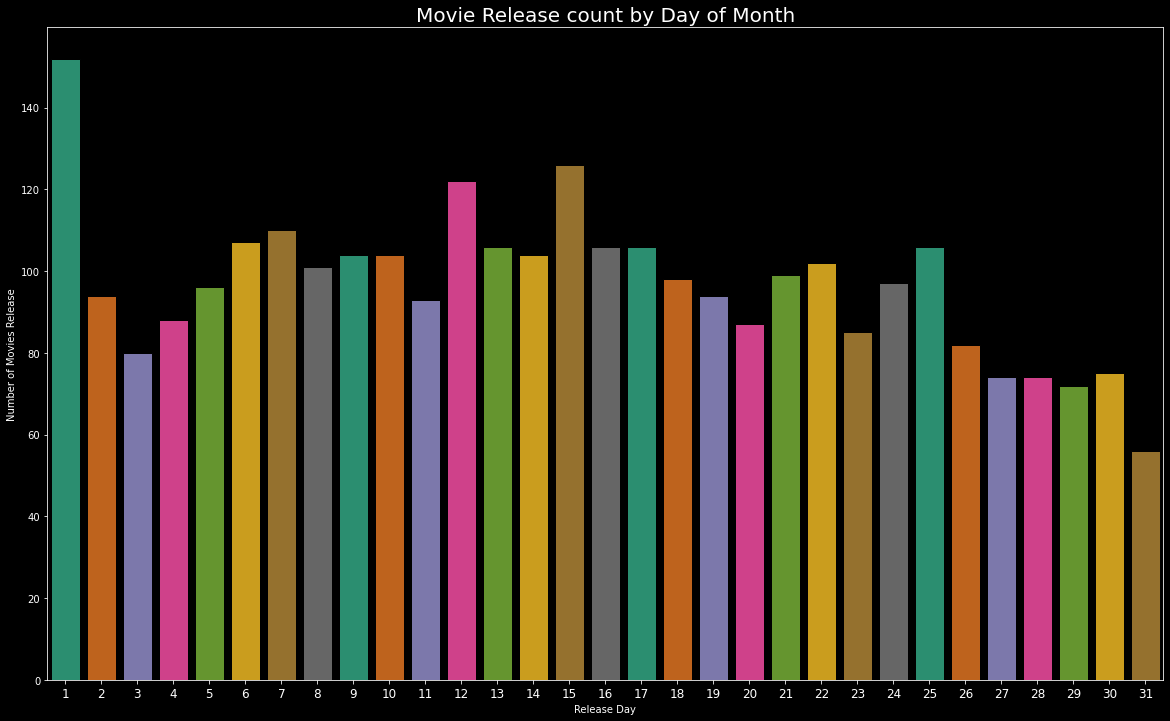
train['release_day'].value_counts().head()#Output1 15215 12612 1227 1106 107Name: release_day, dtype: int64首次发布影片的最高数量为152。 (On first date highest number of movies are released, 152.)
问题8:大多数电影在一周的哪一天发行? (Question 8 : On which day of week most movies are released?)
plt.figure(figsize=(20,12))sns.countplot(train['release_weekday'].sort_values(), palette='Dark2')loc = np.array(range(len(train['release_weekday'].unique())))day_labels = ['Mon', 'Tue', 'Wed', 'Thu', 'Fri', 'Sat', 'Sun']plt.xlabel('Release Day of Week')plt.ylabel('Number of Movies Release')plt.xticks(loc, day_labels, fontsize=12)plt.show()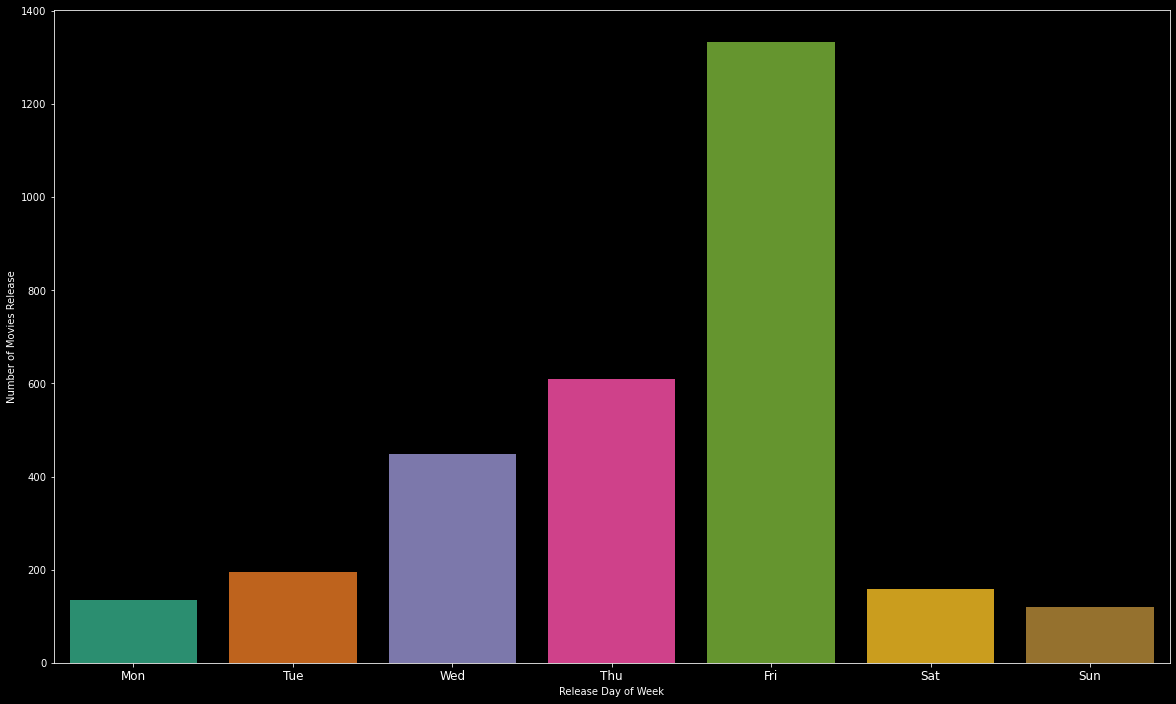
train['release_weekday'].value_counts()# Output4 13343 6092 4491 1965 1580 1356 119Name: release_weekday, dtype: int64星期五上映的电影数量最多。 (Highest number of movies released on friday.)
最后的话 (Final Words)
I hope this article was helpful to you. I tried to answer a few questions using data science. There are many more questions to ask. Now, I will move towards another dataset tomorrow. All the codes of data analysis and visuals can be found at this GitHub repository or Kaggle kernel.
希望本文对您有所帮助。 我尝试使用数据科学回答一些问题。 还有更多问题要问。 现在,我明天将移至另一个数据集。 可以在此GitHub存储库或Kaggle内核中找到所有数据分析和可视化代码。
Thanks for reading.
谢谢阅读。
I appreciate any feedback.
我感谢任何反馈。
数据科学进展100天 (100 Days of Data Science Progress)
If you like my work and want to support me, I’d greatly appreciate it if you follow me on my social media channels:
如果您喜欢我的工作并希望支持我,那么如果您在我的社交媒体频道上关注我,我将不胜感激:
The best way to support me is by following me on Medium.
支持我的最佳方法是在Medium上关注我。
Subscribe to my new YouTube channel.
订阅我的新YouTube频道 。
Sign up on my email list.
在我的电子邮件列表中注册。
翻译自: https://towardsdatascience.com/box-office-revenue-analysis-and-visualization-ce5b81a636d7
数据可视化分析票房数据报告
http://www.taodudu.cc/news/show-997393.html
相关文章:
- 先知模型 facebook_Facebook先知
- 项目案例:qq数据库管理_2小时元项目:项目管理您的数据科学学习
- 查询数据库中有多少个数据表_您的数据中有多少汁?
- 数据科学与大数据技术的案例_作为数据科学家解决问题的案例研究
- 商业数据科学
- 数据科学家数据分析师_站出来! 分析人员,数据科学家和其他所有人的领导和沟通技巧...
- 分析工作试用期收获_免费使用零编码技能探索数据分析
- 残疾科学家_数据科学与残疾:通过创新加强护理
- spss23出现数据消失_改善23亿人口健康数据的可视化
- COVID-19研究助理
- 缺失值和异常值的识别与处理_识别异常值-第一部分
- 梯度 cv2.sobel_TensorFlow 2.0中连续策略梯度的最小工作示例
- yolo人脸检测数据集_自定义数据集上的Yolo-V5对象检测
- 图深度学习-第2部分
- 量子信息与量子计算_量子计算为23美分。
- 失物招领php_新奥尔良圣徒队是否增加了失物招领?
- 客户细分模型_Avarto金融解决方案的客户细分和监督学习模型
- 梯度反传_反事实政策梯度解释
- facebook.com_如何降低电子商务的Facebook CPM
- 西格尔零点猜想_我从埃里克·西格尔学到的东西
- 深度学习算法和机器学习算法_啊哈! 4种流行的机器学习算法的片刻
- 统计信息在数据库中的作用_统计在行业中的作用
- 怎么评价两组数据是否接近_接近组数据(组间)
- power bi 中计算_Power BI中的期间比较
- matplotlib布局_Matplotlib多列,行跨度布局
- 回归分析_回归
- 线性回归算法数学原理_线性回归算法-非数学家的高级数学
- Streamlit —使用数据应用程序更好地测试模型
- lasso回归和岭回归_如何计划新产品和服务机会的回归
- 贝叶斯 定理_贝叶斯定理实际上是一个直观的分数
数据可视化分析票房数据报告_票房收入分析和可视化相关推荐
- 熊猫烧香分析报告_熊猫分析进行最佳探索性数据分析
熊猫烧香分析报告 目录 (Table of Contents) Introduction介绍 Overview总览 Variables变数 Interactions互动互动 Correlations相 ...
- 数字电路数据选择器及其应用实验报告_科普|说说大数据是什么,及其特点与应用...
小编在KFC买早餐,偶然听见一句话,男孩对朋友说,"你每在手机上下一次订单,就给肯德基的大数据做了一次贡献." 想来有趣,在网上购物.订外卖.手机支付已成为很多人日常生活的一部分, ...
- 数据中心生成器行业调研报告 - 市场现状分析与发展前景预测
数据中心生成器市场的企业竞争态势 该报告涉及的主要国际市场参与者有Caterpillar.Cummins.Euro-Diesel.Generac Power System.Hitec Power Pr ...
- 分析堆栈溢出原因_我分析了有关堆栈溢出的所有书籍。 这是最受欢迎的。
分析堆栈溢出原因 by Vlad Wetzel 通过弗拉德·韦泽尔 我分析了有关堆栈溢出的所有书籍. 这是最受欢迎的. (I analyzed every book ever mentioned on ...
- BPO业务分析行业调研报告 - 市场现状分析与发展前景预测(2021-2027年)
BPO业务分析市场的企业竞争态势 该报告涉及的主要国际市场参与者有Accenture.Cognizant.Genpact.IBM.TCS.Tech Mahindra.Capgemini.Wipro.E ...
- 人群分析行业调研报告 - 市场现状分析与发展前景预测(2021-2027年)
人群分析市场的企业竞争态势 该报告涉及的主要国际市场参与者有Nokia Corporation.AGT International.NEC Corporation.Walkbase.Spigit, I ...
- 生信分析矫正P值_生物信息分析:从入门到精(fang)通(qi) 第1期FASTQ! BAM! VCF! 傻傻分不清楚...
生信小白:肉哥,上次听完你的介绍,我满脑子跟这张图片一样...凌乱?!我们为什么不一次性把整本书读取了,非要把这本书撕碎呢? 西克孚肉:这主要受限于技术,测序仪一次只能读取几百.几千.几万个碱基,这与 ...
- 【考研英语-基础-长难句分析】基本结构_断开分析主谓【主谓主谓 主主谓谓】
文章目录: 一:断开分析主谓的两种句型 二:练习 三:考场攻略:分析句子,只看谓语动词
- python电影数据分析报告_【python数据分析实战】电影票房数据分析(二)数据可视化...
在上一部分<[python数据分析实战]电影票房数据分析(一)数据采集> 已经获取到了2011年至今的票房数据,并保存在了mysql中. 本文将在实操中讲解如何将mysql中的数据抽取出来 ...
最新文章
- vue-quill-editor上传内容由于图片是base64的导致字符太长的问题解决
- python爬虫(二)_HTTP的请求和响应
- Django框架深入了解_05 (Django中的缓存、Django解决跨域流程(非简单请求,简单请求)、自动生成接口文档)(二)
- python调用sparksql,使用Python从MySQL数据库表读取SparkSQL
- 河北体检系统诚信企业推荐_应用多的隔膜计量泵价格诚信企业推荐
- while((getchar ()) != '\n')理解
- 【AI视野·今日NLP 自然语言处理论文速览 第四期】Wed, 9 Jun 2021
- int和Integer的区别,哪个在定义变量好
- VB.NET 中图形旋转任意角度 [ZT]
- 使用tcpdump抓Android网络包
- idea格式化代码时,注释被格式化问题
- android手机分区调整大小写,如何使用PQMagic调整磁盘分区容量大小
- Windows蓝屏漏洞(利用多种途径与分析)
- 2021全国特种设备-R1快开门式压力容器充装模拟考试题库一[安考星]
- Arduino - 看门狗定时器的使用介绍
- nacos安装配置和单机部署教程
- 毕业设计| 单片机自动分拣小车(上货/卸货/WIFI识别)
- 摄像头数字信号方式传输的 GMSL、FPD-Link、V-by-One 方式
- numpy.random.randn()与rand()的区别
- Charles抓包工具安装教程