c++ 时间序列工具包_我的时间序列工具包
c++ 时间序列工具包
When it comes to time series forecasting, I’m a great believer that the simpler the model, the better.
关于时间序列预测,我坚信模型越简单越好。
However, not all time series are created equal. Some time series have a strongly defined trend — we often see this with economic data, for instance:
但是,并非所有时间序列都是相同的。 某些时间序列具有明确定义的趋势-例如,我们经常在经济数据中看到这一趋势:
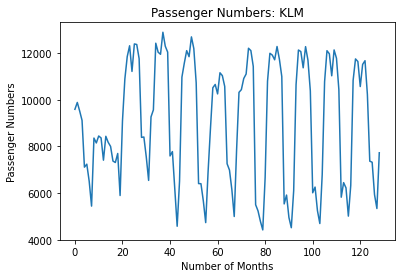
Others show a more stationary-like pattern — e.g. monthly air passenger numbers:
其他人则表现出更平稳的模式,例如每月的航空旅客人数:
The choice of time series model will depend highly on the type of time series one is working with. Here are some of the most useful time series models I’ve encountered.
时间序列模型的选择将在很大程度上取决于正在使用的时间序列的类型。 这是我遇到的一些最有用的时间序列模型。
1. ARIMA (1. ARIMA)
In my experience, ARIMA tends to be most useful when modelling time series with a strong trend. The model is also adept at modelling seasonality patterns.
以我的经验,当对具有强烈趋势的时间序列进行建模时,ARIMA往往最有用。 该模型还擅长对季节性模式进行建模。
Let’s take an example.
让我们举个例子。
Suppose we wish to model monthly air passenger numbers over a period of years. The original data is sourced from San Francisco Open Data.
假设我们希望对几年内的每月航空旅客数量进行建模。 原始数据来自San Francisco Open Data 。
Such a time series will have a seasonal component (holiday seasons tend to have higher passenger numbers, for instance) as well as evidence of a trend as indicated when the series is decomposed as below.
这样的时间序列将具有季节性成分(例如,假日季节往往会有更高的乘客人数),以及当序列分解如下时所指示的趋势的证据。

The purpose of using an ARIMA model is to capture the trend as well as account for the seasonality inherent in the time series.
使用ARIMA模型的目的是捕获趋势并考虑时间序列固有的季节性。
To do this, one can use the auto.arima function in R, which can select the best fit p, d, q coordinates for the model as well as the appropriate seasonal component.
为此,可以使用R中的auto.arima函数,该函数可以为模型选择最佳拟合的p,d,q坐标以及适当的季节分量。
For the above example, the model that performed best in terms of the lowest BIC was as follows:
对于上面的示例,就最低BIC而言表现最佳的模型如下:
Series: passengernumbers ARIMA(1,0,0)(0,1,1)[12]Coefficients: ar1 sma1 0.7794 -0.5001s.e. 0.0609 0.0840sigma^2 estimated as 585834: log likelihood=-831.27AIC=1668.54 AICc=1668.78 BIC=1676.44Here is a visual of the forecasts.
这是预测的视觉效果。
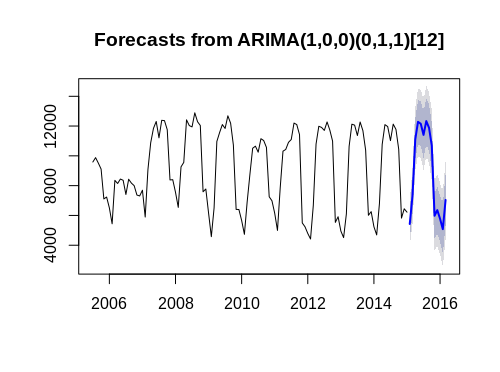
We can see that ARIMA is adequately forecasting the seasonal pattern in the series. In terms of the model performance, the RMSE (root mean squared error) and MFE (mean forecast error) were as follows:
我们可以看到ARIMA可以充分预测该系列的季节性模式。 在模型性能方面,RMSE(均方根误差)和MFE(平均预测误差)如下:
RMSE: 698
RMSE: 698
MFE: -115
MFE: -115
Given a mean of 8,799 passengers per month across the validation set, the errors recorded were quite small in comparison to the average — indicating that the model is performing well in forecasting air passenger numbers.
假设整个验证集中平均每月有8799名乘客,则记录的误差与平均值相比很小,这表明该模型在预测航空乘客人数方面表现良好。
2.先知 (2. Prophet)
Let’s take a look at the air passenger example once again, but this time using Facebook’s Prophet. Prophet is a time series tool that allows for forecasting bsaed on an additive model, and works especially well with data that has strong seasonal trends.
让我们再来看一次航空乘客示例,但这一次使用Facebook的Prophet 。 Prophet是一个时间序列工具,可用于根据加性模型进行预测,尤其适用于季节性趋势强烈的数据。
The air passenger dataset appears to fit the bill, so let’s see how the model would perform compared to ARIMA.
航空乘客数据集似乎符合要求,因此让我们看看与ARIMA相比该模型的性能如何。
In this example, Prophet can be used to identify the long-term trend for air passenger numbers, as well as seasonal fluctuations throughout the year:
在此示例中,可以使用先知来确定航空客运量的长期趋势以及全年的季节性波动:
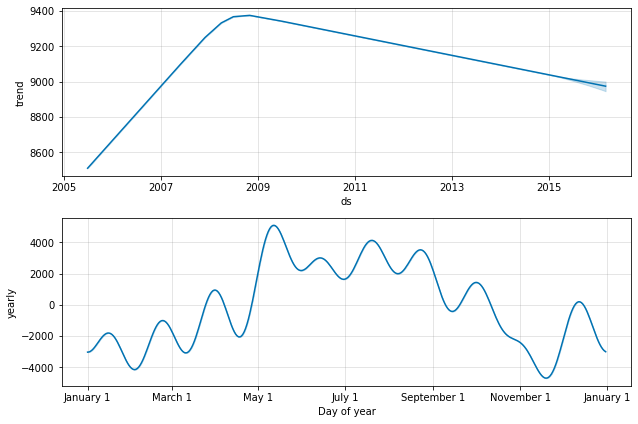
prophet_basic = Prophet()prophet_basic.fit(train_dataset)A standard Prophet model can be fit to pick up the trend and seasonal components automatically, although these can also be configured manually by the user.
尽管可以由用户手动配置,但标准的Prophet模型可以适合自动获取趋势和季节成分。
One particularly useful component of Prophet is the inclusion of changepoints, or significant structural breaks in a time series.
先知的一个特别有用的组成部分是包含变更点 ,即时间序列中的重大结构中断。
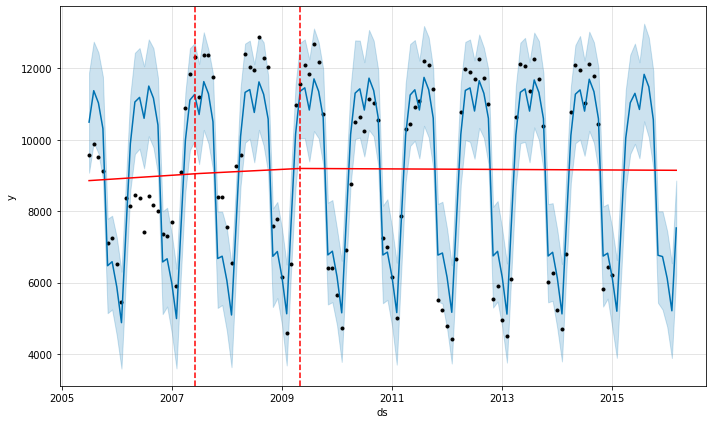
Through trial and error, 4 changepoints were shown to minimise the MFE and RMSE:
通过反复试验,显示了4个更改点以最大程度地减少MFE和RMSE:
pro_change= Prophet(n_changepoints=4)forecast = pro_change.fit(train_dataset).predict(future)fig= pro_change.plot(forecast);a = add_changepoints_to_plot(fig.gca(), pro_change, forecast)The RMSE and MAE can now be calculated as follows:
现在可以按以下方式计算RMSE和MAE:
>>> from sklearn.metrics import mean_squared_error>>> from math import sqrt>>> mse = mean_squared_error(passenger_test, yhat14)>>> rmse = sqrt(mse)>>> print('RMSE: %f' % rmse)RMSE: 524.263928>>> forecast_error = (passenger_test-yhat14)>>> forecast_error>>> mean_forecast_error = np.mean(forecast_error)>>> mean_forecast_error71.58326743881493The RMSE and MFE for Prophet are both lower than that obtained using ARIMA, suggesting that the model has performed better in forecasting monthly air passenger numbers.
先知的RMSE和MFE均低于使用ARIMA获得的值,这表明该模型在预测每月航空乘客人数方面表现更好。
3. TensorFlow概率 (3. TensorFlow Probability)
In the aftermath of COVID-19, many time series forecasts have proven to be erroneous as they have been made with the wrong set of assumptions.
在COVID-19之后,许多时间序列的预测被证明是错误的,因为它们是用错误的假设集做出的。
Increasingly, it is coming to be recognised that time series models which can produce a range of forecasts can be more practically applied, as they allow for a “scenario analysis” of what might happen in the future.
人们越来越认识到,可以产生一系列预测的时间序列模型可以更实际地应用,因为它们可以对未来可能发生的情况进行“情景分析”。
As an example, an ARIMA model built using the air passenger data as above could not have possibly forecasted the sharp drop in passenger numbers that came about as a result of COVID-19.
例如,使用上述航空旅客数据构建的ARIMA模型可能无法预测由于COVID-19而导致的旅客人数急剧下降。
However, using more recent air passenger data, let’s see how a model built using TensorFlow Probability would have performed:
但是,使用最近的航空乘客数据,让我们看看使用TensorFlow Probability构建的模型将如何执行:
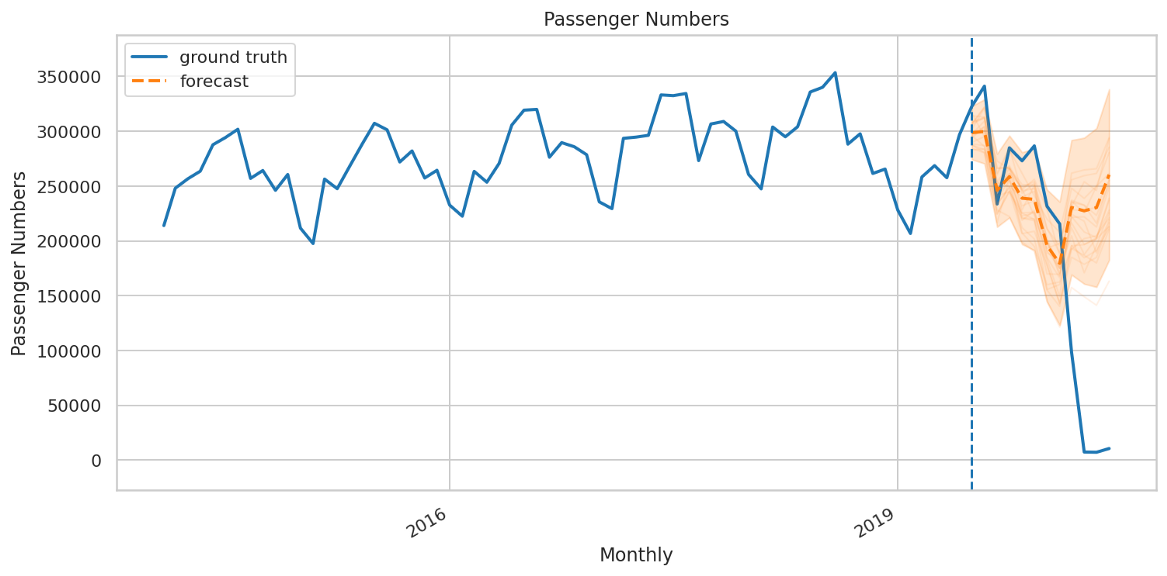
While the model would not have forecasted the sharp drop that ultimately came to pass, we do see that the model is forecasting a drop in passenger numbers to below 150,000. Use of this model can allow for more of a “what-if” series of forecasts — e.g. an airline could forecast monthly passenger numbers for a particular airport and note that passenger numbers could be significantly lower than usual — which could inform the company in terms of managing resources such as fleet utilisation, for instance.
尽管该模型无法预测最终会发生的急剧下降,但我们确实看到该模型预测的乘客人数将下降到150,000以下。 使用此模型可以进行更多的“假设分析”系列预测-例如,航空公司可以预测特定机场的每月乘客人数,并请注意,乘客人数可能大大低于平时-这可以向公司传达例如,管理资源,例如车队利用。
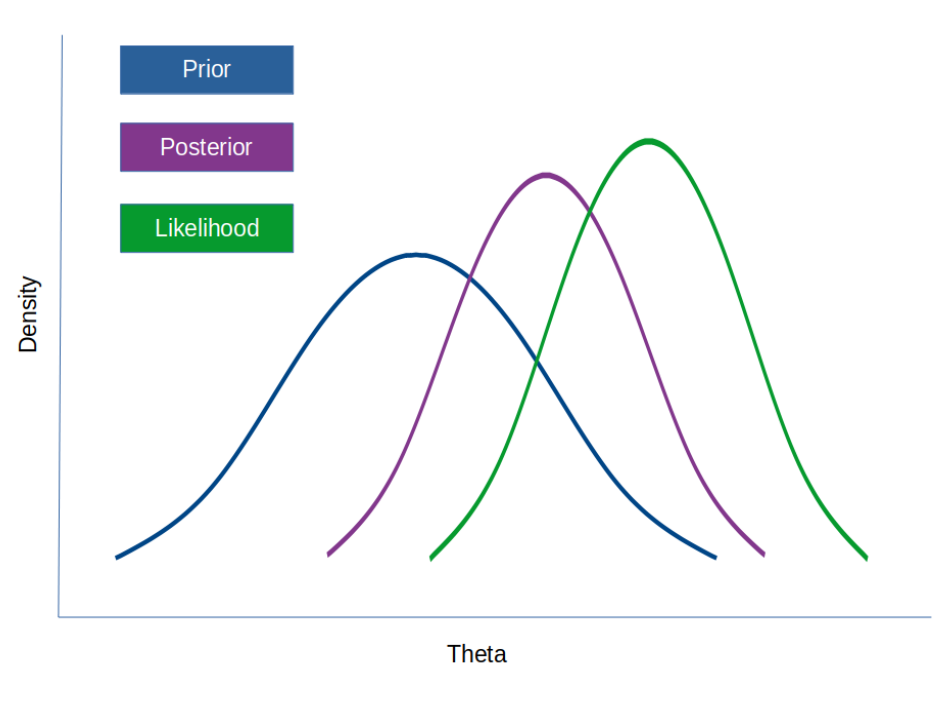
Specifically, TensorFlow Probability makes forecasts using the assumption of a posterior distribution — which is comprised of a prior distribution (prior data) and the likelihood function.
具体来说,TensorFlow概率使用后验分布的假设进行预测,该后验分布由先验分布(先验数据)和似然函数组成。
For reference, the example illustrated here uses the template from the Structural Time Series modeling in TensorFlow Probability tutorial, of which the original authors (Copyright 2019 The TensorFlow Authors) have made available under the Apache 2.0 license.
作为参考,此处显示的示例使用TensorFlow概率教程中的结构时间序列建模中的模板,该原始模板的作者(Copyright 2019 The TensorFlow Authors)已获得Apache 2.0许可。
结论 (Conclusion)
Time series analysis is about making reliable forecasts using models suited to the data in question. For data with defined trend and seasonal components, it has been my experience that these models work quite well.
时间序列分析是关于使用适用于相关数据的模型进行可靠的预测。 对于具有定义的趋势和季节性成分的数据,根据我的经验,这些模型非常有效。
Hope you found the above article of use, and feel free to leave any questions or feedback in the comments section.
希望您找到了上面的使用文章,并随时在评论部分中留下任何问题或反馈。
Disclaimer: This article is written on an “as is” basis and without warranty. It was written with the intention of providing an overview of data science concepts, and should not be interpreted as professional advice in any way.
免责声明:本文按“原样”撰写,不作任何担保。 它旨在提供数据科学概念的概述,并且不应以任何方式解释为专业建议。
翻译自: https://towardsdatascience.com/my-time-series-toolkit-4aa841d08325
c++ 时间序列工具包
http://www.taodudu.cc/news/show-997438.html
相关文章:
- adobe 书签怎么设置_让我们设置一些规则…没有Adobe Analytics处理规则
- 分类预测回归预测_我们应该如何汇总分类预测?
- 神经网络推理_分析神经网络推理性能的新工具
- 27个机器学习图表翻译_使用机器学习的信息图表信息组织
- 面向Tableau开发人员的Python简要介绍(第4部分)
- 探索感染了COVID-19的动物的数据
- 已知两点坐标拾取怎么操作_已知的操作员学习-第4部分
- lime 模型_使用LIME的糖尿病预测模型解释— OneZeroBlog
- 永无止境_永无止境地死:
- 吴恩达神经网络1-2-2_图神经网络进行药物发现-第1部分
- python 数据框缺失值_Python:处理数据框中的缺失值
- 外星人图像和外星人太空船_卫星图像:来自太空的见解
- 棒棒糖 宏_棒棒糖图表
- nlp自然语言处理_不要被NLP Research淹没
- 时间序列预测 预测时间段_应用时间序列预测:美国住宅
- 经验主义 保守主义_为什么我们需要行动主义-始终如此。
- python机器学习预测_使用Python和机器学习预测未来的股市趋势
- knn 机器学习_机器学习:通过预测意大利葡萄酒的品种来观察KNN的工作方式
- python 实现分步累加_Python网页爬取分步指南
- 用于MLOps的MLflow简介第1部分:Anaconda环境
- pymc3 贝叶斯线性回归_使用PyMC3估计的贝叶斯推理能力
- 朴素贝叶斯实现分类_关于朴素贝叶斯分类及其实现的简短教程
- vray阴天室内_阴天有话:第1部分
- 机器人的动力学和动力学联系_通过机器学习了解幸福动力学(第2部分)
- 大样品随机双盲测试_训练和测试样品生成
- 从数据角度探索在新加坡的非法毒品
- python 重启内核_Python从零开始的内核回归
- 回归分析中自变量共线性_具有大特征空间的回归分析中的变量选择
- python 面试问题_值得阅读的30个Python面试问题
- 机器学习模型 非线性模型_机器学习:通过预测菲亚特500的价格来观察线性模型的工作原理...
c++ 时间序列工具包_我的时间序列工具包相关推荐
- 季节性时间序列数据分析_如何指导时间序列数据的探索性数据分析
季节性时间序列数据分析 为什么要进行探索性数据分析? (Why Exploratory Data Analysis?) You might have heard that before proceed ...
- python时间序列峰值检测_算法 - 实时时间序列中的峰值信号检测d
算法 - 实时时间序列中的峰值信号检测d 更新:迄今为止表现最佳的算法就是这个算法. 该问题探讨了用于检测实时时间序列数据中的突然峰值的稳健算法. 请考虑以下数据集: p = [1 1 1.1 1 0 ...
- google提供的adb工具包_开源化学信息学工具包(Open Access Cheminformatics Toolkits)
1. CDK (Chemistry Development Kit) 官网:https://cdk.github.io/点击打开链接 CDK是结构化学信息学和生物信息学的开源Java库. 该项目由Ch ...
- python开发自己的工具包_爬虫开发python工具包介绍 (4)
本文来自网易云社区 作者:王涛 此处我们给出几个常用的代码例子,包括get,post(json,表单),带证书访问: Get 请求@gen.coroutine def fetch_url(): try ...
- python平稳性检验_时间序列预测基础教程系列(14)_如何判断时间序列数据是否是平稳的(Python)...
时间序列预测基础教程系列(14)_如何判断时间序列数据是否是平稳的(Python) 发布时间:2019-01-10 00:02, 浏览次数:620 , 标签: Python 导读: 本文介绍了数据平稳 ...
- python 时间序列预测_使用Python进行动手时间序列预测
python 时间序列预测 Time series analysis is the endeavor of extracting meaningful summary and statistical ...
- 图书销量时间序列预测_数学建模_Prophet实现
图书销量时间序列预测_数学建模_Prophet实现 前言 主要参考 代码 库导入与函数设置 导库 展示函数 取数据函数 训练函数 评估函数 数据预处理 数据集划分 数据分布查看 销售曲线查看 销售预测 ...
- 数学建模传染病模型_数学建模| 时间序列模型
1 数学建模 时间序列模型 1.与实践有关系的一组数据,叫做时间序列: 2.得到时间序列的数据后,要构建模型,其中平稳时间序列的模型,是本节课重点介绍的: 3.y=at+季节性+周期性 一. ...
- 时间序列预测基础教程系列(14)_如何判断时间序列数据是否是平稳的(Python)
导读: 本文介绍了数据平稳的重要性,平稳的数据对模型有什么影响. 描述了如何从直观的数据图中,和数据分布图(钟形曲线),以及数据统计值(Dickey-Fuller)上判断数据是否是平稳的. 正文: 时 ...
最新文章
- javascript实现yield
- C++ :常用文件、文件夹操作汇总
- 【HDU - 5050 】Divided Land (Java大数,大数进制转换,大数gcd)
- excel按条件查询mysql_Excel中实现多条件查找的15种方法
- 6-2-1:STL之string——string的快速入门、常用接口
- 推荐]招商就象谈恋爱
- 菜鸟篇之Java入门学习【ZT】
- 1组第一次作业-小组自我介绍
- Jupyter Lab——如何添加没有出现的kernel
- 计算机在热处理上有何应用,计算机在热处理中的应用
- Bi系统 :poli部署
- Ethernet和802.3的区别
- 计算机没桌面,电脑桌面的计算机图标没了怎么办
- CF128A - Statues
- BIOS学习之Beyong Bios
- 使用二维码——第三方库ZBar和libqrencode的使用
- linux脚本执行SQL文件创建表,shell脚本执行sql文件chrome安装
- 计算机冷门知识大全集,阴阳师冷门小知识汇总 冷门小知识合集一览
- e7用什么主板_八路E7的下场如何?盘点历代至尊版处理器现价
- linux检测内存条损坏,在Linux中检查可用内存的5种方法