Workout Wednesday Redux (2017 Week 3)
I had started a “52 Vis” initiative back in 2016 to encourage folks to get practice making visualizations since that’s the only way to get better at virtually anything. Life got crazy, 52 Vis fell to the wayside and now there are more visible alternatives such as Makeover Mondayand Workout Wednesday. They’re geared towards the “T” crowd (I’m not giving a closed source and locked-in-data product any more marketing than two links) but that doesn’t mean R, Python or other open-tool/open-data communities can’t join in for the ride and learning experience.
This week’s workout is a challenge to reproduce or improve upon a chart by Matt Stiles. You should go to both (give them the clicks and eyeballs they both deserve since they did great work). They both chose a line chart, but the whole point of these exercises is to try out new things to help you learn how to communicate better. I chose to use geom_segment() to make mini-column charts since that:
- eliminates the giant rose-coloured rectangles that end up everywhere
- helps show the differences a bit better (IMO), and
- also helps highlight some of the states that have had more difficulties than others
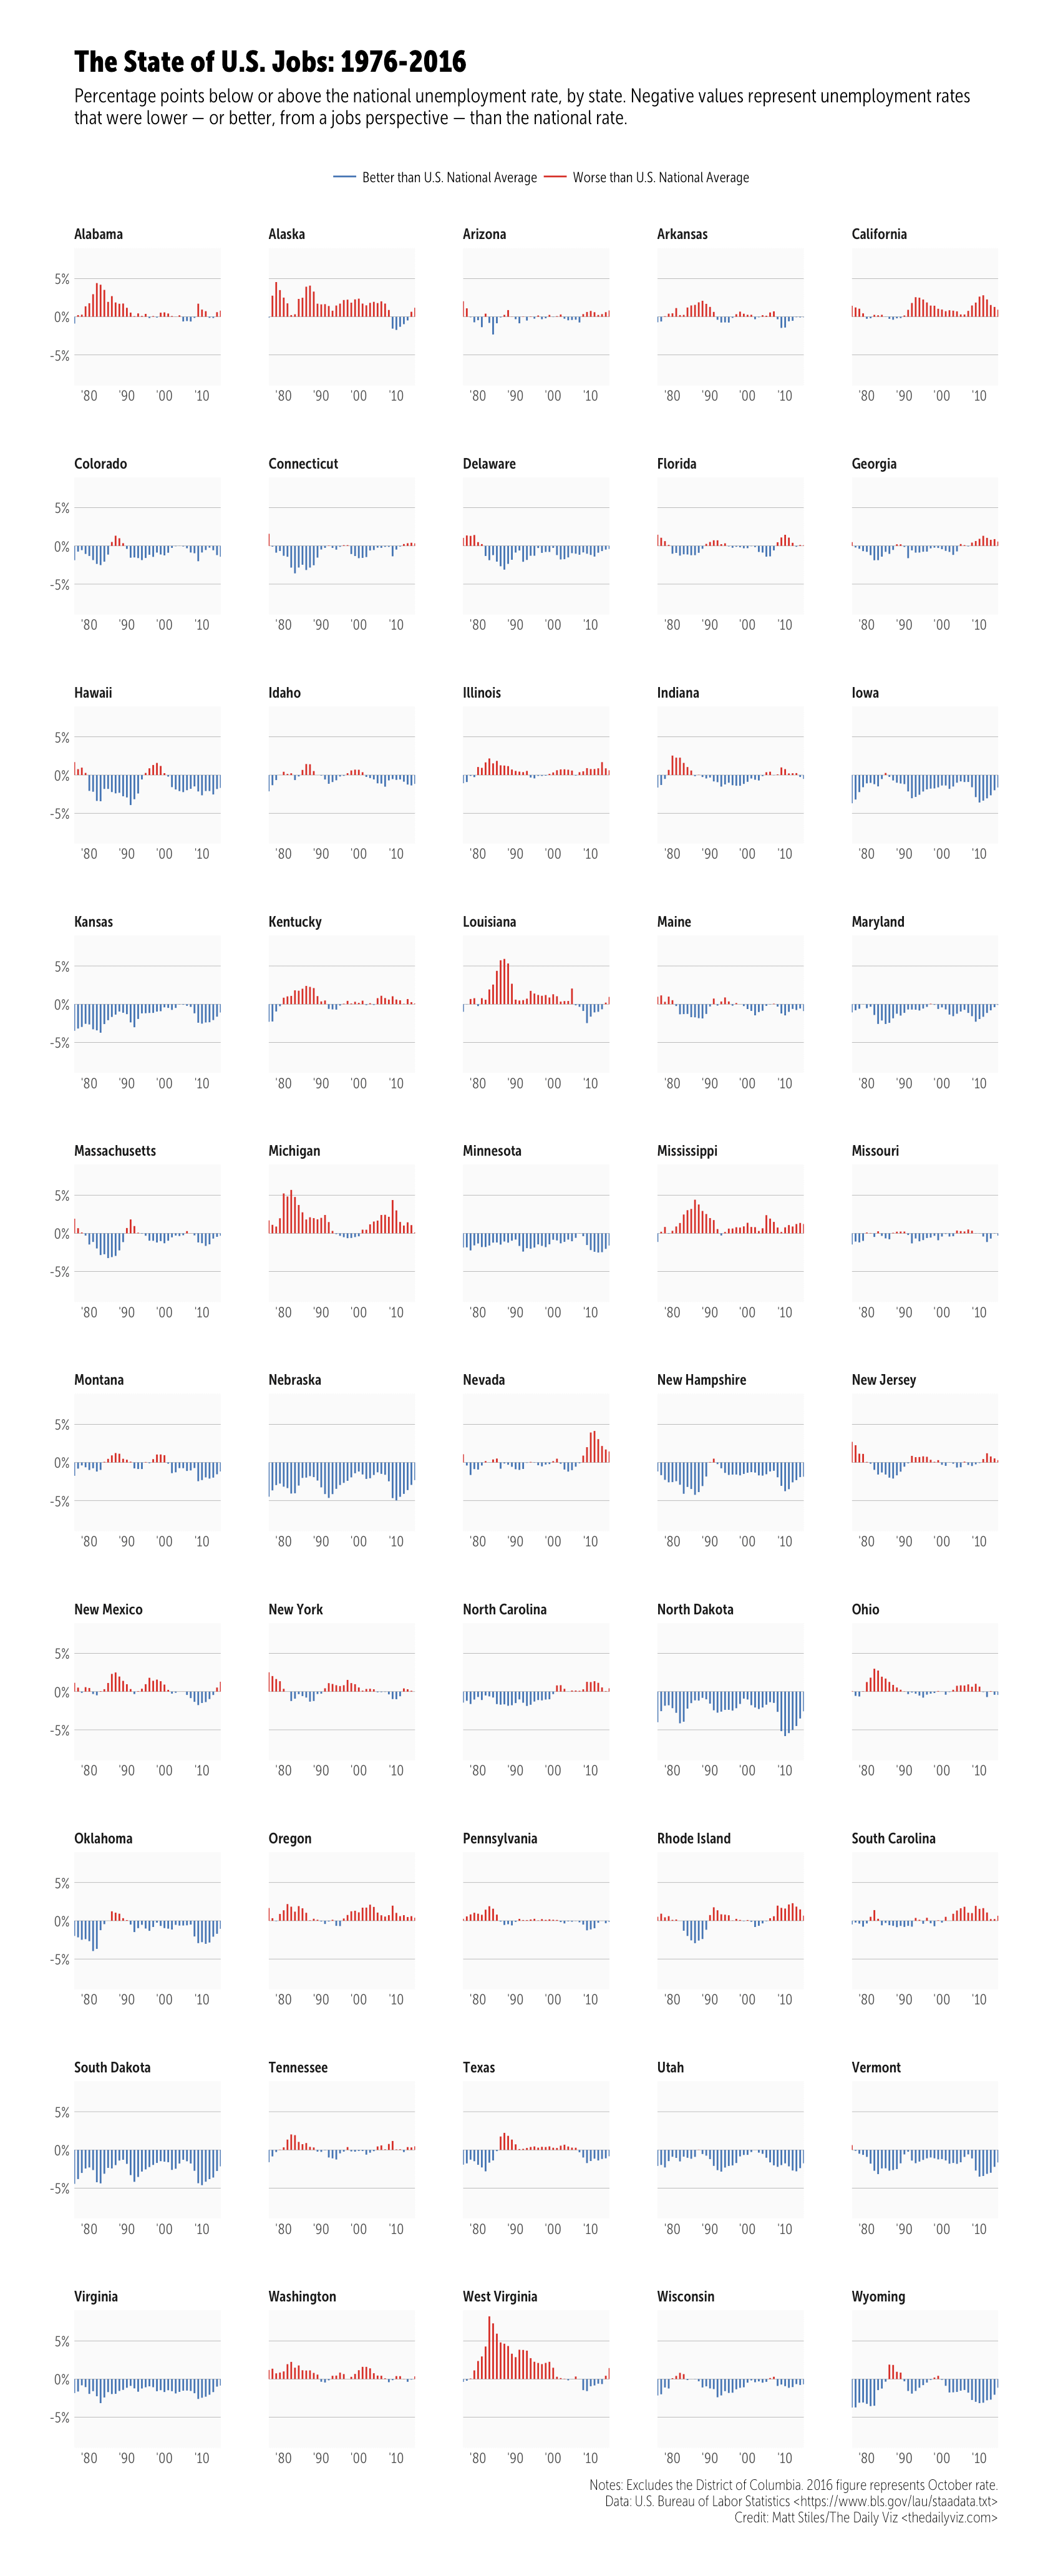
Click/tap to “embiggen”. I kept the same dimensions that Andy did but unlike Matt’s creation this is a plain ol’ PNG as I didn’t want to deal with web fonts (I’m on a Museo Sans Condensed kick at the moment but don’t have it in my TypeKit config yet). I went with official annual unemployment numbers as they may be calculated/adjusted differently (I didn’t check, but I knew that data source existed, so I used it).
One reason I’m doing this is a quote on the Workout Wednesday post:
This will be a very tedious exercise. To provide some context, this took me 2-3 hours to create. Don’t get discouraged and don’t feel like you have to do it all in one sitting. Basically, try to make yours look identical to mine.
This took me 10 minutes to create in R:
#' ---
#' output:
#'  html_document:
#'    keep_md: true
#' --- #+ message=FALSE library(ggplot2) library(hrbrmisc) library(readxl) library(tidyverse) # Use official BLS annual unemployment data vs manually calculating the average # Source: https://data.bls.gov/timeseries/LNU04000000?years_option=all_years&periods_option=specific_periods&periods=Annual+Data read_excel("~/Data/annual.xlsx", skip=10) %>% mutate(Year=as.character(as.integer(Year)), Annual=Annual/100) -> annual_rate # The data source Andy Kriebel curated for you/us: https://1drv.ms/x/s!AhZVJtXF2-tD1UVEK7gYn2vN5Hxn #ty Andy! read_excel("~/Data/staadata.xlsx") %>% left_join(annual_rate) %>% filter(State != "District of Columbia") %>% mutate( year = as.Date(sprintf("%s-01-01", Year)), pct = (Unemployed / `Civilian Labor Force Population`), us_diff = -(Annual-pct), col = ifelse(us_diff<0, "Better than U.S. National Average", "Worse than U.S. National Average") ) -> df credits <- "Notes: Excludes the District of Columbia. 2016 figure represents October rate.\nData: U.S. Bureau of Labor Statistics <https://www.bls.gov/lau/staadata.txt>\nCredit: Matt Stiles/The Daily Viz <thedailyviz.com>" #+ state_of_us, fig.height=21.5, fig.width=8.75, fig.retina=2 ggplot(df, aes(year, us_diff, group=State)) + geom_segment(aes(xend=year, yend=0, color=col), size=0.5) + scale_x_date(expand=c(0,0), date_labels="'%y") + scale_y_continuous(expand=c(0,0), label=scales::percent, limit=c(-0.09, 0.09)) + scale_color_manual(name=NULL, expand=c(0,0), values=c(`Better than U.S. National Average`="#4575b4", `Worse than U.S. National Average`="#d73027")) + facet_wrap(~State, ncol=5, scales="free_x") + labs(x=NULL, y=NULL, title="The State of U.S. Jobs: 1976-2016", subtitle="Percentage points below or above the national unemployment rate, by state. Negative values represent unemployment rates\nthat were lower — or better, from a jobs perspective — than the national rate.", caption=credits) + theme_hrbrmstr_msc(grid="Y", strip_text_size=9) + theme(panel.background=element_rect(color="#00000000", fill="#f0f0f055")) + theme(panel.spacing=unit(0.5, "lines")) + theme(plot.subtitle=element_text(family="MuseoSansCond-300")) + theme(legend.position="top")
Swap out ~/Data for where you stored the files.
The “weird” looking comments enable me to spin the script and is pretty much just the inverse markup for knitr R Markdown documents. As the comments say, you should really thank Andy for curating the BLS data for you/us.
If I really didn’t pine over aesthetics it would have taken me 5 minutes (most of that was waiting for re-rendering). Formatting the blog post took much longer. Plus, I can update the data source and re-run this in the future without clicking anything. This re-emphasizes a caution I tell my students: beware of dragon droppings (“drag-and-drop data science/visualization tools”).
Hopefully you presently follow or will start following Workout Wednesday and Makeover Monday and dedicate some time to hone your skills with those visualization katas.
转自:https://rud.is/b/2017/01/18/workout-wednesday-redux-2017-week-3/
转载于:https://www.cnblogs.com/payton/p/6305974.html
Workout Wednesday Redux (2017 Week 3)相关推荐
- 某熊周刊:一周推荐外文技术资料(1.1)
本文从属于某熊周刊:一周推荐外文技术资料是笔者每周浏览外文技术网站中时发现的不错的文章/项目/书籍/教程的集锦,可以关注笔者的专栏某熊的全栈之路及时获取更新.资讯来源包括但不限于Medium.Twit ...
- 前端必看书籍总结(哪些值得看)
JavaScript 高级程序设计 前端红宝书 2012年3月1日 门外汉入门 初级前端进阶 JS 语法讲得比较细致 如第3.4.5.7.8. 10.11.13.14.20. 21 没有 ES6 是最 ...
- ecna 2017 J Workout for a Dumbbell (模拟)
问题 J: Workout for a Dumbbell 时间限制: 1 Sec 内存限制: 128 MB 题目描述 Jim Ratt has just joined a local fitness ...
- ECNA 2017 Problem J: Workout for a Dumbbell 模拟
参考博客 提交链接 FROM SDUT 2018 Summer Team Contest 8th 地址 #include <iostream> #include<bits/stdc+ ...
- March 22 2017 Week 12 Wednesday
Satisfaction doesn't come from the outside, but from the inside. 满足感并非来自外界,而是来自内心. Everything that e ...
- 好奇号火星车旅行日志January 25, 2017 – Wednesday火星日1591-1592车轮检查
火星日1589-1590的计划完成的非常好,我行进了月31米.化学成分相机的故障依旧,诊断工作已经加入了本周的日程.我们正在接近Bagnold沙丘(BagnoldDunes),为了节约更多的时间用于科 ...
- [译] 新一代 JavaScript 的开发图谱(2017)
本文讲的是[译] 新一代 JavaScript 的开发图谱(2017), 原文地址:A Map To Modern JavaScript Development 原文作者:Santiago de Le ...
- [译] Redux 有多棒?
本文讲的是[译] Redux 有多棒?, 原文地址:What's So Great About Redux? 原文作者:Justin Falcone 译文出自:掘金翻译计划 本文永久链接:https: ...
- ELSE 技术周刊(2017.12.25期)
业界动态 V8 release v6.4 V8引擎发布v6.4,在速度和内存优化上又带来了一些提升.对于instanceof操作符的优化,带来了3.6x速度提升,同时使得uglify-js提高了15- ...
最新文章
- pycharm 报错 out of memory 解决方法
- 机器学习(MACHINE LEARNING)MATLAB进行概率统计分析
- Mysql 日志系统 redo log 和 binlog
- bp神经网络代码_机器学习(周志华)课后习题——第五章——神经网络
- .net导出Excel几种方式比较
- 解决:delphi7 license is invalid or has expired
- 从微信服务器获取用户信息,微信小程序Ⅴ [获取登陆用户信息,重点openID(详解)]...
- python之爬虫(四)之 Requests库的基本使用
- 事件处理程序的执行上下文
- adobe FMS(flash media server)错误解决小结
- java获取语言_如何在java中获取语言环境对象?
- A Deep Learning Tutorial: From Perceptrons to Deep Networks
- 使用MySQL管理工具-SQLyog9.63报错号码2003,超详细解析
- pdf阅读器怎么样去拆分文档啊
- 从“果链”到新能源,立讯精密的B端生意成色几何?
- 《Photoshop蒙版与合成(第2版)》目录—导读
- AWNet: Attentive Wavelet Network for Image ISP AWNet:图像 ISP 的注意力小波网络(个人笔记,勿喷)
- Java中的数据文件
- Nginx 对俄罗斯动手了。。。
- 和Leo一起做爱线段树的好孩子之火车运输
热门文章
- Lua之Lua安装与Lua变量-TTLSA(一)
- vue 引入bootstarp --webpack
- IE不能开新窗口的解决方法
- React 的性能优化(一)当 PureComponent 遇上 ImmutableJS
- 15 Small-Space Tricks We're Stealing from Real Tiny Apartments
- mpvue开发小程序所遇问题及h5转化方案
- 分布式监控系统Zabbix3.2对数据库的连接数预警
- Struts2中导入外部xml文件出现Included file cannot be found错误!
- json省市区城市级联
- mysql性能优化学习笔记-存储引擎