Nagios监控笔记上
Nagios软件介绍及服务端安装部署实战
1. Nagios服务端安装
1.1 准备3台服务器或者虚拟机器
|
管理IP地址 |
角色 |
备注 |
|
192.168.1.80 |
Nagios监控服务器 |
|
|
192.168.1.81 |
Lamp服务器 |
被监控的客户端服务器 |
|
192.168.1.82 |
Lamp服务器 |
被监控的客户端服务器 |
1.2 解决perl编译问题:
后面编译的软件有perl程序,这里要提前设置下环境变量
批量执行命令如下:
echo 'export LC_ALL=C' >> /etc/profile 去除所有本地化的设置,让命令能正确执行
tail -1 /etc/profile
source /etc/profile
echo $LC_ALL --------C表示正确
1.3 关闭nagios server 防火墙
测试环境下为了调试方便关闭防火墙
/etc/init.d/iptables stop
chkconfig iptables off
1.4 解决系统时间同步
如果不解决时间同步,会导致nagios配置异常甚至失败
crontab -e
#time sync by oldboy at 2010-2-1
*/10 * * * * /usr/sbin/ntpdate pool.ntp.org >/dev/null 2>&1
1.5 安装或者升级nagios所需的基础软件包
yum -y install gcc glibc glibc-common gd gd-devel httpd php php-gd
yum -y install mysql* (非必需,如果要监控mysql需要安装)
1.6 创建nagios所需的用户及组
useradd -m nagios
useradd apache
groupadd nagcmd
usermod -a -G nagcmd nagios
usermod -a -G nagcmd apache
1.7 安装nagios软件包
tar -xf nagios-4.1.1.tar.gz
cd nagios-4.1.1
./configure --with-command-group=nagcmd
(注:如果是编译安装的httpd时,可以执行./configure --with-httpd-conf=/usr/local/apache/conf/extra增加一个编译参数即指定nagios web配置的生成路径)
make all
make install
make install-init
make install-commandmode
make install-config
1.8 安装nagios web 配置文件及创建登陆用户
make install-webconf
(注:如果通过编译安装httpd,编辑vim /usr/local/apache/conf/httpd.conf增加Include conf/extra/nagios.conf
或者mkdir -p /etc/httpd/conf && make install-webconf
cp /etc/httpd/conf.d/nagios.conf /usr/local/apache/conf/extra
vim /usr/local/apache/conf/httpd.conf增加Include conf/extra/nagios.conf
)
创建nagios web监控界面登入时需要的用户名(oldboy)及密码(redhat)
htpasswd -c /usr/local/nagios/etc/htpasswd.users oldboy
(之所以放到 /usr/local/nagios/etc/是因为这个文件中的密码是加密的)
1.9 添加监控报警的接收email地址
vim /usr/local/nagios/etc/objects/contacts.cfg +35
email nagios@localhost(改为自己的邮箱)
或者:sed -i 's#nagios@localhost#824412801@qq.com#' /usr/local/nagios/etc/objects/contacts.cfg
1.10 配置apache服务
启动apache : /etc/init.d/httpd start
1.11 安装nagios插件软件包
tar -xf nagios-plugins-2.1.1.tar.gz
cd nagios-plugins-2.1.1
./configure --with-nagios-user=nagios --with-nagios-group=nagios --enable-perl-modules
make (如果编译遇到Error2则configure加--with-mysql=/usr/local/mysql解决)
make install
检查插件软件包的个数:
ls /usr/local/nagios/libexec/ | wc -l
1.12 配置nagios自启动
chkconfig nagios on
1.13 验证nagios配置文件(检查语法)
/usr/local/nagios/bin/nagios -v /usr/local/nagios/etc/nagios.cfg
或者:/etc/init.d/nagios checkconfig
启动nagios服务
/etc/init.d/nagios start
检查nagios进程
ps -ef | grep nagios
(如果启动失败,检查selinux是否关闭)
此时打开浏览器输入ip/nagios 输入以上设置的用户名密码即可进入
1.14 安装nrpe
tar -xf nrpe-2.15.tar.gz
cd nrpe-2.15
./configure
make all
make install-plugin
make install-daemon
make install-daemon-config
提示:生成nrpe的配置文件/usr/local/nagios/etc/nrpe.cfg
服务端也要安装nrpe,不然会缺少相关检测配件,另外服务端也会监控自身的基本健康状态
2. Nagios客户端安装
2.1 解决perl编译问题:
后面编译的软件有perl程序,这里要提前设置下环境变量
批量执行命令如下:
echo 'export LC_ALL=C' >> /etc/profile
tail -1 /etc/profile
source /etc/profile
echo $LC_ALL --------C表示正确
2.2 关闭nagios server 防火墙
测试环境下为了调试方便关闭防火墙
/etc/init.d/iptables stop
chkconfig iptables off
2.3 解决系统时间同步
如果不解决时间同步,会导致nagios配置异常甚至失败
crontab -e
#time sync by oldboy at 2010-2-1
*/10 * * * * /usr/sbin/ntpdate pool.ntp.org >/dev/null 2>&1
2.4 安装nagios-plugins-2.1.1.tar.gz
useradd nagios -M -s /sbin/nologin
tar -xf nagios-plugins-2.1.1.tar.gz
cd nagios-plugins-2.1.1
./configure --with-nagios-user=nagios --with-nagios-group=nagios --enable-perl-modules
(如果是编译安装: yum install perl-devel perl-CPAN -y
./configure --with-nagios-user=nagios --with-nagios-group=nagios --enable-perl-modules --with-httpd-conf=/usr/local/apache/conf/extra --with-mysql=/application/mysql)
make
make install
检查插件软件包的个数:
ls /usr/local/nagios/libexec/ | wc -l
2.5 安装nrpe
tar -xf nrpe-2.15.tar.gz
cd nrpe-2.15
./configure
make all
make install-plugin
make install-daemon
make install-daemon-config
2.6 安装其他插件
tar -xf Params-Validate-0.91.tar.gz
cd Params-Validate-0.91
perl Makefile.PL
make
make install
----------------------------
tar -xf Class-Accessor-0.34.tar.gz
cd Class-Accessor-0.34
perl Makefile.PL
make
make install
------------------------
tar -xf Config-Tiny-2.23.gz
cd Config-Tiny-2.23
perl Makefile.PL
make && make install
-----------------------------
tar -xf Math-Calc-Units-1.07.tar.gz
cd Math-Calc-Units-1.07
perl Makefile.PL
make
make install
-----------------------------------
tar -xf Regexp-Common-2016020301.tar.gz
cd Regexp-Common-2016020301
perl Makefile.PL
make
make install
------------------------------------
yum install sysstat -y
这个命令是安装系统性能分析工具,监控系统性能时程序或脚本会调用这些工具
iostat 查看磁盘IO
2.7 配置开发的几个基础脚本插件
cp check_memory.pl /usr/local/nagios/libexec
cp check_iostat /usr/local/nagios/libexec
chmod 755 /usr/local/nagios/libexec/check_memory.pl
chmod 755 /usr/local/nagios/libexec/check_iostat
dos2unix /usr/local/nagios/libexec/check_memory.pl
dos2unix /usr/local/nagios/libexec/check_iostat
2.8 配置nrpe
cd /usr/local/nagios/etc/
vim nrpe.cfg +79
allowed_hosts=192.168.1.80 (nagios服务器的IP,配置允许哪个nagios连接)
(或者:perl -pi -e 's/allowed_hosts=127.0.0.1/allowed_hosts=192.168.1.80/g' /usr/local/nagios/etc/nrpe.cfg )
vim nrpe.cfg (291行)
#command[check_users]=/usr/local/nagios/libexec/check_users -w 5 -c 10
#command[check_load]=/usr/local/nagios/libexec/check_load -w 15,10,5 -c 30,25,20
#command[check_hda1]=/usr/local/nagios/libexec/check_disk -w 20% -c 10% -p /dev/hda1
#command[check_zombie_procs]=/usr/local/nagios/libexec/check_procs -w 5 -c 10 -s Z
#command[check_total_procs]=/usr/local/nagios/libexec/check_procs -w 150 -c 200
command[check_load]=/usr/local/nagios/libexec/check_load -w 15,10,5 -c 30,25,20
command[check_mem]=/usr/local/nagios/libexec/check_memory.pl -w 10% -c 3%
command[check_disk]=/usr/local/nagios/libexec/check_disk -w 15% -c 7% -p /
command[check_swap]=/usr/local/nagios/libexec/check_swap -w 20% -c 10%
command[check_iostat]=/usr/local/nagios/libexec/check_iostat -w 6 -c 10
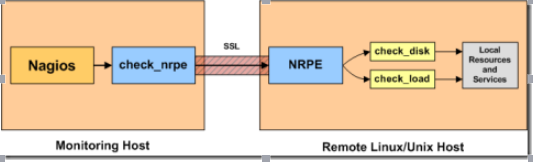
注:上面依次为对负载,内存,硬盘,虚拟内存,磁盘IO的监控,这些都是本地的服务(我们这里称之为被动监控),由nagios服务器通过nrpe插件定时去client的nrpe服务定期获取信息
/usr/local/nagios/bin/nrpe -c /usr/local/nagios/etc/nrpe.cfg -d
echo "/usr/local/nagios/bin/nrpe -c /usr/local/nagios/etc/nrpe.cfg -d" >> /etc/rc.local
vim etc/nagios.cfg +34 (配置如下主机和服务的胚子文件)
cfg_file=/usr/local/nagios/etc/objects/hosts.cfg
cfg_file=/usr/local/nagios/etc/objects/services.cfg
cfg_dir=/usr/local/nagios/etc/objects/services
(作为备用增加一个service目录,使用目录的优点很多,在目录下只要符合*.cfg就可以被nagios加载,使用脚本批量部署时非常方便的随机配置命令,必须存在此目录)
#cfg_file=/usr/local/nagios/etc/objects/localhost.cfg(对本机的监控注释掉)
创建services目录mkdir /usr/local/nagios/etc/objects/services
cd /usr/local/nagios/etc/objects
head -51 localhost.cfg >hosts.cfg
chown -R nagios.nagios /usr/local/nagios/etc/objects/hosts.cfg
chown -R nagios.nagios /usr/local/nagios/etc/objects/services.cfg
host_name Nagios-Server ; 设置主机的名字,该名字会出现在hostgroups.cfg 和services.cfg 中。注意,这个名字可以不是该服务器的主机名。
address 192.168.81.128 ; 主机的IP 地址
check_command check-host-alive ; 检查使用的命令,需要在命令定义文件定义,默认是定义好的。
retry_interval 1 ; 检测失败后重试的时间间隔
retain_nonstatus_information 0
contact_groups admins ; 报警需要通知的联系组
notification_interval 30 ; 故障后,两次报警的时间间隔,默认单位分钟
notification_period 24x7 ; 一天之内通知的周期 ,比如全天
notification_options d,u,r ; 通知的选项
按照监控的行为来看,Nagios插件的监控可以分为主动监控和被动监控
主动服务:我们把对于像URL监控这样的一般由服务端发出请求探测就可以得到数据的监控方式,定义为主动监控。当然,主动监控也可以配置成被动模式。
主机的配置可以只配置关键选项,多数选项课采用linux-server模板的默认值
host_name qmail #主机组名称,可以随意指定。
host_name qmail #主机组名称,可以随意指定。
host_name qmail #主机组名称,可以随意指定。
services.cfg文件是配置监控服务的,是nagios最重要的配置文件之一,对于服务器数量比较少(50台以内),大部分需要的监控服务配置都可以在里面添加,此文件默认不存在
use generic-service ;定义该服务使用的模板
host_name Nagios-Server ; 被监控的主机名,hosts.cfg 定义的主机名称
service_description check-host-alive ; 服务描述
normal_check_interval 3 ;正常状态检测间隔
contact_groups admins ; 发生故障通知的联系人组
notification_period 24x7 ; 通知的时间段
host_name a,b,c,d ;这里可以指定多台机器,通过逗号隔开
service_description Disk Partition
check_command check_nrpe!check_disk
check_period 24x7
max_check_attempts 3
normal_check_interval 3
retry_check_interval 2
contact_groups mailusers ;磁盘的报警值设定的合理些,可只报邮件不报短信
notification_interval 360
notification_period 24x7
notification_options w,u,c,r
check_command check-host-alive
process_perl_data1
}
也可以定义为模板
define service {
use generic-disk-service ;这就是在templates.cfgdinginess好的模板名
host_name 072-wiki
}
对URL的监控用/usr/local/nagios/libexec/check_http 中的选项命令
服务端口的监控
define service {
use generic-service
host_name 051-ett-1-1,052-ett-2-1
service_description img_8150
check_command check_tcp!8150
check_period 24x7
max_check_attempts 3
normal_check_interval 3
retry_check_interval 2
contact_groups mailusers ;磁盘的报警值设定的合理些,可只报邮件不报短信
notification_interval 360
notification_period 24x7
notification_options w,u,c,r
check_command check-host-alive
process_perl_data1
3.5 commands.cfg生产库实战配置例子
commands.cfg这个是定义报警命令的配置文件
define contact{
contact_name maoxian ; 联系人的名字
alias maoxian ; 别名
service_notification_period 24x7 ; 服务报警的时间段
host_notification_period 24x7 ; 主机报警的时间段
service_notification_options w,u,c,r ; 就是在这四种情况下报警。
host_notification_options d,u,r ;同上。
#服务报警发消息的命令,在command.cfg 中定义。
service_notification_commands notify-service-by-email
#服务报警发消息的命令,在command.cfg 中定义。
host_notification_commands notify-host-by-email
email wangyx088@gmail.com ; 定义邮件地址,也就是接收报警邮件地址。
}
注:模板文件在/usr/local/nagios/etc/objects/templates.cfg ,可以复制模板,批量修改,便捷很多
3.6 nagios实战配置过程细节
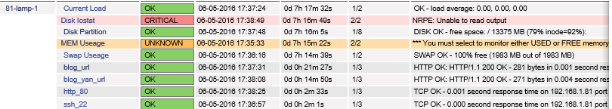
3.6.1 监控客户端服务器磁盘分区、Load负载、Mem内存、swap、磁盘IO【被动模式】
1)首先在hosts.cfg里添加客户端主机和主机组(HOSTGROUP)
cd /usr/local/nagios/etc/objects
vim hosts.cfg
define host{
use linux-server
host_name 81-lamp-1
alias 81-lamp-1
address 192.168.1.81
}
#初学者增加上面一个HOST作为测试即可
define host{
use linux-server
host_name 82-lamp-1
alias 82-lamp-1
address 192.168.1.82
check_command check-host-alive
check_period 24x7
max_check_attempts 3
normal_check_interval 2
retry_check_interval 2
contact_groups admins
notification_interval 300
notification_period 24x7
notification_options d,u,r
process_perl_data1
}
define hostgroup{
hostgroup_name linux-servers ; The name of the hostgroup
alias Linux Servers ; Long name of the group
members 81-lamp-1,82-lamp-1 ; Comma separated list of hosts that belong to this group
}
2)接下来添加要监控的服务配置到services.cfg
vim services.cfg
define service {
use generic-service
host_name 81-lamp-1,82-lamp-1
service_description Current Load
check_command check_nrpe!check_load
max_check_attempts 2
normal_check_interval 4
retry_check_interval 4
check_period 24x7
notification_interval 1440
notification_period 24x7
notification_options w,u,c,r
contact_groups admins
process_perl_data 1
}
define service {
use generic-service
host_name 81-lamp-1,82-lamp-1
service_description MEM Useage
check_command check_nrpe!check_mem
max_check_attempts 2
normal_check_interval 4
retry_check_interval 4
check_period 24x7
notification_interval 1440
notification_period 24x7
notification_options w,u,c,r
contact_groups admins
process_perl_data 1
}
define service {
use generic-service
host_name 81-lamp-1,82-lamp-1
service_description Swap Useage
check_command check_nrpe!check_swap
max_check_attempts 2
normal_check_interval 4
retry_check_interval 4
check_period 24x7
notification_interval 480
notification_period workhours
notification_options w,u,c,r
contact_groups admins
process_perl_data 1
}
define service {
use generic-service
host_name 81-lamp-1,82-lamp-1
service_description Disk Partition
check_command check_nrpe!check_disk
max_check_attempts 8
normal_check_interval 3
retry_check_interval 2
check_period 24x7
notification_interval 360
notification_period 24x7
notification_options w,u,c,r
contact_groups admins
process_perl_data 1
}
define service {
use generic-service
host_name 81-lamp-1,82-lamp-1
service_description Disk Iostat
check_command check_nrpe!check_iostat!5!11
max_check_attempts 2
normal_check_interval 4
retry_check_interval 4
check_period 24x7
notification_interval 1440
notification_period 24x7
notification_options w,u,c,r
contact_groups admins
process_perl_data 1
}
3)检查配置文件
/usr/local/nagios/bin/nagios -v /usr/local/nagios/etc/nagios.cfg
Warning: Duplicate definition found for hostgroup 'linux-servers' (config file '/usr/local/nagios/etc/objects/localhost.cfg', starting on line 45)
Error: Could not add object property in file '/usr/local/nagios/etc/objects/localhost.cfg' on line 46.
Error processing object config files!
此错误的解决办法,将localhost.cfg中的46行的组名重改一个
hostgroup_name linux-servers1 ; The name of the hostgroup
alias Linux Servers1
Error: Service check command 'check_nrpe!check_load' specified in service 'Current Load' for host '81-lamp-1' not defined anywhere!
Error: Service check command 'check_nrpe!check_iostat!5!11' specified in service 'Disk Iostat' for host '81-lamp-1' not defined anywhere!
Error: Service check command 'check_nrpe!check_disk' specified in service 'Disk Partition' for host '81-lamp-1' not defined anywhere!
Error: Service check command 'check_nrpe!check_mem' specified in service 'MEM Useage' for host '81-lamp-1' not defined anywhere!
Error: Service check command 'check_nrpe!check_swap' specified in service 'Swap Useage' for host '81-lamp-1' not defined anywhere!
Error: Service check command 'check_nrpe!check_load' specified in service 'Current Load' for host '82-lamp-1' not defined anywhere!
Error: Service check command 'check_nrpe!check_iostat!5!11' specified in service 'Disk Iostat' for host '82-lamp-1' not defined anywhere!
Error: Service check command 'check_nrpe!check_disk' specified in service 'Disk Partition' for host '82-lamp-1' not defined anywhere!
Error: Service check command 'check_nrpe!check_mem' specified in service 'MEM Useage' for host '82-lamp-1' not defined anywhere!
Error: Service check command 'check_nrpe!check_swap' specified in service 'Swap Useage' for host '82-lamp-1' not defined anywhere!
..............................
Total Warnings: 0
Total Errors: 10
..........................
根据错误提示,我们可以知道,是check_nrpe插件没有定义导致
需要在commands.cfg中加入check_nrpe的插件配置
vim commands.cfg (在结尾添加)
#check_nrpe' command definition
define command {
command_name check_nrpe
command_line $USER1$/check_nrpe -H $HOSTADDRESS$ -c $ARG1$
}
此时再检查语法正确,全部正确
4)启动nagios
/etc/init.d/nagios start
打开浏览器访问:192.168.1.80/nagios
此时登陆进去会报如下错误:
It appears as though you do not have permission to view information for any of the hosts you requested...
If you believe this is an error, check the HTTP server authentication requirements for accessing this CGI
and check the authorization options in your CGI configuration file.
解决方法:
cd /usr/local/nagios/etc
vim cgi.cfg
将其中所有的nagiosadmin全部替换成当前的登陆用户oldboy(%s/nagiosadmin/yan/g)
/etc/init.d/nagios reload
4. 通过URL及端口方式监控客户端主机提供的服务
4.1 增加从nagios服务器端发起的监控:如url地址,端口监控
此类服务一般都是开启了对外提供业务服务。这样的业务,我们一般采取主动监控的方式
4.1.1 对域名URL地址http://www.yan.com 的监控
1)添加要监控的服务配置到services.cfg
vim etc/objects/services.cfg
define service {
use generic-service
host_name 81-lamp-1
service_description blog_url
check_command check_weburl!-H www.yan.com(81主机)
max_check_attempts 3
normal_check_interval 2
retry_check_interval 1
check_period 24x7
notification_interval 30
notification_period 24x7
notification_options w,u,c,r
contact_groups admins
}
/usr/local/nagios/bin/nagios -v /usr/local/nagios/etc/nagios.cfg(检查语法)
有一个错误
Error: Service check command 'check_weburl!-H 192.168.1.80' specified in service 'blog_url' for host '81-lamp-1' not defined anywhere!
2)解决办法,需要在commands.cfg中加入check_weburl的插件配置
vim commands.cfg
#'check_weburl' command definition
define command {
command_name check_weburl
command_line $USER1$/check_http $ARG1$ -w 10 -c 30
}
3)如果是测试URL监控,注意在nagios服务端的/etc/hosts下加
192.168.1.81 www.yan.com
4.1.2 对域名URL地址http://www.yan.com/yan/test.html的监控
vim etc/objects/services.cfg
define service {
use generic-service
host_name 81-lamp-1
service_description blog_yan_url
check_command check_weburl!-H www.yan.com -u /yan/test.html
max_check_attempts 3
normal_check_interval 2
retry_check_interval 1
check_period 24x7
notification_interval 30
notification_period 24x7
notification_options w,u,c,r
contact_groups admins
}
因为wget http://www.yan.com/yan/test.html报404错误,所以现在监控不到
需要在81主机: mkdir /var/www/html/yan
vim /var/www/html/yan/index.html
4.1.3 对特殊带传参的URL地址的监控
vim etc/objects/services.cfg
define service {
use generic-service
host_name yan_app
service_description appVIP_url
check_command check_weburl!-H www.yan.com -u “/yan/index.php?m=article&a=list&id=670”
max_check_attempts 3
normal_check_interval 2
retry_check_interval 1
check_period 24x7
notification_interval 30
notification_period 24x7
notification_options w,u,c,r
contact_groups admins
}
4.2 监控任意端口举例如:80,110,25,8080
vim etc/objects/services.cfg
define service {
use generic-service
host_name 81-lamp-1
service_description ssh_22
check_command check_tcp!22
max_check_attempts 3
normal_check_interval 2
retry_check_interval 1
check_period 24x7
notification_interval 30
notification_period 24x7
notification_options w,u,c,r
contact_groups admins
}
define service {
use generic-service
host_name 81-lamp-1
service_description http_80
check_command check_tcp!80
max_check_attempts 3
normal_check_interval 2
retry_check_interval 1
check_period 24x7
notification_interval 30
notification_period 24x7
notification_options w,u,c,r
contact_groups admins
}
检查语法:
/usr/local/nagios/bin/nagios -v /usr/local/nagios/etc/nagios.cfg(没有错误)
(因为commands.cfg中默认已经定义了check_tcp)
重新加载配置:
/etc/init.d/nagios reload
4.3 nagios调试
4.3.1 优化配置nagios启动脚本检查nagios语法
4.3.2 通过日志排查问题
tail /usr/local/nagios/var/nagios.log
4.3.3 被动模式错误排查
NRPE: Unable to read output
1)从nagios服务端执行/usr/local/nagios/libexec/check_nrpe-H192.168.1.81 check_mem
2)从客户端本地执行命令脚本检查(就是command[check_mem]=后面对应的脚本)
/usr/local/nagios/libexec/check_memory.pl -w 10% -c 3%(这个命令最后复制nrpe.cfg里的配置,不要手巧,防止出错)
4.4 基本部署及服务监控常见问题
4.4.1 问题1.打开IE无服务,出现下面错误
It appears as though you do not have permission to view information for any services you requested......
原因:打开IE登陆的nagios用户无访问权限
解决:vi /usr/local/nagios/etc/cgi.cfg
将其中所有的nagiosadmin全部替换成当前的登陆用户oldboy(%s/nagiosadmin/yan/g)
或者:将use_authentication的值改为0.
use_authentication=0
5. nagios图形监控显示和管理【服务端】
5.1 Pnp安装图形监控曲线(服务器端)
1)yum安装pnp软件需要的基础包
yum -y install cairo pango* zlib zlib-devel freetype freetype-devel gd gd-devel
2)安装libart_lgpl-2.3.17.tar.gz
tar -xf libart_lgpl-2.3.17.tar.gz
cd libart_lgpl-2.3.17
./configure
make
make install
cp -r /usr/local/include/libart-2.0 /usr/include/
3)安装rrdtool-1.4.5.tar.gz
tar -xf rrdtool-1.4.5.tar.gz
cd rrdtool-1.4.5
./configure --prefix=/usr/local/rrdtool --disable-python --disable-tcl
configure:error:Please fix the library issues listed above and try again
解决办法:yum -y install libxml*
make && make install
ll /usr/local/rrdtool/bin/
total 500
-rwxr-xr-x. 1 root root 121433 Jun 5 23:47 rrdcached
-rwxr-xr-x. 1 root root 59970 Jun 5 23:47 rrdcgi
-rwxr-xr-x. 1 root root 61134 Jun 5 23:47 rrdtool
-rwxr-xr-x. 1 root root 264602 Jun 5 23:47 rrdupdate
4)安装pnp-0.4.13.tar.gz
tar -xf pnp-0.4.13.tar.gz
cd pnp-0.4.13
./configure --with-rrdtool=/usr/local/rrdtool/bin/rrdtool --with-perfdata-dir=/usr/local/nagios/share/perfdata
make all
make install
make install-config
make install-init
PNP提供了一个perl脚本,可以用如下命令查到
ll /usr/local/nagios/libexec/ | grep process
-rwxr-xr-x. 1 nagios nagios 30151 Jun 6 00:19 process_perfdata.pl
5.2 nagios出图相关基本配置
1)vim /usr/local/nagios/etc/nagios.cfg +835
process_performance_data=1
host_perfdata_command=process-host-perfdata
service_perfdata_command=process-service-perfdata
2)vim /usr/local/nagios/etc/objects/commands.cfg +227
删除227-238,添加:
# 'process-host-perfdata' command definition
define command{
command_name process-host-perfdata
command_line /usr/local/nagios/libexec/process_perfdata.pl
}
# 'process-service-perfdata' command definition
define command{
command_name process-service-perfdata
command_line /usr/local/nagios/libexec/process_perfdata.pl
}
(注:也可以用nagios变量$USER1$替代/usr/local/nagios/libexec/路径)
3)检查语法
/usr/local/nagios/bin/nagios -v /usr/local/nagios/etc/nagios.cfg
4)重新加载nagios
/etc/init.d/nagios reload
5)浏览器输入192.168.1.80/nagios/pnp/index.php
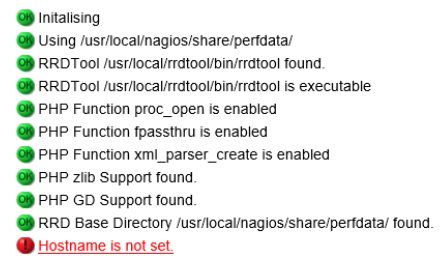
出现这种情况,刷新几下就好
5.3 配置各个服务出监控状态图
1)服务出图记录数据设置
执行编辑命令vim services.cfg,在各个服务里加process_perf_data 1
2)主机出图配置
执行编辑命令hosts.cfg,在各个服务里加process_perf_data 1
3)整合pnp url超链接到nagios图形显示界面里
提示:这会在主机或对应服务前面,出现一个红太阳图标,点击就是对应的服务图形监控状态
5.3.2 给主机添加红太阳超链接图标
方法一:
vim /usr/local/nagios/etc/objects/hosts.cfg 添加如下配置
#grapbic for hosts create by yan!
define hostextinfo {
host_name 81-lamp-1
action_url /nagios/php/index.php?host=$HOSTNAME$
}
方法二:
vim /usr/local/nagios/etc/objects/hosts.cfg 各个服务中添加如下
action_url /nagios/php/index.php?host=$HOSTNAME$
5.3.3 给指定服务添加红太阳超链接图标
方法一:
vim /usr/local/nagios/etc/objects/services.cfg 结尾添加
#go sun link logo by yan
define serviceextinfo {
host_name 81-lamp-1
service_description Swap Useage
active_url /nagios/php/index.php?host=$HOSTNAME$&srv=$SERVICEDESC$
}
#go sun link logo by yan
define serviceextinfo {
host_name 81-lamp-1
service_description http_80
active_url /nagios/php/index.php?host=$HOSTNAME$&srv=$SERVICEDESC$
}
方法二:
vim /usr/local/nagios/etc/objects/services.cfg 各个服务中添加如下
action_url/nagios/php/index.php?host=$HOSTNAME$&srv=$SERVICEDESC$
5.3.4 出图的图像数据存放路径
ll /usr/local/nagios/share/perfdata/
6. Nagios报警方式及生产报警策略
6.1 报警的种类及报警方式使用
6.1.1 报警的种类
1)邮件报警,生产环境尽量使用公司的信箱作为报警邮箱
2)飞信:首先在win32上装个飞信客户端,把对方手机加为好友,然后就可以给对方发短信了
3)邮件转短信报警,如139、126、189信箱:信箱邮件到达后,通过手机通知收件人是邮箱提供商提供的一个功能
4)http短信网关
5)购买短信猫,类似手机终端一样的客户端硬件设备,实现报警,早期报警选用的一个方式
6)电话语音报警,在报警时直接电话给报警负责人
7)MSN,QQ及时通讯报警,模拟QQ,MSN发消息的功能,网友开发了程序,从命令行执行程序利用MSN,QQ协议,直接发给MSN和QQ好友
6.1.2 邮件报警的基本配置方法
vim /usr/local/nagios/etc/objects/contacts.cfg +35
email 824412801@qq.com
默认的报警配置在command.cfg里
# 'notify-host-by-email' command definition
define command{
command_name notify-host-by-email
command_line /usr/bin/printf "%b" "***** Nagios *****\n\nNotification Type: $NOTIFICATIONTYPE$\nHost: $HOSTNAME$\nState: $HOSTSTATE$\nAddress: $HOSTADDRESS$\nInfo: $HOSTOUTPUT$\n\nDate/Time: $LONGDATETIME$\n" | /bin/mail -s "Host $HOSTSTATE$ alert for $HOSTNAME$!" $CONTACTEMAIL$
}
# 'notify-service-by-email' command definition
define command{
command_name notify-service-by-email
command_line /usr/bin/printf "%b" "***** Nagios *****\n\nNotification Type: $NOTIFICATIONTYPE$\n\nService: $SERVICEDESC$\nHost: $HOSTALIAS$\nAddress: $HOSTADDRESS$\nState: $SERVICESTATE$\n\nDate/Time: $LONGDATETIME$\n\nAdditional Info:\n\n$SERVICEOUTPUT$\n" | /bin/mail -s "$HOSTALIAS$/$SERVICEDESC$ is $SERVICESTATE$" $CONTACTEMAIL$
}
templates.cfg中有关邮件报警的联系人模板配置【默认已经配置,如果配置飞信、MSN等要追加】
define contact{
name generic-contact ; The name of this contact template
service_notification_period 24x7 ; service notifications can be sent anytime
host_notification_period 24x7 ; host notifications can be sent anytime
service_notification_options w,u,c,r,f,s ; send notifications for all service states, flapping events, and scheduled downtime events
host_notification_options d,u,r,f,s ; send notifications for all host states, flapping events, and scheduled downtime events
service_notification_commands notify-service-by-email ; send service notifications via email
host_notification_commands notify-host-by-email ; send host notifications via email
register 0 ; DONT REGISTER THIS DEFINITION - ITS NOT A REAL CONTACT, JUST A TEMPLATE!
}
6.1.3 邮件转短信报警(139邮箱为例)
配置方法和和邮件报警一样,只不过在注册信箱后要开启邮箱邮件到达短信提醒功能(设置白名单)。邮件转短信报警的稳定性一般,且信息的容量有很大限制。因此,建议作为辅助报警方式。
6.1.4 联系人分级报警生产策略
vim contacts.cfg
#手机短信用户
define contact{
contact_name shouji_wo
use generic-contact
alias Nagios Admin
email 18306847338@139.com
}
define contact{
contact_name shouji_ni
use generic-contact
alias Nagios Admin
email 18306847338@139.com
}
#邮件及MSN账号
define contact{
contact_name shouji_yan
use generic-contact
alias Nagios Admin
email 824412801@qq.com
address1ryran@hotmail.com
}
define contact{
contact_name shouji_yu
use generic-contact
alias Nagios Admin
email pynznzyjy@163.com
address1ryran@hotmail.com
}
#手机组
define contactgroup{
contactgroup_name shoujiusers
alias Nagios Administrators
members shouji_wo,shouji_ni
}
#邮件msn账号组
define contactgroup{
contactgroup_name msnusers
alias Nagios Administrators
members msn_yan,msn_yu
}
6.1.5 vim services.cfg (各个服务需要报哪些组)
例如:
define service {
use generic-service
host_name 81-lamp-1,82-lamp-1
service_description Disk Partition
check_command check_nrpe!check_disk
max_check_attempts 8
normal_check_interval 3
retry_check_interval 2
check_period 24x7
notification_interval 360
notification_period 24x7
notification_options w,u,c,r
contact_groups admins,shoujiusers
process_perf_data 1
action_url /nagios/php/index.php?host=$HOSTNAME$&srv=$SERVICEDESC$
}
6.2 手机短信报警
6.2.1 飞信软件报警
飞信报警的实现原理是:首先在个人电脑上(非报警服务器)装个飞信客户端,然后注册一个用于报警的发送人账号,需要绑定手机,然后登陆飞信客户端,把需要接收报警的所有手机加为好友(需要对方确认),然后就可以使用发送人账号给对方发短信了服务器报警使用其命令行模式的发送方式
飞信机器人下载地址:http://www.it-adv.net/
1)解压fetion到/usr/local下面
tar -xf fetion.tar.gz -C /usr/local/
2)把飞信的lib库和系统的/usr/lib/做一个软连接
ln -s /usr/local/fetion/cenos54X64_20101113/lib/lib* /usr/lib
3)下面介绍飞信命令的一些选项【必须熟悉】
--mobile=[mobile] 这里是登陆的选项,使用手机号码登陆。 --sid=[sid] 这里是使用用户名登陆、
--pwd=[pwd] 这里是登陆的密码。
--config=[config file] *format:index mobile password
--index=[index no in config file,refer to sample.conf]
--debug *debug mode on --hide *login fetion in hidden state --to=[mobile/sid] 这个是接收人的手机号码 或者飞信用户名。
--command-path=[command file path]
--robotmode
--daemon(linux only) --proxy-ip(http proxy ip)
--proxy-port(http proxy port)
--msg-gb=[gb2312/gbk message]
--msg-utf8=[utf8 message] 这个是短信的内容,以UTF8格式
--msg-type=[0/1/2 sms longsms smartmsg]
--file-gb=[gb2312/gbk file]
--file-utf8=[utf8 file]
--query-cmcc-no
--auto-retry
--exit-on-verifycode
4)开始执行fetion测试命令:
特别注意:在执行下面的发送信息命令时会返回一堆信息,然后命令处于等待用户输入验证码阶段
./fetion --mobile=18306847338 --pwd=yan5714076 --to=18306847338 --msg-type=1 --msg-utf8="fetion test"
验证码在/usr/local/fetion/ 重开一个窗口,下载验证码图片
5)配置nagios通过飞信报警格式
a:修改command.cfg
cd /usr/local/nagios/etc/objects
vim commands.cfg +37 (添加以下内容)
# 'notify-host-by-fetion' command definition
define command{
command_name notify-host-by-fetion
command_line ./fetion --mobile=18306847338 --pwd=yan5714076 --to=18306847338 --msg-type=1 --msg-utf8="** $NOTIFICATIONTYPES$ Host Alert: $HOSTNAMES$ is $HOSTSTATE$ **"
}
# 'notify-service-by-fetion' command definition
define command{
command_name notify-service-by-fetion
command_line ./fetion --mobile=18306847338 --pwd=yan5714076 --to=18306847338 --msg-type=1 --msg-utf8="**$NOTIFICATIONTYPE$\n\nService: $SERVICEDESC$\nHost: $HOSTALIAS$\nAddress: $HOSTADDRESS$\nState: $SERVICESTATE$\n\nDate/Time: $LONGDATETIME$\n\nAdditional Info:\n\n$SERVICEOUTPUT$ **"
}
b:修改templates.cfg
vim templates.cfg +34
service_notification_commands notify-service-by-email,notify-service-by-fetion
host_notification_commands notify-host-by-email,notify-host-by-fetion
转载于:https://blog.51cto.com/yjy724/1842177
Nagios监控笔记上相关推荐
- 一线上nagios监控参数
一线上nagios监控参数 command[check_users]=/usr/local/nagios/libexec/check_users -w 5 -c 10 command[check_lo ...
- Nagios学习笔记
Nagios学习笔记之(一)最初搭建 2012-07-17 13:05:08 标签:linux 监控 nagios cacti 版权声明:原创作品,如需转载,请与作者联系.否则将追究法律责任. Nag ...
- 使用Nagios监控网页
使用Nagios监控网页<?xml:namespace prefix = o ns = "urn:schemas-microsoft-com:office:office" / ...
- Nagios 监控实例部署
Nagios是一款企业级开源软件,专注于监控服务器上服务是否正常,不生成图形,提供报警机制,邮件或者短信发送监控状态,它通过各种插件实现不同的功能. Nagios 监控平台主程序 Nagios-plu ...
- nagios监控+pnp4出图
Nagios监控系统 By:大官人 一.nagios简介 Nagios是一个监视系统运行状态和网络信息的监视系统.Nagios能监视所指定的本地或远程主机以及服务,同时提供异常通知功能等.Nagios ...
- Nagios监控linux服务器
原始出处 Nagios监控linux服务器 平台及所用组件, 监控服务器:RHEL5(192.168.0.20)+nagios-3.0.5+ nagios-plugins-1.4.11+ nr ...
- Nagios监控Dell服务器硬件状态
Server: check_openmanage 是一个 Nagios 的插件,它基于 OMSA 获取相关的报道信息,用来检测安装有 OpenManage Server Administrator ( ...
- Nagios监控Windows server 2003 系统
一.Nagios监控主机配置 [root@nagios ~]# cp /usr/local/nagios/etc/nagios.cfg /usr/local/nagios/etc/nagios.cfg ...
- Nagios监控部署(四)--被监控主机配置
五. 被监控主机设置<?xml:namespace prefix = o ns = "urn:schemas-microsoft-com:office:office" ...
最新文章
- 看完这篇缓存双写分析,你面试不再有问题呢~
- 11.15 dmidecode:查询系统硬件信息
- r语言处理数据集编码_在强调编码语言或工具之前,请学习这3个基本数据概念
- vue里面is_vue中的is
- 2021高校毕业生薪酬Top100出炉!
- java getconstructors,java 反射 constructors的问题,真心需要解决
- vue seo关键词设置_网站文章中如何设置关键词才更有利于SEO优化?
- 海康VisionMaster的使用
- 【模电笔记】6.集成运算放大器应用电路
- FTP探测-挖掘鸡2014免费版
- 不了解干眼症?可能你早就被它盯上了!
- GMT,UTC,CST,ISO等时间标志以及时区的总结
- 力扣杯-竞赛合集LCP 01. 猜数字
- windows10 录音机内录、外录、内外混合录的方法
- 使用 python 创建更改 word 文档
- 行为金融(六):证券市场中的异象
- HTML---- 渐变颜色, P强制不换行、自动换行、强制换行
- linux 制作iso 和 刻录DVD
- 两步路轨迹文件位置_两步路户外助手新手使用指南
- 手写数据库查询框架ORM