SQL Server中的执行计划
介绍 (Introduction)
In this article, I’m going to explain what the Execution Plans in SQL Server are and how to understand the details of an execution plan by reading the various metrics available once we hover over the components in the plan.
在本文中,一旦我们将鼠标悬停在计划中的各个组件上,我将通过阅读各种可用的指标来解释SQL Server中的执行计划以及如何理解执行计划的细节。
Being a Data Professional, it is very essential that we must understand how to write efficient queries that return faster results and how to tune the slow performing queries to achieve a boost in performance. In order to understand how the database engine works behind the scenes, we need to know the logical operations performed by the query processor. This can be done by investigating the execution plans generated by the query processor. An execution plan in SQL Server is a simple graphical representation of the operations that the query optimizer generates to calculate the most efficient way to return a set of results.
作为数据专业人员,我们必须了解如何编写能够返回更快结果的高效查询,以及如何调整执行缓慢的查询以提高性能,这一点至关重要。 为了了解数据库引擎在后台的工作方式,我们需要了解查询处理器执行的逻辑操作。 这可以通过调查查询处理器生成的执行计划来完成。 SQL Server中的执行计划是查询优化器生成的用于计算返回一组结果的最有效方法的操作的简单图形表示。
什么是执行计划? (What is an Execution Plan?)
As already mentioned earlier, an execution plan in SQL Server Management Studio is a graphical representation of the various steps that are involved in fetching results from the database tables. Once a query is executed, the query processing engine quickly generates multiple execution plans and selects the one which returns the results with the best performance. There are two types of execution plans to be specific –
如前所述,SQL Server Management Studio中的执行计划是从数据库表中获取结果所涉及的各个步骤的图形表示。 执行查询后,查询处理引擎会快速生成多个执行计划,并选择返回最佳性能的结果的计划。 具体有两种执行计划–
- Estimated Execution Plan估计执行计划
- Actual Execution Plan实际执行计划
如何生成执行计划? (How to generate Execution Plans?)
As we have learned, the Execution Plans in SQL Server can be generated before and after the query has been executed, I’m going to mention the various steps on how you can get the estimated and actual execution plans.
据我们了解,SQL Server中的执行计划可以在执行查询之前和之后生成,我将提到有关如何获取估计的和实际的执行计划的各个步骤。
SQL Server Management Studio中的估计执行计划 (Estimated Execution Plans in SQL Server Management Studio)
There are several ways to get the estimated execution plan in SQL Server.
有几种方法可以在SQL Server中获得估计的执行计划。
- Ctrl + L” and it will generate the estimated execution plan Ctrl + L ”,它将生成估计的执行计划
You can also right-click on the query window and select “Display Estimated Execution Plan” from the context menu that appears
您也可以右键单击查询窗口,然后从出现的上下文菜单中选择“ 显示估计的执行计划 ”
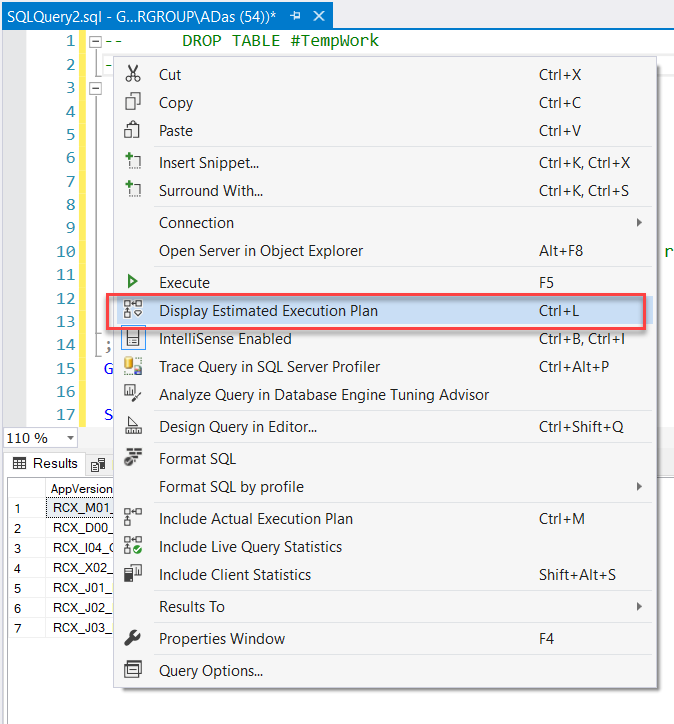
Figure 1 – Display Estimated Execution Plan Context
图1 –显示估计的执行计划上下文
Alternatively, you can directly click the “Display Estimated Execution Plan” icon which is available on the toolbar in SQL Server Management Studio
或者,您可以直接单击“ 显示估计的执行计划 ”图标,该图标在SQL Server Management Studio的工具栏上可用。

Figure 2 – Display Estimated Execution Plan Icon
图2 –显示估计的执行计划图标
SQL Server Management Studio中的实际执行计划 (Actual Execution Plans in SQL Server Management Studio)
Similarly, you can follow the steps below to get the actual execution plan in SQL Server.
同样,您可以按照以下步骤获取SQL Server中的实际执行计划。
- Ctrl + M” and it will generate the actual execution plan after the query has been executed successfully Ctrl + M ”,查询成功执行后将生成实际的执行计划
Right-click on the query window and select “Display Actual Execution Plan” from the context menu
右键单击查询窗口,然后从上下文菜单中选择“ 显示实际执行计划 ”
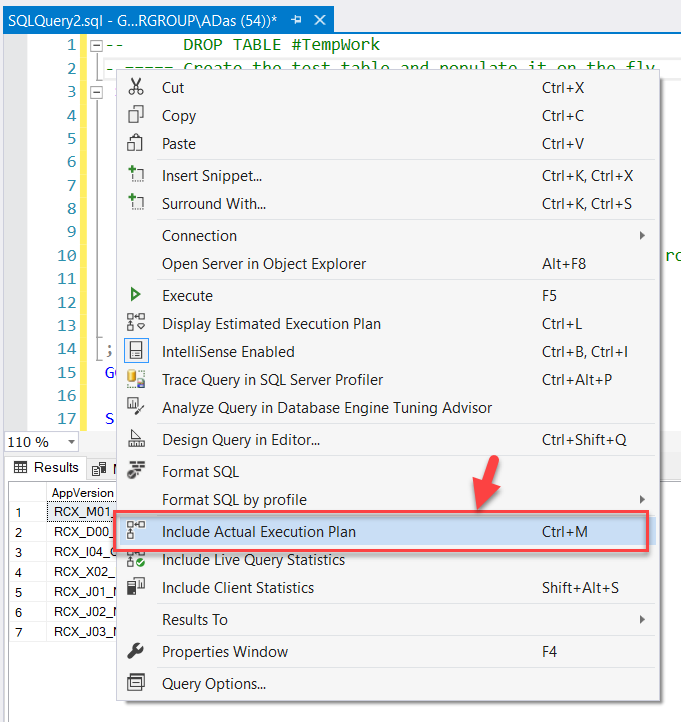
Figure 3 – Display Actual Execution Plan Context
图3 –显示实际执行计划上下文
Alternatively, you can directly click the “Display Actual Execution Plan” icon which is available on the toolbar in SQL Server Management Studio
或者,您可以直接单击“ 显示实际执行计划 ”图标,该图标在SQL Server Management Studio的工具栏上可用
Figure 4 – Display Actual Execution Plan Icon
图4 –显示实际执行计划图标
解释SQL Server Management Studio中的执行计划 (Interpreting Execution Plans in SQL Server Management Studio)
Once you generate the execution plans as mentioned in the steps above, you’ll see something like the diagram below as in Figure 5. For estimated plans, it will generate as soon as you perform the step whereas for the actual execution plan it will be displayed only after the query has been executed.
一旦按照上述步骤生成了执行计划,您将看到类似于图5的图 。 对于估计的计划,它将在您执行步骤后立即生成,而对于实际的执行计划,仅在执行查询后才显示。
Figure 5 – Execution Plan in SQL Server
图5 – SQL Server中的执行计划
For such simple queries, the estimated execution plans are usually like the actual execution plans. For the purpose of this tutorial, we will try to understand one of the operators of the Actual Execution Plan only.
对于这样的简单查询,估计的执行计划通常类似于实际的执行计划。 就本教程而言,我们将尝试仅了解“ 实际执行计划”的一名操作员。
In the execution plan depicted in the above Figure 5, if you hover the cursor over the components, you can view the detailed stats for each of the operations and components being displayed in the execution plan. The plan is interpreted from right-to-left and top-to-bottom. Since our plan consists of only one single row, there is no need for the top-to-bottom approach.
在上图5所示的执行计划中,如果将光标悬停在组件上,则可以查看执行计划中显示的每个操作和组件的详细统计信息。 从右到左和从上到下解释该计划。 由于我们的计划仅包含一行,因此不需要从上到下的方法。
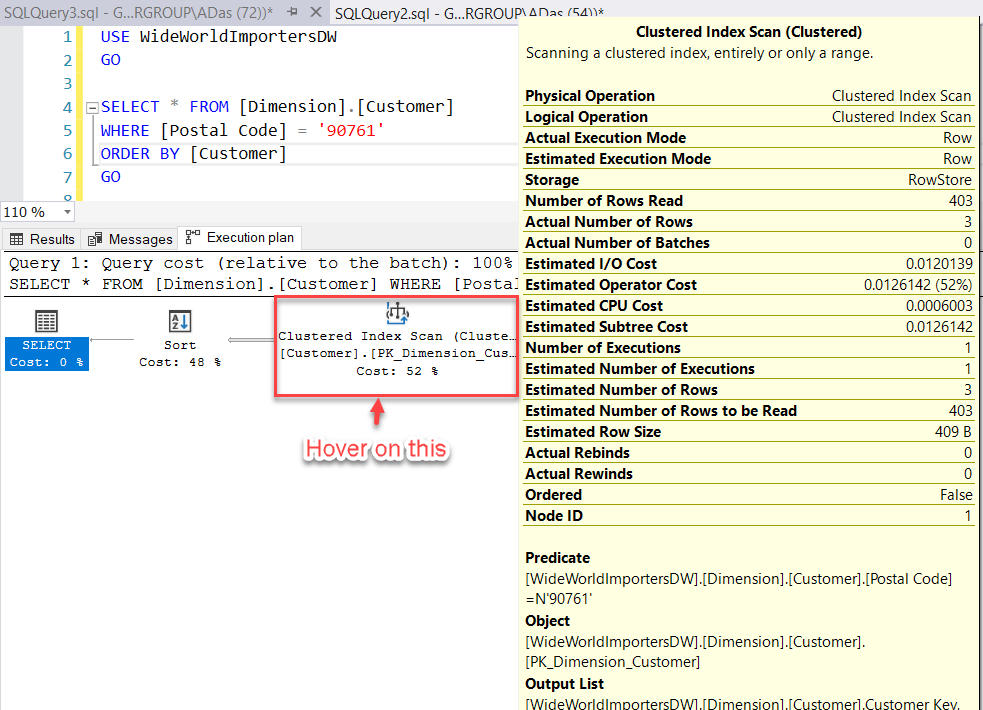
Figure 6 – Fetch Execution Plan Details
图6 –获取执行计划详细信息
We can distinguish the execution plan into the following five steps:
我们可以将执行计划分为以下五个步骤:
- Clustered Index Scan 聚集索引扫描
- Arrow) 箭头 )
- Sort Operator 排序运算符
- Arrow) 箭头 )
- Select Operator 选择运营商
For the sake of this tutorial, let’s only understand in detail the various metrics that are being involved for the Clustered Index Scan operator. The details of the other operators can also be viewed similarly; however, the detailed explanation of the metrics of the other operators is beyond the scope of this article.
为了本教程的缘故,让我们仅详细了解集群索引扫描运算符所涉及的各种指标。 其他运算符的详细信息也可以类似地查看; 但是,其他运营商指标的详细说明不在本文讨论范围之内。
聚集索引扫描 (Clustered Index Scan)
The first component when we traverse from right-to-left is the Clustered Index Scan component. This Index Scan is performed on the Primary Key of the table i.e. “PK_Dimension_Customer“. Let’s understand each of the metrics that are being displayed while we hover over the clustered index scan operator. You can refer to the Figure 7, for understanding more.
当我们从右向左遍历时,第一个组件是聚簇索引扫描组件。 此索引扫描是在表的主键即“ PK_Dimension_Customer ”上执行的。 让我们了解将鼠标悬停在聚集索引扫描运算符上时显示的每个指标。 您可以参考图7 ,以了解更多信息。
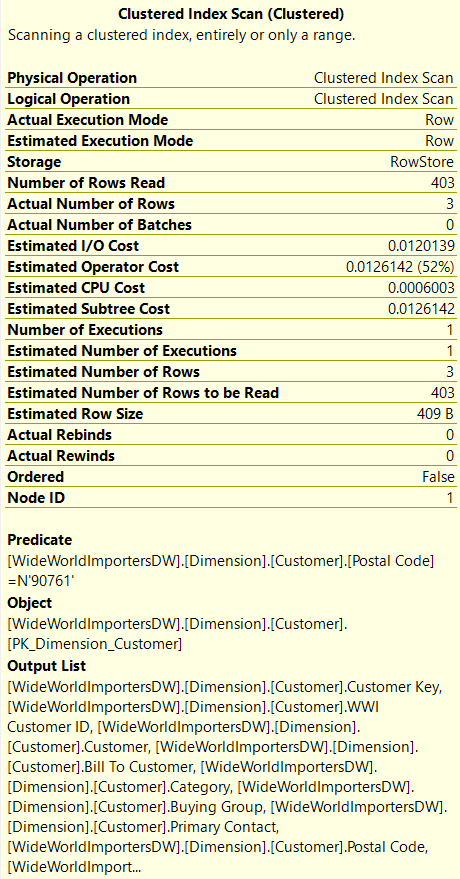
Figure 7 – Clustered Index Scan Operator
图7 –聚集索引扫描运算符
- Physical Operation: These are the operators that implement the operation as directed by the logical operators. All the physical operators are usually object which perform an operation. Some examples are 物理操作 :这些操作符按照逻辑操作符的指示执行操作。 通常所有物理操作员都是执行操作的对象。 一些示例是Clustered Index Scan, Index Seek etc. 聚簇索引扫描,索引查找等。
- Logical Operation: These operators describe the actual algebraic operation that is used to process the query. Examples are 逻辑运算 :这些运算符描述了用于处理查询的实际代数运算。 例子有Right Anti Semi Join, Hash Join etc. 右半连接,哈希连接等。
- Actual Execution Mode: This is the actual execution mode that is used by the processing engine to execute the query. Examples – 实际执行模式 :这是处理引擎用来执行查询的实际执行模式。 示例– Row and 行和Batch 批次
- Estimated Execution Mode: This is similar to Actual Execution Mode but shows the estimated value 估计执行模式 :类似于实际执行模式,但显示估计值
- Storage: This tells us how the query optimizer will store the results that are being extracted by the query 存储 :这告诉我们查询优化器将如何存储查询所提取的结果
- Number of Rows Read: This returns the total number of records that are being read by the operator from the table index 读取的行数 :这将返回操作员正在从表索引读取的记录总数
- Actual Number of Rows: This tells us the total number of records that have been returned based on the condition in the WHERE clause 实际行数 :这告诉我们根据WHERE子句中的条件返回的记录总数
- Actual Number of Batches: If the execution mode for the query is a batch, then it will list the number of batches being executed to fetch the results 实际批次数 :如果查询的执行方式是批次,则它将列出正在执行以获取结果的批次数
- Estimated I/O Cost: This tells us the cost of the input/output operations of the result set 估计的I / O成本 :这告诉我们结果集的输入/输出操作的成本
- Estimated Operator Cost: This is not an actual cost but relative information with respect to the other operators in the execution plan 估计的运营商成本 :这不是实际成本,而是执行计划中与其他运营商有关的相对信息
- Estimated CPU Cost: The cost that the CPU will incur in order to process the operation 估计的CPU成本 :CPU处理该操作将产生的成本
- Estimated Subtree Cost: The cost of the execution tree that is being currently read from right-to-left and top-to-bottom 估计的子树成本 :当前从右到左和从上到下读取的执行树的成本
- Number of Executions: This tells us about the number of executions that the optimizer can handle in a single batch 执行次数 :这告诉我们优化器可以在单个批处理中执行的执行次数
- Estimated Number of Executions: This is also similar to the Number of Executions just the estimated value 估计的执行次数 :这也类似于执行次数,只是估计值
- Estimated Number of Rows: The number of rows that the optimizer thinks will be returned by the operator 估计的行数 :优化器认为操作员将返回的行数
- Estimated Number of Rows to be Read: The number of rows that the optimizer thinks will be read by the operator 预计要读取的行数:优化程序认为将由操作员读取的行数
- Estimated Row Size: The storage size each row in the operator 估计行大小 :运算符中每行的存储大小
- Actual Rebinds: This tells us about how many times the reevaluation of the object must be done in order to process the operator 实际重新绑定 :告诉我们必须进行多少次对象重新评估才能处理操作员
- Actual Rewinds: This property tells us if there were any changes in the correlated values for the object that is being processed 实际倒带 :此属性告诉我们正在处理的对象的相关值是否发生任何更改
- Ordered: This property determines if the dataset on which the operation is to be performed in a sorted state or not 有序的 :此属性确定是否要在排序状态下对其执行操作的数据集
- Node ID: It is the automatic assignment of a number in the order in which the operator is called in the execution plan reading from 节点ID :按right-to-left and 从右到左和top-to-bottom 从上到下的顺序在执行计划中调用操作员的顺序自动编号
Additionally, if you see below, there are these three properties that tell us more about the query and the object on which the plan is generated.
此外,如果您在下面看到,还有这三个属性可以告诉我们更多有关查询和生成计划的对象的信息。
- Predicate: This is the value retrieved from the WHERE clause in the SQL statement 谓词 :这是从SQL语句的WHERE子句中检索到的值
- Object: The table on which the operation is being performed 对象 :正在对其执行操作的表
- Output: The selected columns are being displayed in the result set 输出 :所选列将显示在结果集中
You can also right-click any operator or arrow in the plan and select Properties to learn the more detailed explanation of the metrics displayed in the tooltip.
您还可以右键单击计划中的任何运算符或箭头,然后选择“ 属性”以了解工具提示中显示的指标的更详细说明。
在SQL Server Management Studio中保存执行计划 (Saving an Execution Plan in SQL Server Management Studio)
Sometimes, it is essential that after interpreting the plan generated by the query, you might want to save if for future references. SSMS provides an option to save the plan in the file system with an extension of “.sqlplan“.
有时,至关重要的是,在解释了查询生成的计划之后,您可能希望保存该表以备将来参考。 SSMS提供了将计划保存在文件系统中的扩展名“ .sqlplan ”的选项。
In order to save an execution plan, please follow the steps below.
为了保存执行计划,请按照以下步骤操作。
- Right-click on the plan window 右键单击计划窗口
Select Save Execution Plan As…
选择“ 将执行计划另存为”。
Figure 8 – Save the Plan As
图8 –将计划另存为
Select a location and provide a name for the execution plan and click on Save
选择一个位置并提供执行计划的名称,然后单击“ 保存”
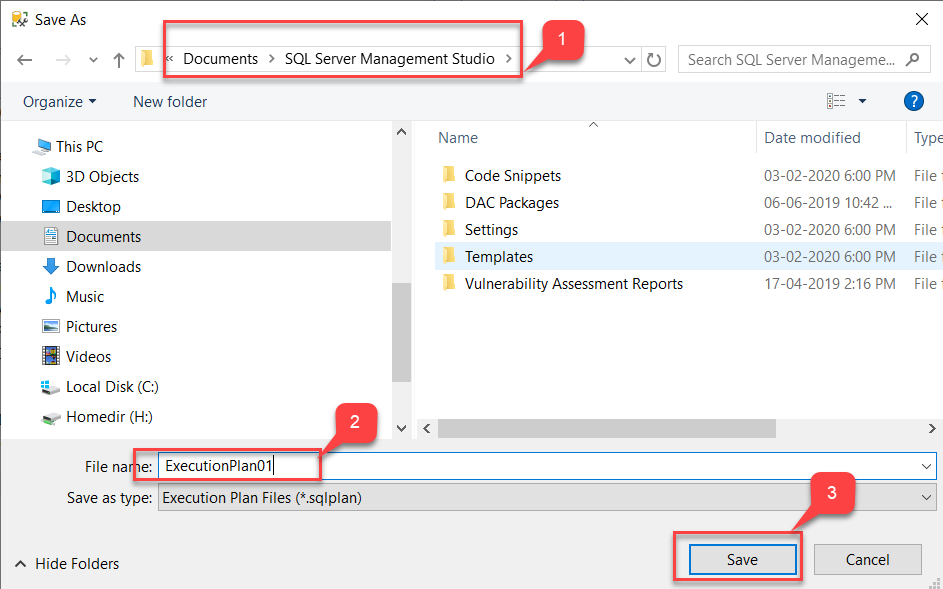
Figure 9 – Saving the Plan in SQL Server Management Studio
图9 –在SQL Server Management Studio中保存计划
You can open this plan as and when required.
您可以根据需要打开此计划。
结论 (Conclusion)
In this article, we have learned what execution plans in SQL Server are and how to generate one. We also walked through various metrics that are being considered in the operators used in the plan. Finally, we have seen how to save an execution plan in SQL Server Management Studio to the file system and use it for future references.
在本文中,我们了解了SQL Server中的执行计划以及如何生成执行计划。 我们还介绍了计划中使用的运营商正在考虑的各种指标。 最后,我们了解了如何将SQL Server Management Studio中的执行计划保存到文件系统中,并将其用作将来的参考。
翻译自: https://www.sqlshack.com/execution-plans-in-sql-server/
SQL Server中的执行计划相关推荐
- linux下sql查询的使用,sql-server – 如何在Linux上查看SQL Server中的执行计划
微软发布了一款名为 SQL Operations studio的新工具,它类似于SSMS,但可以在Windows,Linux,Macos上使用. 下面是它的样子截图 使用sqlopsstudio查看实 ...
- SQL Server 中的执行计划和SQL Server Profiler
显示估计的执行计划 包括实际的执行计划 包括客户端统计信息 SQL Server Profiler
- SQL server 系统优化--通过执行计划优化索引(1) (转)
SQL server 系统优化--通过执行计划优化索引(1) 前几天,远离上海,到了温州,在客户的这边处理系统慢,该系统每天正常down机7次左右,在线人员一多,系统运行缓慢,严重影响业务操作,到了无 ...
- SQL Server中的执行引擎入门
简介 当查询优化器(Query Optimizer)将T-SQL语句解析后并从执行计划中选择最低消耗的执行计划后,具体的执行就会交由执行引擎(Execution Engine)来进行执行.本文旨在分类 ...
- sql server中同时执行select和update语句死锁问题
原始出处 http://oecpby.blog.51cto.com/2203338/457054 最近在项目中使用SqlServer的时候发现在高并发情况下,频繁更新和频繁查询引发死锁.通常我们知道如 ...
- CREATE VIEW SQL:在SQL Server中使用索引视图
This is the fourth article in a series of learning the CREATE VIEW SQL statement. So far, we have do ...
- SQL Server中SQL Union vs Union All
This article explains to the SQL Union and vs Union All operators in SQL Server. We will also explor ...
- 人脸特征值能存放在sql server中吗_SQL运行内幕:从执行原理看调优的本质
原文链接:https://www.cnblogs.com/arthinking/p/13205303.html 相信大家看过无数的MySQL调优经验贴了,会告诉你各种调优手段,如: 避免 select ...
- SQL Server中并行执行计划的基础
In this article, we will learn the basics of Parallel Execution Plans, and we will also figure out h ...
最新文章
- Mysql进阶(3)——读写分离(mysql-proxy)
- 学习Windows2008——设计活动目录
- Java删除list
- java判断float相等_在java中判断两个浮点型(float)数据是否相等的案例
- Qt实现桌面右下角放置窗体
- linux服务器上svn的log_SVN如何查看修改的文件记录
- Python3 正则表达式学习
- 【转】c语言静态变量和静态函数
- Linux查看Tomcat版本信息
- 《单片机原理与接口技术》期中测评
- OSEK network management
- Qt编写可视化大屏电子看板系统32-模块10大屏地图
- Xshell7绿色版使用公钥对免密连接虚拟机(centos7.9-保姆级)
- deflate php,我可以告诉mod_deflate和PHP只跳过一个目录上的压缩吗?
- 【数据库】 - postgresql数据库执行计划
- 新一代三维GIS技术体系再升维
- There is no getter for property named ‘distinct‘ in ‘class tk.mybatis.mapper
- 反编译插件jad和jd-jui
- 【个人研究】21世纪西方运用脑电(EEG)的音乐研究动向分析(二)
- 研究方向三选一选择FPGA/计算机视觉/故障检测