使用蒙特卡洛模拟进行var计算
财务和投资组合风险管理中的VaR? (VaR in Financial and Portfolio Risk Management?)
VaR is an acronym of ‘Value at Risk’, and is a tool which is used by many firms and banks to establish the level of financial risk within its firm. The VaR is calculated for an investments of a company’s investments or perhaps for checking the riks levels of a portfolio managed by the wealth management branch of a bank or a boutique firm.
VaR是“风险价值”的缩写,是许多公司和银行用来确定公司内部金融风险水平的工具。 VaR的计算是针对公司投资的投资,或者是为了检查由银行或精品公司的财富管理分支机构管理的投资组合的风险水平。
The calculation may be thought of as a statistical measure in isolation. It can also be simplified to the following example statement -
可以将该计算孤立地视为统计量度。 也可以将其简化为以下示例语句-
VaR is the minimum loss which will be incurred at a certain level of probability (confidence interval) OR the maximum loss which will be realized at a level of probability.
VaR是在一定概率水平(置信区间)下发生的最小损失,或在概率水平下实现的最大损失。
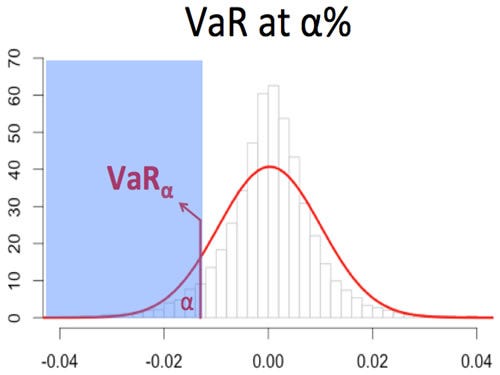
The above image shows the maximum loss which can be faced by a company at a α% confidence. On a personal level VaR can help you predict or analyse the maximum losses which your portfolio is likely to face — this is something which we will analyse soon.
上图显示了公司在α %置信度下可能面临的最大损失。 从个人角度而言,VaR可以帮助您预测或分析您的投资组合可能面临的最大损失-我们将尽快对此进行分析。
蒙特卡洛模拟 (Monte Carlo Simulations)
The Monte Carlo model was the brainchild of Stanislaw Ulam and John Neumann, who developed the model after the second world war. The model is named after a gambling city in Monaco, due to the chance and random encounters faced in gambling.
蒙特卡洛模型是斯坦尼斯拉夫·乌兰(Stanislaw Ulam)和约翰·诺伊曼(John Neumann)的创意,他们在第二次世界大战后开发了该模型。 该模型因在摩纳哥的一个赌博城市而得名,这是由于赌博中的机会和随机遭遇。
The Monte Carlo simulation is a probability model which generates random variables used in tandem with economic factors (expected return, volatility — in the case of a portfolio of funds) to predict outcomes over a large spectrum. While not the most accurate, the model is often used to calculate the risk and uncertainty.
蒙特卡洛模拟是一个概率模型,该模型生成与经济因素(预期收益,波动率—在基金组合的情况下)串联使用的随机变量,以预测大范围的结果。 虽然不是最准确,但该模型通常用于计算风险和不确定性。
We will now use the Monte Carlo simulation to generate a set of predicted returns for our portfolio of assets which will help us to find out the VaR of our investments.
现在,我们将使用蒙特卡洛模拟为资产组合生成一组预测收益,这将有助于我们找出投资的风险价值。
用Python计算VaR (Calculating VaR in Python)
We will first set up the notebook by importing the required libraries and functions
我们将首先通过导入所需的库和函数来设置笔记本
#Importing all required libraries#Created by Sanket Karveimport matplotlib.pyplot as pltimport numpy as npimport pandas as pdimport pandas_datareader as webfrom matplotlib.ticker import FuncFormatter!pip install PyPortfolioOpt#Installing the Portfolio Optimzation Libraryfrom pypfopt.efficient_frontier import EfficientFrontierfrom pypfopt import risk_modelsfrom pypfopt import expected_returnsfrom matplotlib.ticker import FuncFormatterFor the purposes of our project, I have considered the ‘FAANG’ stocks for the last two years.
为了我们的项目目的,我考虑了过去两年的“ FAANG”库存。
tickers = ['GOOGL','FB','AAPL','NFLX','AMZN']thelen = len(tickers)price_data = []for ticker in range(thelen): prices = web.DataReader(tickers[ticker], start='2018-06-20', end = '2020-06-20', data_source='yahoo') price_data.append(prices[['Adj Close']])df_stocks = pd.concat(price_data, axis=1)df_stocks.columns=tickersdf_stocks.tail()For the next step, we will calculated the portfolio weights of each asset. I have done this by using the asset weights calculated for achieving the maximum Sharpe Ratio. I have posted the snippets of the code for the calculation below.
下一步,我们将计算每种资产的投资组合权重。 我通过使用为实现最大夏普比率而计算的资产权重来完成此任务。 我在下面发布了用于计算的代码段。
#Annualized Returnmu = expected_returns.mean_historical_return(df_stocks)#Sample Variance of PortfolioSigma = risk_models.sample_cov(df_stocks)#Max Sharpe Ratio - Tangent to the EFfrom pypfopt import objective_functions, base_optimizeref = EfficientFrontier(mu, Sigma, weight_bounds=(0,1)) #weight bounds in negative allows shorting of stockssharpe_pfolio=ef.max_sharpe() #May use add objective to ensure minimum zero weighting to individual stockssharpe_pwt=ef.clean_weights()print(sharpe_pwt)
The asset weights will be used to calculate the expected portfolio return.
资产权重将用于计算预期的投资组合收益。
#VaR Calculationticker_rx2 = []#Convert Dictionary to list of asset weights from Max Sharpe Ratio Portfoliosh_wt = list(sharpe_pwt.values())sh_wt=np.array(sh_wt)Now, we will convert the stock prices of the portfolio to a cumulative return, which may also be considered as the holding period returns (HPR)for this project.
现在,我们将把投资组合的股票价格转换为累积回报,也可以将其视为该项目的持有期回报(HPR)。
for a in range(thelen): ticker_rx = df_stocks[[tickers[a]]].pct_change() ticker_rx = (ticker_rx+1).cumprod() ticker_rx2.append(ticker_rx[[tickers[a]]])ticker_final = pd.concat(ticker_rx2,axis=1)ticker_final
#Plot graph of Cumulative/HPR of all stocksfor i, col in enumerate(ticker_final.columns): ticker_final[col].plot()plt.title('Cumulative Returns')plt.xticks(rotation=80)plt.legend(ticker_final.columns)#Saving the graph into a JPG fileplt.savefig('CR.png', bbox_inches='tight')
Now, we will pick out the latest HPR of each asset and multiply the returns with the calculated asset weights using the .dot() function.
现在,我们将挑选每种资产的最新HPR,然后使用.dot()函数将收益乘以计算出的资产权重。
#Taking Latest Values of Returnpret = []pre1 = []price =[]for x in range(thelen): pret.append(ticker_final.iloc[[-1],[x]]) price.append((df_stocks.iloc[[-1],[x]]))pre1 = pd.concat(pret,axis=1)pre1 = np.array(pre1)price = pd.concat(price,axis=1)varsigma = pre1.std()ex_rtn=pre1.dot(sh_wt)print('The weighted expected portfolio return for selected time period is'+ str(ex_rtn))#ex_rtn = (ex_rtn)**0.5-(1) #Annualizing the cumulative return (will not affect outcome)price=price.dot(sh_wt) #Calculating weighted valueprint(ex_rtn, varsigma,price)Having calculated the expected portfolio return and the volatility (standard deviation of the expected returns), we will set up and run the Monte Carlo simulation. I have used a time of 1440 (no of minutes in a day) with 10,000 simulation runs. The time-steps may be changed per requirement. I have used a 95% confidence interval.
在计算了预期投资组合收益和波动率(预期收益的标准偏差)之后,我们将建立并运行蒙特卡洛模拟。 我使用1440次(一天中没有分钟)的时间进行10,000次模拟运行。 时间步长可以根据要求进行更改。 我使用了95%的置信区间。
from scipy.stats import normimport mathTime=1440 #No of days(steps or trading days in this case)lt_price=[]final_res=[]for i in range(10000): #10000 runs of simulation daily_return= (np.random.normal(ex_rtn/Time,varsigma/math.sqrt(Time),Time)) plt.plot(daily_returns)plt.axhline(np.percentile(daily_returns,5), color='r', linestyle='dashed', linewidth=1)plt.axhline(np.percentile(daily_returns,95), color='g', linestyle='dashed', linewidth=1)plt.axhline(np.mean(daily_returns), color='b', linestyle='solid', linewidth=1)plt.show()
Visualizing the distribution plot of the returns presents us with the following chart
可视化收益分布图可以为我们提供以下图表
plt.hist(daily_returns,bins=15)plt.axvline(np.percentile(daily_returns,5), color='r', linestyle='dashed', linewidth=2)plt.axvline(np.percentile(daily_returns,95), color='r', linestyle='dashed', linewidth=2)plt.show()
Printing the exact values at both the upper limit and lower limit and assuming our portfolio value to be $1000, we will calculated an estimate of the amount of funds which should be kept to cover for our minimum losses.
打印上限和下限的确切值,并假设我们的投资组合价值为$ 1000,我们将计算出应保留的资金估计额,以弥补我们的最低损失。
print(np.percentile(daily_returns,5),np.percentile(daily_returns,95)) #VaR - Minimum loss of 5.7% at a 5% probability, also a gain can be higher than 15% with a 5 % probabilitypvalue = 1000 #portfolio valueprint('$Amount required to cover minimum losses for one day is ' + str(pvalue* - np.percentile(daily_returns,5)))
The resulting amount will signify the dollar amount required to cover your losses per day. The result can also be interpreted as the minimum losses that your portfolio will face with a 5% probability.
所得金额将表示每天弥补您的损失所需的美元金额。 结果也可以解释为您的投资组合将以5%的概率面临的最小损失。
结论 (Conclusion)
The method above has shown how we can calculate the Value at Risk (VaR) for our portfolio. For a refresher on calculating a portfolio for a certain amount of investment using the Modern Portfolio Thoery (MPT), will help to consolidate your understanding of portfolio analysis and optimization. Finally, the VaR, in tandem with Monte Carlo simulation model, may also be used to predict losses and gains via share prices. This can be done by multiplying the daily return values generated with the final price of the respective ticker.
上面的方法说明了我们如何计算投资组合的风险价值(VaR)。 对于使用现代投资组合花絮(MPT)计算一定数量投资的投资组合的复习,将有助于巩固您对投资组合分析和优化的理解。 最后,VaR与蒙特卡洛模拟模型相结合,还可用于通过股价预测损失和收益。 这可以通过将产生的每日回报值乘以相应股票的最终价格来完成。
All views expressed are my own. This article is not to be treated as expert investment advise.
所表达的所有观点均为我自己的观点。 本文不应被视为专家投资建议。
Feel free to reach out to me on LinkedIn | Twitter and drop me a message
随意接触到我的 LinkedIn | Twitter ,给我留言
翻译自: https://towardsdatascience.com/var-calculation-using-monte-carlo-simulations-40b2bb417a67
http://www.taodudu.cc/news/show-3446077.html
相关文章:
- 量化投资传统指标投资决策VS蒙特卡洛模拟法
- python 蒙特卡洛模拟股价_12 Python总结之蒙特卡洛模拟
- 基于拟蒙特卡洛模拟法的随机潮流计算matlab程序
- 用计算机怎么做蒙特卡洛模拟,一篇文章讲明白蒙特卡洛模拟
- 配电网可靠性评估(二)—序贯蒙特卡洛模拟法的matlab实现
- (四十四)蒙特卡洛模拟法计算VaR
- 蒙特卡洛法简介
- Android全球开发者大会参后感
- 杏园
- 计算机图行学有很多应用 下列直接的应用是,计算机图形学(计算机合成图像)有很多应用,以下所列中最直接的应用是...
- Matlab-结构数组
- 前端面试题讲解(THIS、构造函数、面向对象、堆栈内存以及闭包)
- [Scala基础]-- 伴生类和伴生对象
- 贝索斯 每年 信_杰夫·贝索斯(Jeff Bezos)的《非常寒冷的星期六晚上》例行节目
- 婚宴座位图html5,婚宴主桌一般谁坐?婚宴座位怎么安排?
- 2019数据技术嘉年华饕餮盛宴“菜单”新鲜出炉,只等你来!
- exchange怎么改签名_如何在Microsoft Exchange上分析电子邮件签名和免责声明中的链接点击
- 第一次面试--北软视频面试记录
- CAD2018启动没有响应
- AutoCAD 日照分析
- CAD中的各种Polyline
- qq android 切换账号数据管理,qq切换账号怎么切换
- 揭秘8大自媒体平台注册方法,通过率百分之九十
- 微信硬件平台的基础接入和硬件云标准接入分析
- 如何在实验楼云平台上做Oracle踢用户进程实验
- 手机开发平台FAQ
- java版spring cloud+spring boot 社交电子商务平台(二)Eureka(服务注册和服务发现基础篇)
- 基于JavaEE(JSP)的共享资料平台的设计与实现
- (九)Java版Spring Cloud B2B2C o2o鸿鹄云商平台--平台管理通用设置
- 物联网架构演进和微信智能设备平台开发
使用蒙特卡洛模拟进行var计算相关推荐
- python实现var模型_copula函数及其Var计算的Python实现
Copula函数思想 Copula函数能够把随机变量之间的相关关系与变量的边际分布分开进行研究,这种思想方法在多元统计分析中非常重要.直观来看,可以将任意维的联合分布H(x1,...,xn)=P(X1 ...
- python函数var是求什么_copula函数及其Var计算的Python实现
Copula函数思想 Copula函数能够把随机变量之间的相关关系与变量的边际分布分开进行研究,这种思想方法在多元统计分析中非常重要.直观来看,可以将任意维的联合分布H(x1,...,xn)=P(X1 ...
- 风险定量分析工具 龙卷风图 决策树形图 蒙特卡洛模拟
龙卷风图:是项目管理中用于在风险识别和定性分析之后,进行定量风险分析的技术----敏感性分析技术中最常用的一种图表技术. 敏感性分析:敏感性分析有助于确定哪些风险对项目具有最大的潜在影响.它把所有其他 ...
- 数学建模 --- 蒙特卡洛模拟使用的一些函数
简单思想 蒙特卡洛模拟是在计算机上模拟项目实施了成千上万次,每次输入都随机选择输入值.由于每个输入很多时候本身就是一个估计区间,因此计算机模型会随机选取每个输入的该区间内的任意值,通过大量成千上万甚至 ...
- 蒙特卡洛模拟计算风险价值VAR之R语言实现
一.解析VAR 当在分析方法中计算风险价值(VAR)时,我们需要假设金融工具的返回遵循一定的概率分布.最常用的是正态分布,这也是为什么我们通常称它为delta normal方法.要计算VAR,我们需要 ...
- 【FinE】在险价值(VaR)计算
导航 VaR模型 案例:AAPL 历史模拟法 参数模型分析法 非参数bootstrap Monte-Carlo模拟计算 参考资料 VaR模型 在险价值Value-at-risk的定义为,在一定时期Δt ...
- Python使用GARCH,EGARCH,GJR-GARCH模型和蒙特卡洛模拟进行股价预测
全文下载链接:http://tecdat.cn/?p=20678 在本文中,预测股价已经受到了投资者,政府,企业和学者广泛的关注.然而,数据的非线性和非平稳性使得开发预测模型成为一项复杂而具有挑战性的 ...
- matlab腔内光子寿命,mcFORnp matlab环境下,利用蒙特卡洛模拟光子包在生物组织内的光路传输 271万源代码下载- www.pudn.com...
文件名称: mcFORnp下载 收藏√ [ 5 4 3 2 1 ] 开发工具: matlab 文件大小: 215 KB 上传时间: 2014-12-29 下载次数: 8 提 供 者: 徐某 ...
- 评估数据源是否回溯_IAI Trade:蒙特卡洛模拟在回溯检验中的应用
IAI Trade致力于降低量化交易门槛,在IAI Trade用户可以使用"可视化策略生成器"0代码生成EA策略,并一键接通模拟交易及真实交易. 蒙特卡洛模拟和回溯检验 考虑一个随 ...
最新文章
- poj 3662 Telephone Lines spfa算法灵活运用
- poj 1681 Painter#39;s Problem(高斯消元)
- MapReduce_wordcount
- android动态监听事件,Android-常见的事件监听
- 测试综合技能的期末预测
- 日报管理系统_好车日报:通用电动车无线电池管理系统;8月皮卡增长39.8%
- tar、tar.gz、tar.Z、tgz、bz2、bin软件包的安装
- 联邦学习在视觉领域的应用,揭秘AI人工智能创新应用奖获奖案例
- 非Json字符串转map对象
- Shader Graph 护盾
- Linux: 软件包管理工具 yum/dnf 命令(Fedora/CentOS/RedHat)
- STM32精英板连接wifi,通过指令控制继电器
- Dynamic Movement Primitives与UR5机械臂仿真
- 【愚公系列】2022年12月 使用win11系统自带SSH,远程控制VMware中Windows虚拟机系统
- 【THUSC2017】【LOJ2977】巧克力 斯坦纳树
- 中间人攻击劫持cookie
- 基于逐维反向学习的动态适应布谷鸟算法
- 适合程序员表白的情话【保你脱单】
- 华硕F80S安装并激活Windows7体验
- [玩机技巧] 不用root,彻底删除华为预装软件的方法
热门文章
- VSTS UnitTest
- 【计算机视觉 | 目标检测】arxiv 计算机视觉关于目标检测的学术速递(6月 23 日论文合集)
- CutPaste:Self-Supervised Learning for Anomaly Detection and Localization 论文解读(缺陷检测)
- 今年第一季度中国智能手机市场:OPPO排名榜首
- 云计算机技术应用专业实训室建设,云桌面技术在高校实训室建设中的应用
- jQuery(三)HTML
- 中南大学电子信息 单片机_沙漠老师讲专业系列三:电子信息类相关专业解读(2)...
- java日历程序设计
- Redis-22Redis-集群管理
- php将周转为对应的日期,周转时间计算