mongostat详解
mongostat是mongdb自带的状态检测工具,在命令行下使用。它会间隔固定时间获取mongodb的当前运行状态,并输出。如果你发现数据库突然变慢或者有其他问题的话,你第一手的操作就考虑采用mongostat来查看mongo的状态。
它的输出有以下几列:
- inserts/s 每秒插入次数
- query/s 每秒查询次数
- update/s 每秒更新次数
- delete/s 每秒删除次数
- getmore/s 每秒执行getmore次数
- command/s 每秒的命令数,比以上插入、查找、更新、删除的综合还多,还统计了别的命令
- flushs/s 每秒执行fsync将数据写入硬盘的次数。
- mapped/s 所有的被mmap的数据量,单位是MB,
- vsize 虚拟内存使用量,单位MB
- res 物理内存使用量,单位MB
- faults/s 每秒访问失败数(只有Linux有),数据被交换出物理内存,放到swap。不要超过100,否则就是机器内存太小,造成频繁swap写入。此时要升级内存或者扩展
- locked % 被锁的时间百分比,尽量控制在50%以下吧
- idx miss % 索引不命中所占百分比。如果太高的话就要考虑索引是不是少了
- q t|r|w 当Mongodb接收到太多的命令而数据库被锁住无法执行完成,它会将命令加入队列。这一栏显示了总共、读、写3个队列的长度,都为0的话表示mongo毫无压力。高并发时,一般队列值会升高。
- conn 当前连接数
- time 时间戳
使用profiler
 类似于MySQL的slow log, MongoDB可以监控所有慢的以及不慢的查询。
Profiler默认是关闭的,你可以选择全部开启,或者有慢查询的时候开启。
1
|
> use test
|
2
|
switched to db test
|
3
|
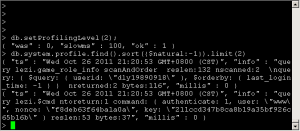
> db.setProfilingLevel(2);
|
4
|
{"was" : 0 , "slowms" : 100, "ok" : 1} // "was" is the old setting
|
5
|
> db.getProfilingLevel()
|
6
|
2
|
查看Profile日志
1
|
> db.system.profile.find().sort({$natural:-1})
|
2
|
{"ts" : "Thu Jan 29 2009 15:19:32 GMT-0500 (EST)" , "info" :
|
3
|
"query test.$cmd ntoreturn:1 reslen:66 nscanned:0 query: { profile: 2 } nreturned:1 bytes:50" ,
|
4
|
"millis" : 0} ...
|
3个字段的意义
- ts:时间戳
- info:具体的操作
- millis:操作所花时间,毫秒
不多说,此处有官方文档。注意,造成满查询可能是索引的问题,也可能是数据不在内存造成因此磁盘读入造成。
使用Web控制台
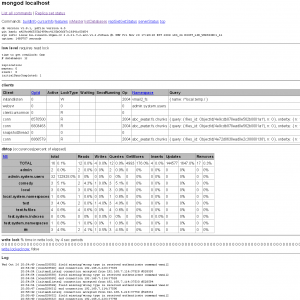 Mongodb自带了Web控制台,默认和数据服务一同开启。他的端口在Mongodb数据库服务器端口的基础上加1000,如果是默认的Mongodb数据服务端口(Which is 27017),则相应的Web端口为28017
这个页面可以看到
- 当前Mongodb的所有连接
- 各个数据库和Collection的访问统计,包括:Reads, Writes, Queries, GetMores ,Inserts, Updates, Removes
- 写锁的状态
- 以及日志文件的最后几百行(CentOS+10gen yum 安装的mongodb默认的日志文件位于/var/log/mongo/mongod.log)
可以参考右边的截图
db.stat()
获取当前数据库的信息,比如Obj总数、数据库总大小、平均Obj大小等
01
|
> use test
|
02
|
switched to db test
|
03
|
> db.stats()
|
04
|
{
|
05
|
"collections" : 9,
|
06
|
"objects" : 4278845,
|
07
|
"avgObjSize" : 224.56603031892953,
|
08
|
"dataSize" : 960883236,
|
09
|
"storageSize" : 1195438080,
|
10
|
"numExtents" : 59,
|
11
|
"indexes" : 13,
|
12
|
"indexSize" : 801931264,
|
13
|
"fileSize" : 6373244928,
|
14
|
"ok" : 1
|
15
|
}
|
db.serverStatus()
获取服务器的状态
01
|
{
|
02
|
"version" : "1.6.5",
|
03
|
"uptime" : 7208469,
|
04
|
"uptimeEstimate" : 7138829,
|
05
|
"localTime" : "Wed Oct 26 2011 22:23:07 GMT+0800 (CST)",
|
06
|
"globalLock" : {
|
07
|
"totalTime" : 7208469556704,
|
08
|
"lockTime" : 4959693717,
|
09
|
"ratio" : 0.000688036992871448,
|
10
|
"currentQueue" : {
|
11
|
"total" : 0,
|
12
|
"readers" : 0,
|
13
|
"writers" : 0
|
14
|
}
|
15
|
},
|
16
|
"mem" : {
|
17
|
"bits" : 64,
|
18
|
"resident" : 3131,
|
19
|
"virtual" : 6172,
|
20
|
"supported" : true,
|
21
|
"mapped" : 4927
|
22
|
},
|
23
|
"connections" : {
|
24
|
"current" : 402,
|
25
|
"available" : 2599
|
26
|
},
|
27
|
"extra_info" : {
|
28
|
"note" : "fields vary by platform",
|
29
|
"heap_usage_bytes" : 832531920,
|
30
|
"page_faults" : 8757
|
31
|
},
|
32
|
"indexCounters" : {
|
33
|
"btree" : {
|
34
|
"accesses" : 2821726,
|
35
|
"hits" : 2821725,
|
36
|
"misses" : 1,
|
37
|
"resets" : 0,
|
38
|
"missRatio" : 3.543930204420982e-7
|
39
|
}
|
40
|
},
|
41
|
"backgroundFlushing" : {
|
42
|
"flushes" : 120133,
|
43
|
"total_ms" : 73235923,
|
44
|
"average_ms" : 609.6236920746173,
|
45
|
"last_ms" : 1332,
|
46
|
"last_finished" : "Wed Oct 26 2011 22:22:23 GMT+0800 (CST)"
|
47
|
},
|
48
|
"cursors" : {
|
49
|
"totalOpen" : 0,
|
50
|
"clientCursors_size" : 0,
|
51
|
"timedOut" : 238392
|
52
|
},
|
53
|
"repl" : {
|
54
|
"ismaster" : true
|
55
|
},
|
56
|
"opcounters" : {
|
57
|
"insert" : 269351,
|
58
|
"query" : 19331151,
|
59
|
"update" : 14199331,
|
60
|
"delete" : 1,
|
61
|
"getmore" : 145575,
|
62
|
"command" : 55982302
|
63
|
},
|
64
|
"asserts" : {
|
65
|
"regular" : 0,
|
66
|
"warning" : 0,
|
67
|
"msg" : 0,
|
68
|
"user" : 27,
|
69
|
"rollovers" : 0
|
70
|
},
|
71
|
"ok" : 1
|
72
|
}
|
需要关心的地方:
- connections 当前连接和可用连接数,听过一个同行介绍过,mongodb最大处理到2000个连接就不行了(要根据你的机器性能和业务来设定),所以设大了没意义。设个合理值的话,到达这个值mongodb就拒绝新的连接请求,避免被太多的连接拖垮。
- indexCounters:btree:misses 索引的不命中数,和hits的比例高就要考虑索引是否正确建立。你看我的”missRatio” : 3.543930204420982e-7,很健康吧。所以miss率在mongostat里面也可以看
- 其他的都能自解释,也不是查看mongo健康状况的关键,就不说明了。
db.currentOp()
Mongodb 的命令一般很快就完成,但是在一台繁忙的机器或者有比较慢的命令时,你可以通过db.currentOp()获取当前正在执行的操作。
在没有负载的机器上,该命令基本上都是返回空的
1
|
> db.currentOp()
|
2
|
{ "inprog" : [ ] }
|
以下是一个有负载的机器上得到的返回值样例:
1
|
{ "opid" : "shard3:466404288", "active" : false, "waitingForLock" : false, "op": "query", "ns" : "sd.usersEmails", "query" : { }, "client_s" :"10.121.13.8:34473", "desc" : "conn" },
|
字段名字都能自解释。如果你发现一个操作太长,把数据库卡死的话,可以用这个命令杀死他
1
|
> db.killOp("shard3:466404288")
|
MongoDB Monitoring Service
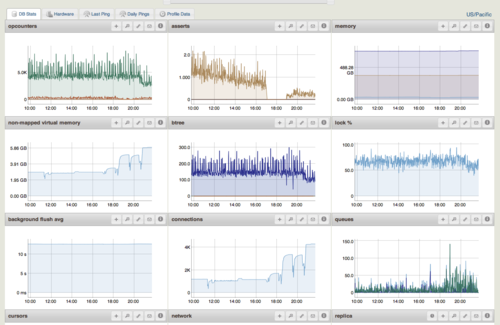
MongoDB Monitoring Service(MMS)是Mongodb厂商提供的监控服务,可以在网页和Android客户端上监控你的MongoDB状况。
insert: 一秒内的插入数
query : 一秒内的查询数
update: 一秒内的更新数
delete: 一秒内的删除数
getmore: 查询时游标(cursor)的getmore操作
command: 一秒内执行的命令数
flushes: 一秒内flush的次数 一般都是0,或者1,通过计算两个1之间的间隔时间,可以大致了解多长时间flush一次。flush开销是很大的,如果频繁的flush,可能就要找找原因了。
mapped:vsize: res: 这三个和用top看到的一样,mapped, vsize一般不会有大的变动, res会慢慢的上升,如果res经常突然下降,去查查是否有别的程序狂吃内存。
faults:大压力下这个数值往往不为0。如果经常不为0,那就该加内存了。
locked: MongoDB就一把读写锁,这里指的是写锁所住的时间百分比。这个数值过大(经常超过10%),那就是出状况了。
dx miss:非常重要的参数, 正常情况下,所有的查询都应该通过索引,也就是idx miss为0。如果这里数值较大,是不是缺少索引。
qr|qw: queue lengths for clients waiting (read|write)
ar|aw: active clients (read|write)
如果这两个数值很大,那么就是DB被堵住了,DB的处理速度不及请求速度。看看是否有开销很大的慢查询。如果查询一切正常,确实是负载很大,就需要加机器了。
netIn: network traffic in - bits
netOut: network traffic out - bits
网络带宽压力
conn: MongoDB为每一个连接创建一个线程,线程的创建和释放也是有开销的。尽量不要让这个数值很大。
repl: 服务器当前状态
M - master
SEC - secondary
REC - recovering
UNK - unknown
SLV - slave
time: 当前时间
在Linux平台下,无论是64位或者32位的MongoDB默认最大连接数都是819,WIN平台不知道,估计也没有人在 WIN平台下使用MongoDB做生产环境
[ root@DELL113 mongodb-linux-i686-2.4.1 ] # mongo admin -u root -p password
MongoDB shell version: 2.4.1
connecting to: 192.168.6.42/admin
> db.serverStatus().connections
{ "current" : 1, "available" : 818, "totalCreated" : NumberLong(1) }
途中available显示818少了一个,表示空闲的。current表示已经占用了的连接数,两数一加就等于819,如果我现在在连接一个,那么available就是817,current就是2
[root@bkjia mongodb-linux-i686-2.4.1] # ./bin/mongo 192.168.6.42
MongoDB shell version: 2.4.1
connecting to: 192.168.6.42/test
> db.serverStatus().connections
{ " current " : 1, " available " : 818, " totalCreated " : NumberLong(1) }
> db.serverStatus().connections
{ " current " : 2, " available " : 817, " totalCreated " : NumberLong(2) }
819个连接数对于一般的站点我认为已经够用,并且都是现连现取现断。但这个连接数也可以修改,只要在启动的时候加入--maxConns即可
服务器启动
[root@lee mongodb-linux-x86_64-2.4.1] # ./bin/mongod --dbpath=/root/db --maxConns=2000
Wed Apr 3 11:06:21.905 [initandlisten] MongoDB starting : pid=2812 port=27017 dbpath=/root/db 64-bit host=lee
Wed Apr 3 11:06:21.957 [initandlisten] db version v2.4.1
Wed Apr 3 11:06:21.957 [initandlisten] git version: 1560959e9ce11a693be8b4d0d160d633eee75110
Wed Apr 3 11:06:21.957 [initandlisten] build info: Linux ip-10-2-29-40 2.6.21.7-2.ec2.v1.2.fc8xen # 1 SMP Fri Nov 20 17:48:28 EST 2009 x86_64 BOOST_LIB_VERSION=1_49
Wed Apr 3 11:06:21.957 [initandlisten] allocator: tcmalloc
Wed Apr 3 11:06:21.957 [initandlisten] options: { dbpath: " /root/db " , maxConns: 2000 }
Wed Apr 3 11:06:21.982 [initandlisten] journal dir=/root/db/journal
Wed Apr 3 11:06:21.982 [initandlisten] recover : no journal files present, no recovery needed
Wed Apr 3 11:06:22.297 [initandlisten] preallocateIsFaster=true 2.62
Wed Apr 3 11:06:22.717 [initandlisten] --maxConns too high, can only handle 819
Wed Apr 3 11:06:22.724 [initandlisten] waiting for connections on port 27017
Wed Apr 3 11:06:22.725 [websvr] admin web console waiting for connections on port 28017
Wed Apr 3 11:06:25.126 [initandlisten] connection accepted from 192.168.4.86:53917 # 1 (1 connection now open)
查询最大连接数
[root@bkjia mongodb-linux-i686-2.4.1] # ./bin/mongo 192.168.6.42
MongoDB shell version: 2.4.1
connecting to: 192.168.6.42/test
> db.serverStatus().connections
{ " current " : 1, " available " : 818, " totalCreated " : NumberLong(1) }
>
发现还是819?其实是Linux默认进程能打开最大文件数有关,可以通过ulimit 解决
[root@lee mongodb-linux-x86_64-2.4.1] # ulimit -n 2500
[root@lee mongodb-linux-x86_64-2.4.1] # ./bin/mongod --dbpath=/root/db --maxConns=2000
Wed Apr 3 11:11:07.013 [initandlisten] MongoDB starting : pid=2930 port=27017 dbpath=/root/db 64-bit host=lee
Wed Apr 3 11:11:07.013 [initandlisten] db version v2.4.1
Wed Apr 3 11:11:07.013 [initandlisten] git version: 1560959e9ce11a693be8b4d0d160d633eee75110
Wed Apr 3 11:11:07.013 [initandlisten] build info: Linux ip-10-2-29-40 2.6.21.7-2.ec2.v1.2.fc8xen # 1 SMP Fri Nov 20 17:48:28 EST 2009 x86_64 BOOST_LIB_VERSION=1_49
Wed Apr 3 11:11:07.013 [initandlisten] allocator: tcmalloc
Wed Apr 3 11:11:07.013 [initandlisten] options: { dbpath: " /root/db " , maxConns: 2000 }
Wed Apr 3 11:11:07.031 [initandlisten] journal dir=/root/db/journal
Wed Apr 3 11:11:07.031 [initandlisten] recover : no journal files present, no recovery needed
Wed Apr 3 11:11:07.170 [initandlisten] waiting for connections on port 27017
Wed Apr 3 11:11:07.171 [websvr] admin web console waiting for connections on port 28017
Wed Apr 3 11:11:10.076 [initandlisten] connection accepted from 192.168.4.86:53161 # 1 (1 connection now open)
再查看最大连接数,搞定
[root@bkjia mongodb-linux-i686-2.4.1] # ./bin/mongo 192.168.6.42
MongoDB shell version: 2.4.1
connecting to: 192.168.6.42/test
> db.serverStatus().connections
{ " current " : 1, " available " : 1999, " totalCreated " : NumberLong(1) }
>
关于ulimit的更多知识大家可以去网上检索检索
客户端程序通常是通过DRIVER来��接,由于每次建立链接的成本都挺高,因此都用链接池来实现,SPRING DATA MONGODB中是如下配置
mongo.dbname=cms
# 线程池的大小
mongo.connectionsPerHost=100
# 这个*mongo.connectionsPerHost则是如果链接数大于100的等待xttk数
mongo.threadsAllowedToBlockForConnectionMultiplier=4
# 等待线程的等待时间
mongo.maxWaitTime=1500
mongo.socketTimeout=1500
mongo.connectTimeout=1000
mongo.autoConnectRetry=true
mongo.socketKeepAlive=true
mongo.slaveOk=true
autoConnectRetry simply means the driver will automatically attempt to reconnect to the server(s) after unexpected disconnects. In production environments you usually want this set to true.
connectionsPerHost are the amount of physical connections a single Mongo instance (it's singleton so you usually have one per application) can establish to a mongod/mongos process. At time of writing the java driver will establish this amount of connections eventually even if the actual query throughput is low (in order words you will see the "conn" statistic in mongostat rise until it hits this number per app server).
There is no need to set this higher than 100 in most cases but this setting is one of those "test it and see" things. Do note that you will have to make sure you set this low enough so that the total amount of connections to your server do not exceed
db.serverStatus().connections.availableIn production we currently have this at 40.
connectTimeout. As the name suggest number of milliseconds the driver will wait before a connection attempt is aborted. Set timeout to something long (15-30 seconds) unless there's a realistic, expected chance this will be in the way of otherwise succesful connection attempts. Normally if a connection attempt takes longer than a couple of seconds your network infrastructure isn't capable of high throughput.
maxWaitTime. Number of ms a thread will wait for a connection to become available on the connection pool, and raises an exception if this does not happen in time. Keep default.
socketTimeout. Standard socket timeout value. Set to 60 seconds (60000).
threadsAllowedToBlockForConnectionMultiplier. Multiplier for connectionsPerHost that denotes the number of threads that are allowed to wait for connections to become available if the pool is currently exhausted. This is the setting that will cause the "com.mongodb.DBPortPool$SemaphoresOut: Out of semaphores to get db connection" exception. It will throw this exception once this thread queue exceeds the threadsAllowedToBlockForConnectionMultiplier value. For example, if the connectionsPerHost is 10 and this value is 5 up to 50 threads can block before the aforementioned exception is thrown.
If you expect big peaks in throughput that could cause large queues temporarily increase this value. We have it at 1500 at the moment for exactly that reason. If your query load consistently outpaces the server you should just improve your hardware/scaling situation accordingly.
readPreference. (UPDATED, 2.8+) Used to determine the default read preference and replaces "slaveOk". Set up a ReadPreference through one of the class factory method. A full description of the most common settings can be found at the end of this post
w. (UPDATED, 2.6+) This value determines the "safety" of the write. When this value is -1 the write will not report any errors regardless of network or database errors. WriteConcern.NONE is the appropriate predefined WriteConcern for this. If w is 0 then network errors will make the write fail but mongo errors will not. This is typically referred to as "fire and forget" writes and should be used when performance is more important than consistency and durability. Use WriteConcern.NORMAL for this mode.
If you set w to 1 or higher the write is considered safe. Safe writes perform the write and follow it up by a request to the server to make sure the write succeeded or retrieve an error value if it did not (in other words, it sends a getLastError() command after you write). Note that until this getLastError() command is completed the connection is reserved. As a result of that and the additional command the throughput will be signficantly lower than writes with w <= 0. With a w value of exactly 1 MongoDB guarantees the write succeeded (or verifiably failed) on the instance you sent the write to.
In the case of replica sets you can use higher values for w whcih tell MongoDB to send the write to at least "w" members of the replica set before returning (or more accurately, wait for the replication of your write to "w" members). You can also set w to the string "majority" which tells MongoDB to perform the write to the majority of replica set members (WriteConcern.MAJORITY). Typicall you should set this to 1 unless you need raw performance (-1 or 0) or replicated writes (>1). Values higher than 1 have a considerable impact on write throughput.
fsync. Durability option that forces mongo to flush to disk after each write when enabled. I've never had any durability issues related to a write backlog so we have this on false (the default) in production.
j *(NEW 2.7+)*. Boolean that when set to true forces MongoDB to wait for a successful journaling group commit before returning. If you have journaling enabled you can enable this for additional durability. Refer to http://www.mongodb.org/display/DOCS/Journaling to see what journaling gets you (and thus why you might want to enable this flag).
ReadPreference The ReadPreference class allows you to configure to what mongod instances queries are routed if you are working with replica sets. The following options are available :
ReadPreference.primary() : All reads go to the repset primary member only. Use this if you require all queries to return consistent (the most recently written) data. This is the default.
ReadPreference.primaryPreferred() : All reads go to the repset primary member if possible but may query secondary members if the primary node is not available. As such if the primary becomes unavailable reads become eventually consistent, but only if the primary is unavailable.
ReadPreference.secondary() : All reads go to secondary repset members and the primary member is used for writes only. Use this only if you can live with eventually consistent reads. Additional repset members can be used to scale up read performance although there are limits to the amount of (voting) members a repset can have.
ReadPreference.secondaryPreferred() : All reads go to secondary repset members if any of them are available. The primary member is used exclusively for writes unless all secondary members become unavailable. Other than the fallback to the primary member for reads this is the same as ReadPreference.secondary().
ReadPreference.nearest() : Reads go to the nearest repset member available to the database client. Use only if eventually consistent reads are acceptable. The nearest member is the member with the lowest latency between the client and the various repset members. Since busy members will eventually have higher latencies this should also automatically balance read load although in my experience secondary(Preferred) seems to do so better if member latencies are relatively consistent.
Note : All of the above have tag enabled versions of the same method which return TaggableReadPreference instances instead. A full description of replica set tags can be found here :Replica Set Tags
Linux下启动mongodb(后台方式)
完成安装mongodb(略)
创建数据目录:
# mkdir /data/mongo
创建配置文件
# vi /data/mongo/mongodb.cnf
dbpath=/data/mongo/
logpath=/data/mongo/mongo.log
logappend=true
fork=true
port=27017
或者:不创建配置文件通过mongod参数启动也可以
1、配置文件方式启动mongo
# bin/mongod -f /data/mongo/mongodb.cnf
或者 # bin/mongod -f /data/mongo/mongodb.cnf & (放到后台执行)
2、参数启动mongo
bin/mongod -dbpath /data/mongo/ -logpath /data/mongo/mongo.log -logappend -fork -port 27017
终端输入出:
all output going to: /data/mongo/mongo.log
成功后即可以登录mongo
# bin/mongo
终端输入出:
MongoDB shell version: 2.2.3
connecting to: test
>
现在mongo就可以正常使用了
如果让mongo随linux自动启动,在/etc/rc.local添加如下即可:
rm /data/mongo/mongod,.lock #停止可能在运行的mongo
/.../bin/mongod -f /data/mongo/mongodb.cnf
或者
/.../bin/mongod -dbpath /data/mongo/ -logpath /data/mongo/mongo.log -logappend -fork -port 27017
附带提醒:
1、后台启动node命令: nohup node /.../app.js &
2、停止node和mongo都是用kill
3、如果出现启动报错 ERROR: child process failed, exited with error number 100,一般是由于上一次mongodb没有正常关闭,只需要rm /.../mongod.lock就好
TCP状态转移要点
TCP协议规定,对于已经建立的连接,网络双方要进行四次握手才能成功断开连接,如果缺少了其中某个步骤,将会使连接处于假死状态,连接本身占用的资源不 会被释放。网络服务器程序要同时管理大量连接,所以很有必要保证无用连接完全断开,否则大量僵死的连接会浪费许多服务器资源。在众多TCP状态中,最值得 注意的状态有两个:CLOSE_WAIT和TIME_WAIT。
1、LISTENING状态
FTP服务启动后首先处于侦听(LISTENING)状态。
ESTABLISHED的意思是 建立连接。表示两台机器正在通信。
SYN_SENT状态表示请求连接,当你要访问其它的计算机的服务时首先要发个同步信号给该端口,此时状态为SYN_SENT,如果连接成功了就变为 ESTABLISHED,此时SYN_SENT状态非常短暂。但如果发现SYN_SENT非常多且在向不同的机器发出,那你的机器可能中了冲击波或震荡波 之类的病毒了。这类病毒为了感染别的计算机,它就要扫描别的计算机,在扫描的过程中对每个要扫描的计算机都要发出了同步请求,这也是出现许多 SYN_SENT的原因。
根据TCP协议定义的3次握手断开连接规定,发起socket主动关闭的一方 socket将进入TIME_WAIT状态,TIME_WAIT状态将持续2个MSL(Max Segment Lifetime),在Windows下默认为4分钟,即240秒,TIME_WAIT状态下的socket不能被回收使用. 具体现象是对于一个处理大量短连接的服务器,如果是由服务器主动关闭客户端的连接,将导致服务器端存在大量的处于TIME_WAIT状态的socket, 甚至比处于Established状态下的socket多的多,严重影响服务器的处理能力,甚至耗尽可用的socket,停止服务. TIME_WAIT是TCP协议用以保证被重新分配的socket不会受到之前残留的延迟重发报文影响的机制,是必要的逻辑保证.
windows 机器设置
在HKEY_LOCAL_MACHINE\SYSTEM\CurrentControlSet\Services\Tcpip\Parameters,右键添加名为TcpTimedWaitDelay的
DWORD键,设置为60,以缩短TIME_WAIT的等待时间
ubuntu机器设置
编辑文件,加入以下内容:
net.ipv4.tcp_syncookies = 1

        net.ipv4.tcp_tw_reuse = 1

        net.ipv4.tcp_tw_recycle = 1

        net.ipv4.tcp_fin_timeout = 30
/sbin/sysctl -p 让参数生效。
net.ipv4.tcp_tw_reuse = 1 表示开启重用。允许将TIME-WAIT sockets重新用于新的TCP连接,默认为0,表示关闭;
net.ipv4.tcp_tw_recycle = 1 表示开启TCP连接中TIME-WAIT sockets的快速回收,默认为0,表示关闭。
net.ipv4.tcp_fin_timeout 修改系統默认的 TIMEOUT 时间
一般情况下,系统的socket资源默认5000个。(非官方)
TCP协议中有 TIME_WAIT 这个状态
主要有两个原因
1。防止上一次连接中的包,迷路后重新出现,影响新连接(经过2MSL,上一次连接中所有的重复包都会消失)
2。可靠的关闭TCP连接。在主动关闭方发送的最后一个 ack(fin) ,有可能丢失,这时被动方会重新发
fin, 如果这时主动方处于 CLOSED 状态 ,就会响应 rst 而不是 ack。所以主动方要处于 TIME_WAIT 状态,而不能是 CLOSED 。
mongostat详解相关推荐
- 从命令行到IDE,版本管理工具Git详解(远程仓库创建+命令行讲解+IDEA集成使用)
首先,Git已经并不只是GitHub,而是所有基于Git的平台,只要在你的电脑上面下载了Git,你就可以通过Git去管理"基于Git的平台"上的代码,常用的平台有GitHub.Gi ...
- JVM年轻代,老年代,永久代详解
秉承不重复造轮子的原则,查看印象笔记分享连接↓↓↓↓ 传送门:JVM年轻代,老年代,永久代详解 速读摘要 最近被问到了这个问题,解释的不是很清晰,有一些概念略微模糊,在此进行整理和记录,分享给大家.在 ...
- docker常用命令详解
docker常用命令详解 本文只记录docker命令在大部分情境下的使用,如果想了解每一个选项的细节,请参考官方文档,这里只作为自己以后的备忘记录下来. 根据自己的理解,总的来说分为以下几种: Doc ...
- 通俗易懂word2vec详解词嵌入-深度学习
https://blog.csdn.net/just_so_so_fnc/article/details/103304995 skip-gram 原理没看完 https://blog.csdn.net ...
- 深度学习优化函数详解(5)-- Nesterov accelerated gradient (NAG) 优化算法
深度学习优化函数详解系列目录 深度学习优化函数详解(0)– 线性回归问题 深度学习优化函数详解(1)– Gradient Descent 梯度下降法 深度学习优化函数详解(2)– SGD 随机梯度下降 ...
- CUDA之nvidia-smi命令详解---gpu
nvidia-smi是用来查看GPU使用情况的.我常用这个命令判断哪几块GPU空闲,但是最近的GPU使用状态让我很困惑,于是把nvidia-smi命令显示的GPU使用表中各个内容的具体含义解释一下. ...
- Bert代码详解(一)重点详细
这是bert的pytorch版本(与tensorflow一样的,这个更简单些,这个看懂了,tf也能看懂),地址:https://github.com/huggingface/pytorch-pretr ...
- CRF(条件随机场)与Viterbi(维特比)算法原理详解
摘自:https://mp.weixin.qq.com/s/GXbFxlExDtjtQe-OPwfokA https://www.cnblogs.com/zhibei/p/9391014.html C ...
- pytorch nn.LSTM()参数详解
输入数据格式: input(seq_len, batch, input_size) h0(num_layers * num_directions, batch, hidden_size) c0(num ...
最新文章
- api.533.net 文章迁移计划
- 倒排列表求交集算法汇总
- AttributeError: module ‘tensorflow‘ has no attribute ‘placeholder‘
- Python pip – error: invalid command ‘bdist_wheel’
- BitNami Redmine Stack
- java集合——具体的集合
- Qt图形界面编程入门(Qt的历史、Qt安装资源链接、Qt Creator简介)
- idal 创建springboot 项目_SpringBoot教程:Maven方式创建SpringBoot项目
- WPF仿网易云音乐系列(一、左侧菜单栏:Expander+RadioButton)
- sql脚本过大,无法打开的解决方法
- 【PAT乙】1047 编程团体赛 (20分)字符串,桶排序
- [HDU5739]Fantasia(圆方树DP)
- 【Java基础】图片压缩
- 报错解决:ninja: /lib64/libstdc++.so.6: version `GLIBCXX_3.4.20‘ not found (required by ninja)
- 简单常用的sql语句
- 第十二章 采购管理 采购合同类型以及其区别 合同类型与风险分担 自制与外购分析 招标文件 工作说明书(SOW) 工作大纲 (TOR) 投标人会议 采购谈判 检查 审计 索赔管理 采购合同争议解决方式对
- 凌恩生物明星产品:一文读懂细胞器基因组!
- 燕山大学C++实验报告
- Go语言使用百度翻译api
- 彩虹物语服务器维护,红手指彩虹物语云手机使用教程_红手指彩虹物语云挂机教程_彩虹物语息屏挂机教程_红手指云手机官网...