LaTeX - 填充图中的阴影部分
2019独角兽企业重金招聘Python工程师标准>>> 
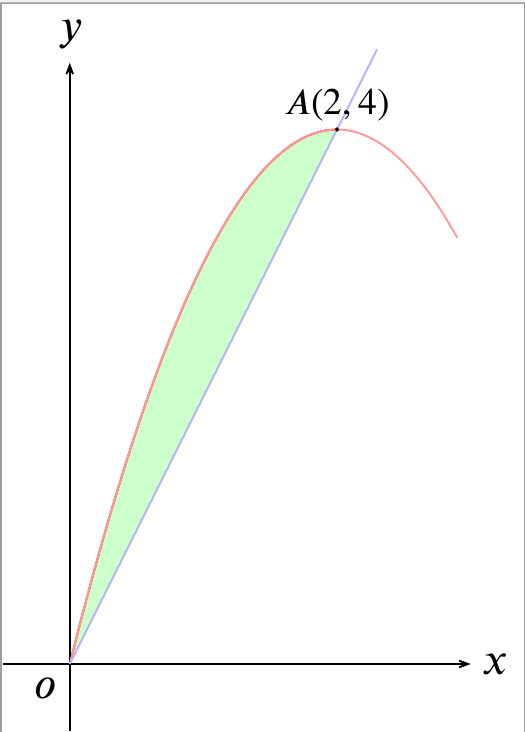
% 例1
\documentclass[10pt]{standalone}
\usepackage{tikz}
\usetikzlibrary{arrows.meta}
\usepackage{unicode-math}
\setmainfont{XITS}
\setmathfont{XITS Math}
\usepackage{scalerel} %\scaleobj{1.5}{} 缩放公式大小
\begin{document}
\begin{tikzpicture}[smooth]
\draw[arrows={-Stealth[length=5pt, inset=3.5pt]}] (-0.5,0) -- (3.0,0)node (xaxis) [right=-1pt] {$x$};
\draw[arrows={-Stealth[length=5pt, inset=3.5pt]}] (0,-0.5) -- (0,4.5)node (yaxis) [above=-0.6pt] {$y$};
\draw  (-0.18,-0.18) node {$o$};
\draw[color=red,domain=0:2.0,fill=green!20] plot (\x,4*\x-\x*\x);
\draw[color=red!40,domain=0:2.90] plot (\x,4*\x-\x*\x)  ;
\draw[color=blue!30,domain=0:2.3] plot (\x,2*\x)  ;
\draw[fill=black] (2,4) circle [radius=0.2pt] node[above=-1.8pt] {$\scaleobj{0.8}{A(2,4)}$};
\end{tikzpicture}
\end{document}
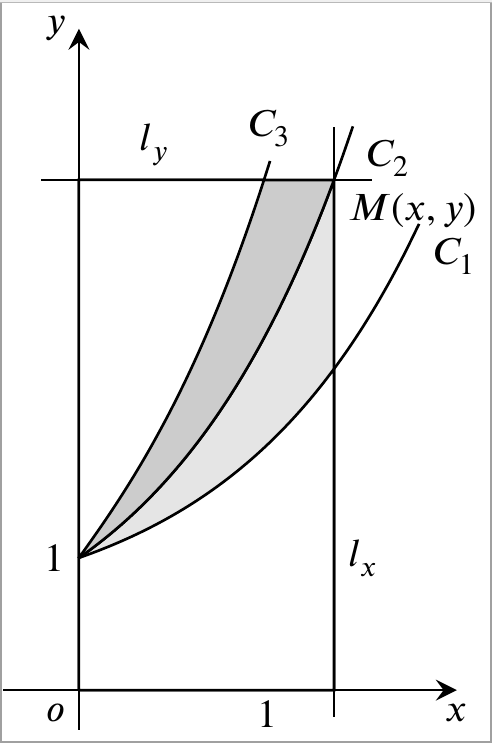
% 例2
\documentclass[10pt]{standalone}
\usepackage{tikz}
\usetikzlibrary{arrows.meta}
\usepackage{unicode-math}
\setmainfont{XITS}
\setmathfont{XITS Math}
\begin{document}
\begin{tikzpicture}[yscale=0.7]
\draw[-stealth] (-0.4,0)--(2,0) node[below,scale=0.6]{$x$};
\draw[-stealth] (0,-0.3)--(0,5) node[left,scale=0.6]{$y$};
\draw (0,0) node [below left,scale=0.6] {$o$};
\foreach \i in {1}{\draw (\i,0)--node [below,scale=0.6] {$1$}(\i,0.05);}
\draw (0,1) node [left,scale=0.6] {$1$};
\draw (1.35,1) node [right,scale=0.6] {$l_x$};
\draw (0.4,3.85742) node [above,scale=0.6] {$l_y$};
\draw (1.35,-0.2) -- (1.35,4.25519);
\draw (-0.2,3.85742) -- (1.55,3.85742);
\draw (1.35,3.85742) node [below right,scale=0.6] {$M(x,y)$};
%\clip (-1,-1) rectangle (5,5);%只在这个区域内画图
\draw[domain=1:4,smooth,variable=\t] plot ({ln(\t)+1/(2*\t)-0.5},\t)node[above,scale=0.6] {$C_3$};
\draw[domain=0:1.8,smooth] plot (\x,{0.5*1+0.5*exp(\x)}) node[below right,scale=0.6] {$C_1$};
\draw[domain=0:1.45,smooth] plot (\x,{exp(\x)}) node[below right,scale=0.6] {$C_2$};
\filldraw [fill=gray!20] (0,0) -- plot [domain=0:1.35,smooth] (\x,{exp(\x)}) -- (1.35,0) -- (0,0);
\filldraw [fill=white] (0,0) -- plot [domain=0:1.35,smooth] (\x,{0.5*1+0.5*exp(\x)}) -- (1.35,0) -- (0,0);
\filldraw [fill=gray!40] (0,1) -- plot [domain=0:1.35,smooth] (\x,{exp(\x)}) -- (0,3.85742) -- (0,1);
\filldraw [fill=white] (0,1) -- plot [domain=1:3.85742,smooth,variable=\t] ({ln(\t)+1/(2*\t)-0.5},\t) -- (0,3.85742) -- (0,1);
\end{tikzpicture}
\end{document}
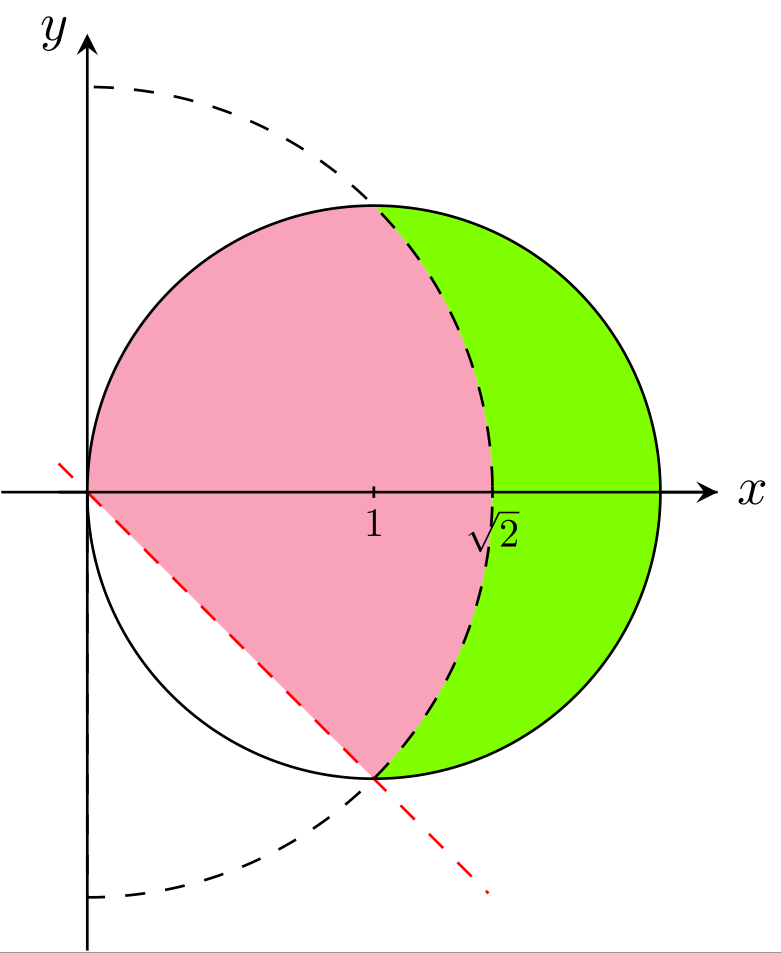
% 例3
\documentclass[tikz,border=0pt,10pt]{standalone}
\usetikzlibrary{arrows.meta}
\usetikzlibrary{patterns}
\definecolor{pink}{RGB}{249,164,186}
\definecolor{grassgreen}{RGB}{128,255,0}
\usepackage{scalerel} %\scaleobj{1.5}{} 缩放公式大小
\begin{document}
\begin{tikzpicture}[scale=1.5]
\draw[-stealth] (-0.3,0) -- (2.2,0)node (xaxis) [right,scale=0.8] {$x$};
\draw[-stealth] (0,-1.6) -- (0,1.6)node (yaxis) [left,scale=0.8] {$y$};
\fill[pink!] (0,0) -- (1,-1) arc [start angle=315, end angle=405, radius=1.414] -- (0,0);
\fill[pink!] (1,0) -- (1,1) arc [start angle=90, end angle=180, radius=1] -- (0,0);
\fill[grassgreen] (0,0) -- (1,-1) arc [start angle=315, end angle=360, radius=1.414] -- (1.414,0)--(2,0) arc [start angle=360, end angle=270, radius=1] -- (1,-1);
\fill[grassgreen] (0,0) -- (1,1) arc [start angle=45, end angle=0, radius=1.414] -- (1.414,0)--(2,0) arc [start angle=0, end angle=90, radius=1] -- (1,1);
\draw (1,-0.02)--(1,0.02) node[below] {$\scaleobj{0.6}{1}$};
\draw (1.414,-0.02)--(1.414,0.02) node[below] {$\scaleobj{0.6}{\sqrt{2}}$};
\draw[style=dashed,color=red,domain=-0.1:1.4] plot(\x,-\x);
\draw[color=black,domain=-0.1:2.2] plot(\x,0);
\draw[style=dashed] (0,0)--(0,-1.414) arc [start angle=270, end angle=450, radius=1.414];
\draw (1,0) circle [radius=1];
%\fill[pattern=north west lines](0,0)--(-2,0)--(-2,2)--(0,2)arc(90:270:0.8);
%\fill[pattern=north west lines]arc(-45:0:1);
\end{tikzpicture}
\end{document}
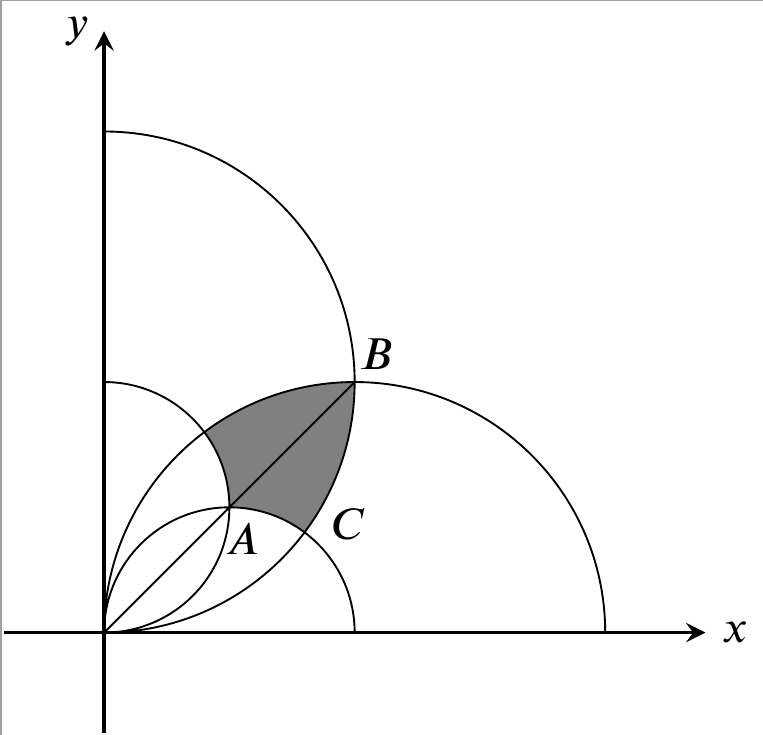
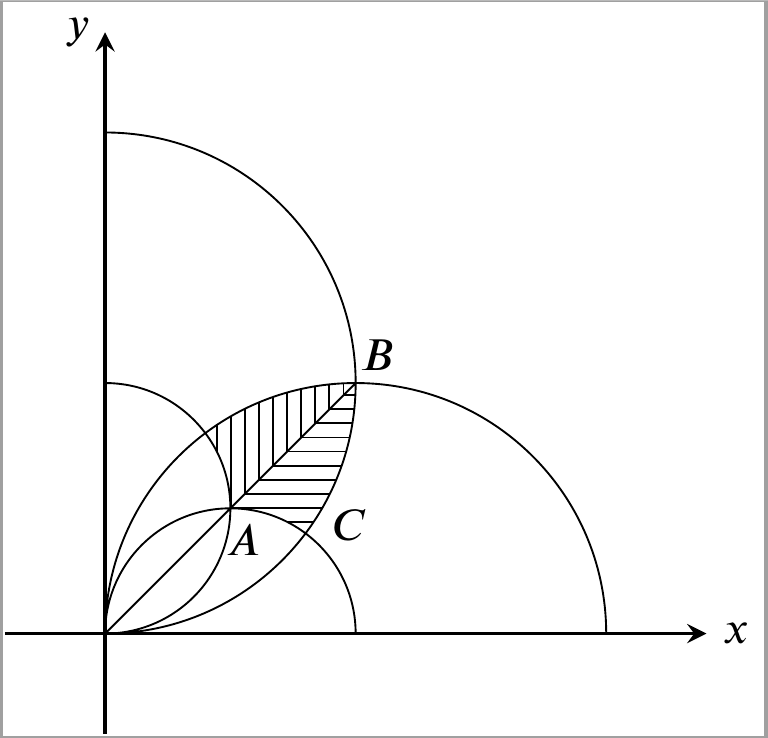
例4.(by kuing) 选自怎么填充图中的阴影部分
% 例4-1
\documentclass[10pt]{standalone}
\usepackage{tikz}
\usetikzlibrary{arrows.meta}
\usepackage{unicode-math}
\setmainfont{XITS}
\setmathfont{XITS Math}
\begin{document}
\begin{tikzpicture}[scale=15]
\begin{scope}
\clip (0,0) arc (-90:0:1/8) arc (90:180:1/8);
\fill[gray,even odd rule] (0,0) arc (-90:0:1/8) arc (90:180:1/8)
arc (-90:270:1/16) arc (-180:180:1/16) arc (-90:0:1/16) arc (90:180:1/16);
\end{scope}
\draw [-stealth,thick](-0.05,0)--(0.3,0);
\draw [-stealth,thick](0,-0.05)--(0,0.3);
\node[right]at(0.3,0){$x$};
\node[left]at(0,0.3){$y$};
\draw (0,0) arc (-90:90:1/8) (0,0) arc (-90:90:1/16)
(0,0) arc (180:0:1/8) (0,0) arc (180:0:1/16) (0,0)--(1/8,1/8);
\node [below]at(0.069,0.0627){$A$};
\node [above]at(0.136,0.123){$B$};
\node [right]at(0.105,0.0541){$C$};
\end{tikzpicture}
\end{document}
% 例4-2
\documentclass[10pt]{standalone}
\usepackage{tikz}
\usetikzlibrary{arrows.meta}
\usetikzlibrary{patterns}
\usepackage{unicode-math}
\setmainfont{XITS}
\setmathfont{XITS Math}
\begin{document}
\begin{tikzpicture}[scale=15]
\begin{scope}
\clip (0,0) arc (-90:0:1/8) arc (90:180:1/8);
\fill[pattern=horizontal lines]
(0,0) arc (-90:0:1/8) --(1/16,1/16) arc (90:0:1/16);
\fill[pattern=vertical lines]
(0,0) arc (180:90:1/8) --(1/16,1/16) arc (0:90:1/16);
\end{scope}
\draw [-stealth,thick](-0.05,0)--(0.3,0);
\draw [-stealth,thick](0,-0.05)--(0,0.3);
\node[right]at(0.3,0){$x$};
\node[left]at(0,0.3){$y$};
\draw (0,0) arc (-90:90:1/8) (0,0) arc (-90:90:1/16)
(0,0) arc (180:0:1/8) (0,0) arc (180:0:1/16) (0,0)--(1/8,1/8);
\node [below]at(0.069,0.0627){$A$};
\node [above]at(0.136,0.123){$B$};
\node [right]at(0.105,0.0541){$C$};
\end{tikzpicture}
\end{document}
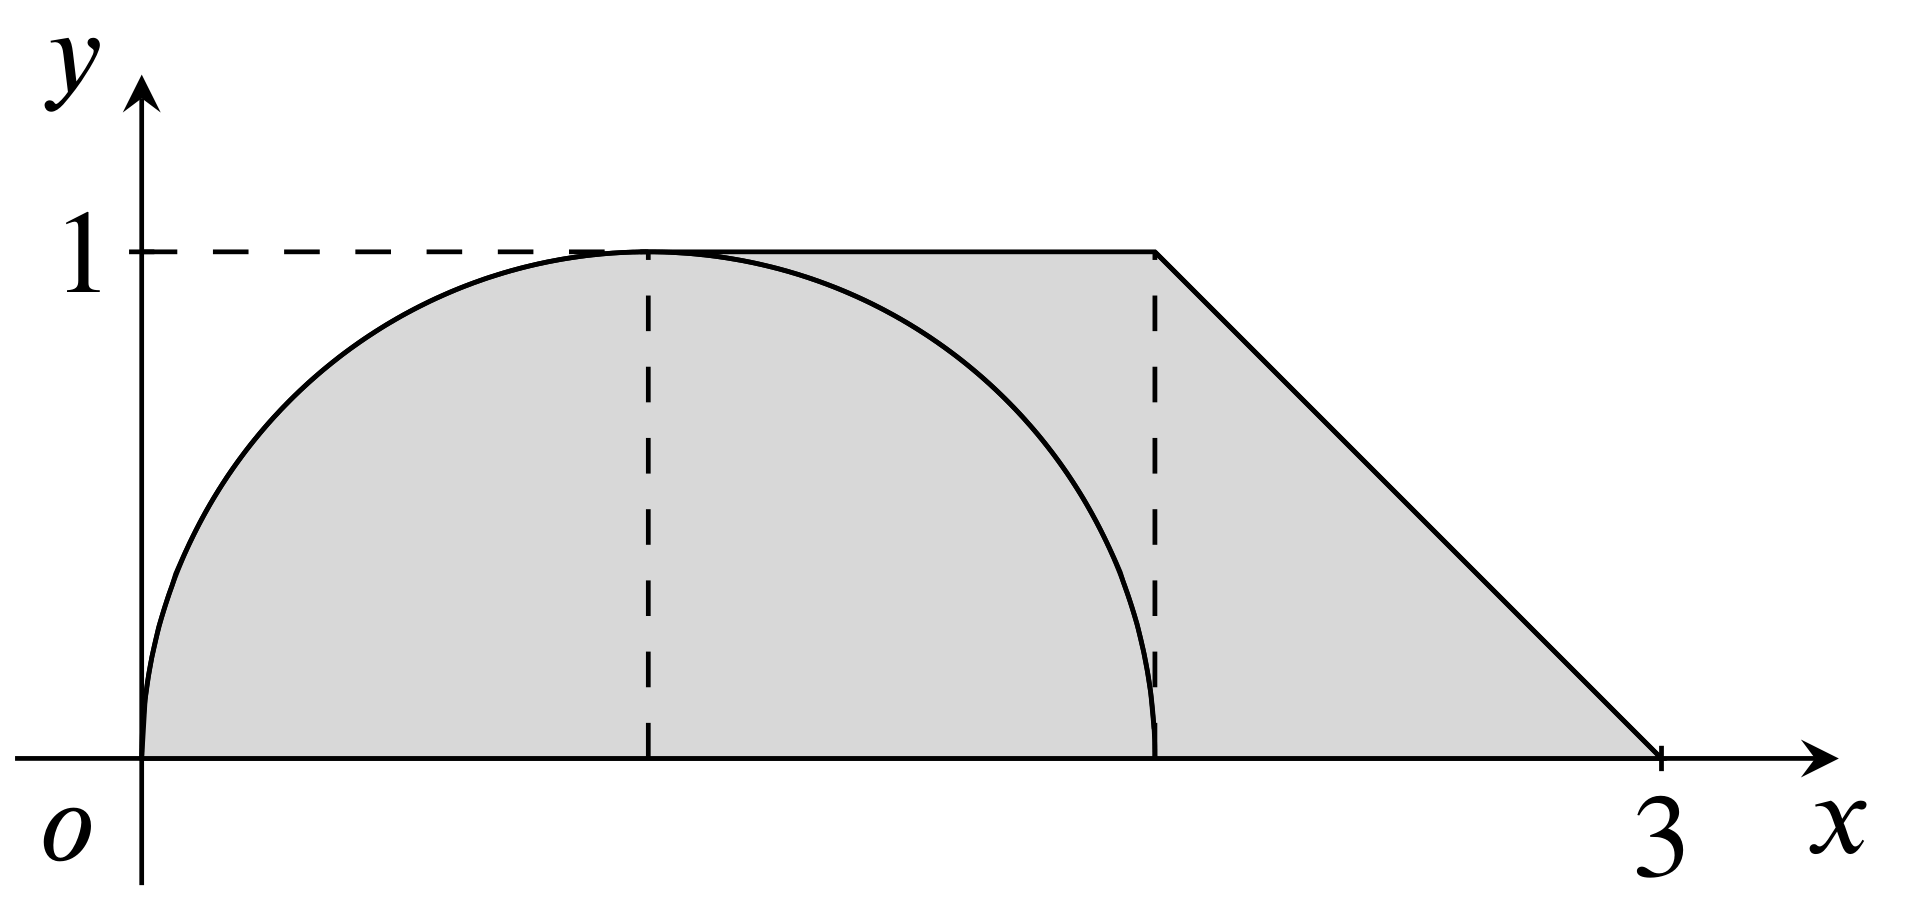
% 例5
\documentclass{standalone}
\usepackage{tikz}
\usetikzlibrary{arrows.meta}
\usetikzlibrary{patterns}
\usepackage{unicode-math}
\setmainfont{XITS}
\setmathfont{XITS Math}
\begin{document}
\begin{tikzpicture}[scale=1.5]
\begin{scope}
\draw[-stealth] (-0.25,0) -- (3.35,0) node (xaxis) [below] {$x$};
\draw[-stealth] (0,-0.25) -- (0,1.35) node (yaxis) [left] {$y$};
\draw (3,0.025)--(3,-0.025) node[below=-0.5mm] {3};
\draw (0.025,1) -- (-0.025,1) node[left=-0.75mm] {1};
\end{scope}
\draw  (-0.15,-0.15) node {$o$};
\draw[fill=gray!30] (2,0) arc [start angle=0, end angle=180, radius=1] -- (3,0) -- (2,1) -- (1,1); %,pattern=dots,even odd rule
\draw[domain=2:3,fill=green!20] plot (\x,3-\x);
\draw[samples=300,domain=0:2.0] plot (\x,{(1-(1-\x)^2)^(1/2)});
\draw[dashed] (0,1) -- (1,1);
\draw[dashed] (2,0) -- (2,1);
\draw[dashed] (1,0) -- (1,1);
\end{tikzpicture}
\end{document}
转载于:https://my.oschina.net/shaodongtang/blog/2252834
LaTeX - 填充图中的阴影部分相关推荐
- 利用Origin绘制等高线颜色填充图:初步绘制与细化
利用Origin绘制梯度填充图:初步绘制与细化 前言 一."等高线-颜色填充"图的初步绘制 1.数据表准备 1.1 新建工作簿 1.2 数据导入 2.绘制"等高线-颜色填 ...
- python数学公式代码导入_在Matplotlib图中插入LaTex公式实例
Matplotlib可以无缝的处理LaTex字体,在图中加入数学公式 from matplotlib.patches import Polygon import matplotlib.pyplot a ...
- seaborn箱图(box plot)可视化、并且使用matplotlib的meanprops函数在箱图中自定义均值标签、标签形状、标签大小、标签填充色彩、标签边缘颜色
seaborn箱图(box plot)可视化.并且使用matplotlib的meanprops函数在箱图中自定义均值标签.标签形状.标签大小.标签填充色彩.标签边缘颜色 目录
- R语言ggplot2可视化:水平半小提琴图(Horizontal Half Violin Plots)、去除水平半小提琴图中的填充色、ggridges包的绘制山脊图
R语言ggplot2可视化:水平半小提琴图(Horizontal Half Violin Plots).去除水平半小提琴图中的填充色.ggridges包的geom_density_ridges函数绘制 ...
- inkscape如何裁剪_科学网—如何在Inkscape图中输入LaTeX公式? - 李金磊的博文
在Inkscape中插入LaTeX公式需要两个软件:TeX Text 和 WriteTeX . [安装步骤] 安装TeXText的步骤详见网址: 1. 安装 GSview 和 MikTeX,安装包下载 ...
- MATLAB二维绘图(二)向图中添加标题,坐标轴,图标和文字信息
MATLAB二维绘图(二)向图中添加标题,坐标轴,图标和文字信息 1.添加标题.图例.x轴信息和y轴信息,示例: %% 添加标题 clear; clc; close all; x = 0:0.1:2* ...
- origin 多曲线绘制填充图,阴影图
在写论文时会遇到多个曲线绘制阴影图的问题,我查了很多教程,没有解决问题,有个博主的标题比较类似,Origin | 填充面积图 | 绘制多曲线填充图_跳动的喵尾巴的博客-CSDN博客_origin填充指 ...
- 计算机cad论文参考文献,Auto CAD在计算机绘制矿图中的应用探索
摘 要:随着我国社会水平的提升,经济步伐的推进,我国的煤矿事业也在这个过程中得到了较大程度的发展.其中,矿图是煤矿开采过程中非常重要的一项工具,可以说是煤矿采掘的重要依据和基础.矿图不仅反映内容复杂, ...
- WPF入门(四)-线形区域Path内容填充之填充图(ImageBrush)
WPF入门(四)->线形区域Path内容填充之填充图(ImageBrush) 原文:WPF入门(四)->线形区域Path内容填充之填充图(ImageBrush) 前面我们提到了Linear ...
最新文章
- MapWindow记录
- Linux7静默安装Oracle11g教程,亲测实用有效!
- 正确入门Service Mesh:起源、发展和现状
- Eclipse和PyDev搭建完美Python开发环境(Windows篇)
- java 蓝桥杯算法训练 纪念品分组(题解)
- 通配符?子字符串匹配主字符串次数_leetcode 44 通配符匹配(c++)
- GCC(-pg) profile mcount | ftrace基础原理
- 12306网站将新增微信通知方式
- “OpAfrica”行动:匿名者攻击南非武器采购机构
- deque(双向队列)
- 订阅github release(官方+IFTTT)
- Angr安装与使用之使用篇(十一)
- 为什么要使用英英词典?
- 基于LQR的二自由度云台控制与仿真
- 温度、水汽压、湿度计算公式
- OSPF中的LSA类型的详解
- 第二周预习——html常用标签,认识浏览器
- 怎么读取照片内的文字
- 利用计算机求解一个实际问题的步骤是,数学在计算机科学的应用.doc
- android 高德地图动画,Android 高德地图上自定义动画