Power BI Desktop报告中的Web URL配置
Power BI简介 (Power BI Introduction)
Power BI Desktop provides many useful visualizations with simple configurations. You can represent data visually in different forms that help users and management in data interpretation. You can explore a broad category of Power BI articles here on SQLShack.
Power BI Desktop通过简单的配置提供了许多有用的可视化。 您可以以不同的形式直观地表示数据,以帮助用户和管理数据解释。 您可以在SQLShack上探索Power BI文章的广泛类别。
It is always a good practice to work on the latest release of Power BI Desktop to make use of the latest enhancements and features available. If you do not have it, visit URL, download December 2019 release and install it.
最好总是使用最新版本的Power BI Desktop来利用最新的增强功能和功能。 如果没有,请访问URL ,下载2019年12月发行版并安装它。
You might be familiar with a hyperlink in a Microsoft Word document that allows specifying a URL using a familiar name. A user can click on the hyperlink, and it opens the web page for you. It is mostly useful for you in specifying web page references.
您可能熟悉Microsoft Word文档中的超链接,该超链接允许使用熟悉的名称指定URL。 用户可以单击超链接,它会为您打开网页。 在指定网页参考时,它对您最有用。
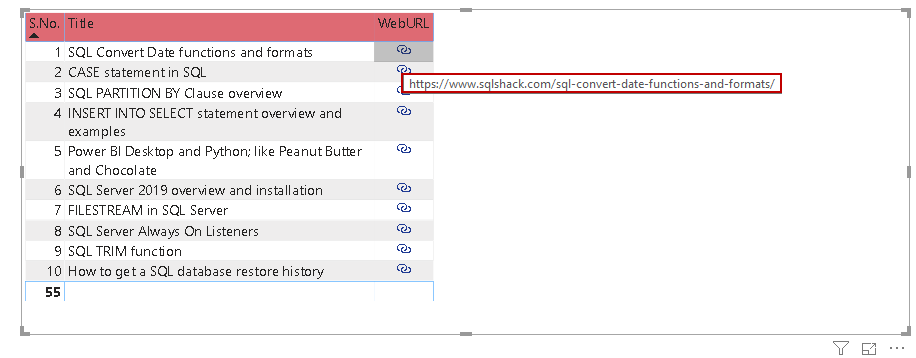
Let’s take a SQLShack articles report in Power BI desktop, that shows a few of my published articles in the year 2019. It contains information such as article title, article URL along with email address.
让我们在Power BI桌面上获取SQLShack文章报告,其中显示了我在2019年发表的一些文章。它包含诸如文章标题,文章URL以及电子邮件地址之类的信息。
We have a reference URL for each article in a separate column. Users can copy the URL in a web browser for reading the article.
我们在单独的栏中为每个文章提供了参考URL。 用户可以在Web浏览器中复制URL以阅读文章。
Do we want a user to copy each URL, paste it into the web browser and open it? No, Power BI Desktop provides you with adding a URL hyperlink in the report as well.
我们是否希望用户复制每个URL,将其粘贴到Web浏览器中并打开它? 不,Power BI Desktop还为您提供了在报告中添加URL超链接的功能。
导入报告数据 (Import data for the report)
Launch Power BI Desktop and import data using the Get Data menu.
启动Power BI Desktop并使用“获取数据”菜单导入数据。
Click on Excel and specify an excel sheet location.
单击Excel并指定一个Excel工作表位置。
Once you click ok, it establishes a connection to excel source, and you get a data preview.
单击“确定”后,它将建立与excel源的连接,并且您将获得数据预览。
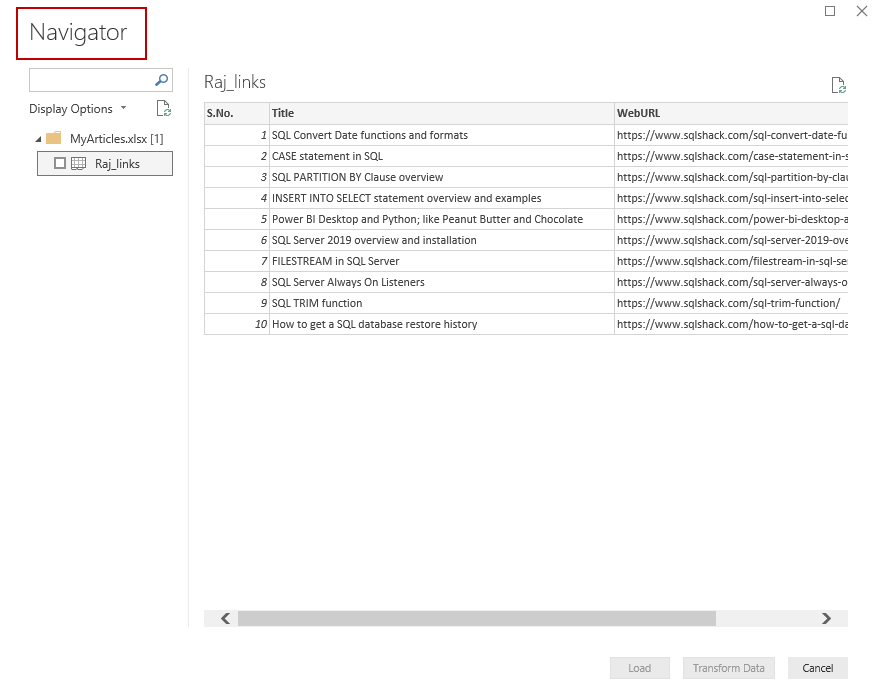
Click on Load. In the above image, we see Load and Transform Data buttons disabled. We need to check the excel sheet, and it enables both buttons.
单击加载。 在上图中,我们看到“加载”和“转换数据”按钮被禁用。 我们需要检查excel工作表,它同时启用了两个按钮。
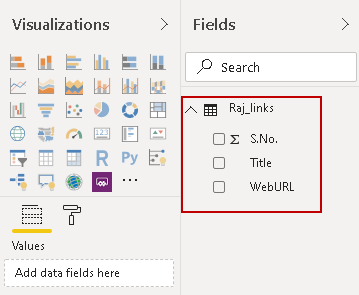
It loads data, and you see excel columns in Power BI Desktop fields pane.
它会加载数据,并且您会在Power BI Desktop的字段窗格中看到excel列。
设计报告 (Design a report)
Now click on a table visual from the visualization section. It draws a layout for you in the visualization pane, as shown below.
现在,在“可视化”部分中单击表格视觉。 它将在可视化窗格中为您绘制一个布局,如下所示。
Check the required columns, and it gives you a list as shown below.
检查必填列,它会为您提供如下列表。
Let’s do quick formatting for this.
让我们对此进行快速格式化。
[S.No.] columns are not sorted according to numbers. Click on [S.No.] and sort the rows in ascending order

[S.No.]列未根据数字排序。 单击[序列号],然后按升序对行进行排序
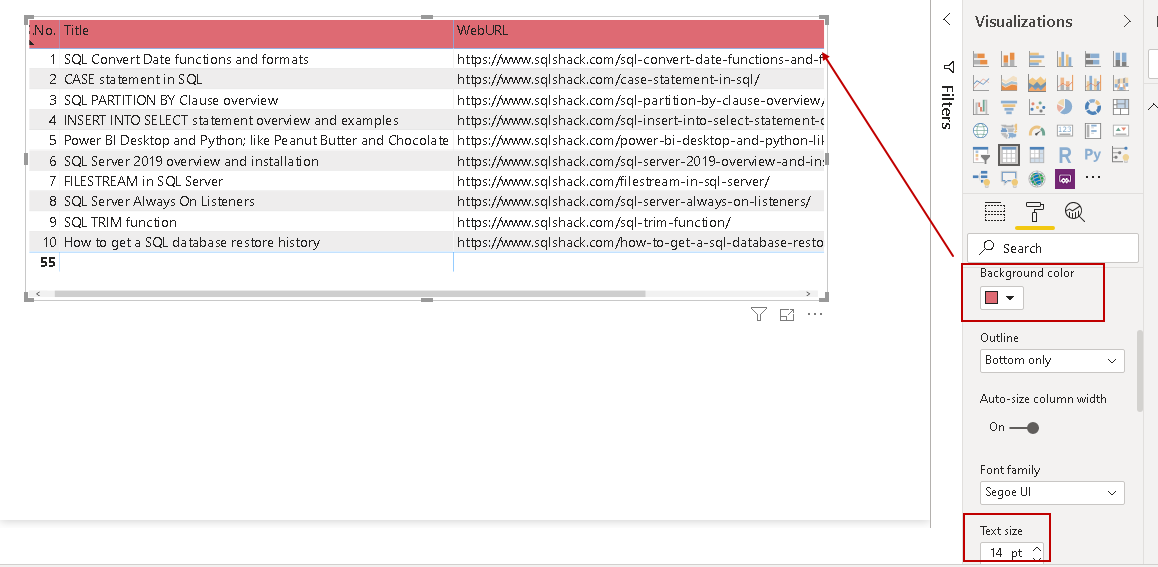
Currently, font size is small. Increase font size so that we can easily read the texts. To change font size, click on the chart, and increase the value font size, as shown below
当前,字体大小很小。 增加字体大小,以便我们可以轻松阅读文本。 要更改字体大小,请单击图表,然后增加值字体大小,如下所示
Similarly, you can increase the size for the table header and change background color as well
WebURL 建模 (WebURL Modeling)
Once our report formatting is complete, click on the Modeling tab in the menu ribbon.
完成我们的报告格式设置后,单击菜单栏中的“ 建模”选项卡。
In the Modeling tab, we get an option for data categorization. We can do data categorization in the data viewer tab. Click on the highlighted data tab, and you see your data as shown below.
在“建模”选项卡中,我们有一个数据分类选项。 我们可以在“数据查看器”选项卡中进行数据分类。 单击突出显示的数据选项卡,您将看到如下所示的数据。
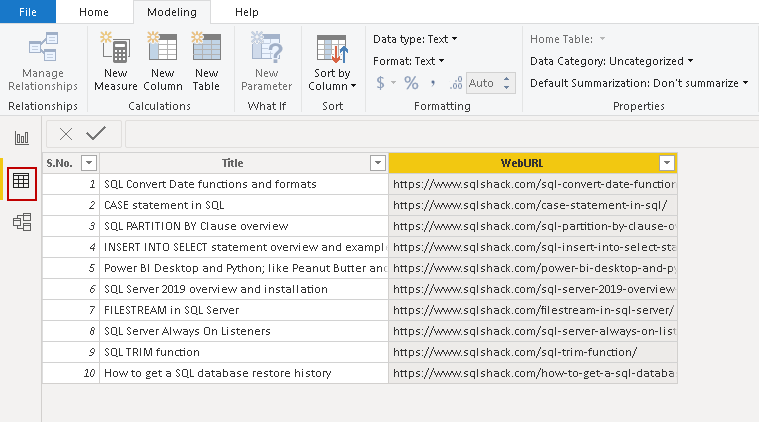
Here, select the WebURL column and click on Data Category. By default, all data columns are uncategorized.
在这里,选择WebURL列,然后单击数据类别。 默认情况下,所有数据列都是未分类的。
We can use the following categories for our data.
我们可以将以下类别用于我们的数据。
- Address 地址
- City 市
- Continent 大陆
- CountryRegion 国家地区
- Country 国家
- Latitude 纬度
- Longitude 经度
- Place 地点
- Postal Code 邮政编码
- State or Province 州或省
- Web URL 网址
- Image URL 图片网址
- BarCode 条码
You might think:
你可能认为:
- Why should I categorize my data? 为什么要对数据进行分类?
- What impact will it have on my report if I categorize the data? 如果对数据进行分类,它将对我的报告产生什么影响?
Once we define the data category, the Power BI Dashboard changes data in the report automatically. In this example, we require a hyperlink for the web URL in the report. Select the Web URL from the category list. Do you see any changes?
定义数据类别后,Power BI仪表板将自动更改报告中的数据。 在此示例中,我们需要报表中Web URL的超链接。 从类别列表中选择Web URL。 您看到任何变化吗?
No changes in the report, right? Let’s switch to the report now using the icon highlighted in the below image.
报告没有变化,对吧? 现在,使用下图突出显示的图标切换到报告。
Once you click on a report, you can see that Web URL contains a hyperlink for each referenced article. These hyperlinks are a blue color and underlined.
单击报表后,您可以看到Web URL包含每个引用文章的超链接。 这些超链接为蓝色并带有下划线。
You can click on a Web URL, and it redirects you to a web page in the default browser.
您可以单击Web URL,它会将您重定向到默认浏览器中的网页。
It solves our requirement of a hyperlink in the Power BI Desktop report. You give this report to users but get the new requirement.
它解决了我们在Power BI Desktop报告中对超链接的需求。 您将此报告提供给用户,但获得了新的要求。
对WebURL使用URL图标 (Use a URL icon for a WebURL)
Users do not want to display a web URL as a hyperlink. Users want a hyperlink icon in front of the title. If they click on the URL icon, it should redirect to the corresponding web page. Let’s explore this solution, as well.
用户不想将Web URL显示为超链接。 用户希望标题前面有一个超链接图标。 如果他们单击URL图标,它将重定向到相应的网页。 让我们也探索这个解决方案。
Click on the report formatting icon and search for a web URL. Alternatively, you can expand values and locate the URL icon. By default, it is off, as shown below.
单击报告格式图标,然后搜索Web URL。 或者,您可以展开值并找到URL图标。 默认情况下,它是关闭的,如下所示。
Turn it on and view changes in the report. It removes the web URL and places a URL icon.
打开它并查看报告中的更改。 它将删除Web URL并放置一个URL图标。
You can hover your mouse to view the URL or click on the icon to open this web page in the default browser.
您可以将鼠标悬停以查看URL或单击图标以在默认浏览器中打开此网页。
条件格式和WebURL超链接 (Conditional formatting and WebURL hyperlink)
We can also create hyperlinks in Power BI Report like a word document. For this, select the required title and search for Web URL in the formatting section. It is in off state, by default.
我们还可以像文字文档一样在Power BI报表中创建超链接。 为此,选择所需的标题并在格式部分中搜索Web URL。 默认情况下,它处于关闭状态。
Here you get two options- Conditional formatting and Web URL. In the Conditional formatting, select the column in which we want a hyperlink. For my demo, change it to Title.
在这里,您有两个选择-条件格式和Web URL。 在条件格式中,选择我们想要超链接的列。 对于我的演示,将其更改为Title。
Now, drag the Web URL slider and turn it on. It opens a pop up for URL configuration. In the top, it displays the column we selected in the conditional formatting.
现在,拖动Web URL滑块并将其打开。 它会弹出一个用于URL配置的弹出窗口。 在顶部,它显示了我们在条件格式中选择的列。
Here, choose a column that contains the URL. Our title will use these URLs for the hyperlink.
在这里,选择包含URL的列。 我们的标题将使用这些URL作为超链接。
Click Ok, and you get a hyperlink in the title as well.
单击“确定”,标题中也会显示一个超链接。
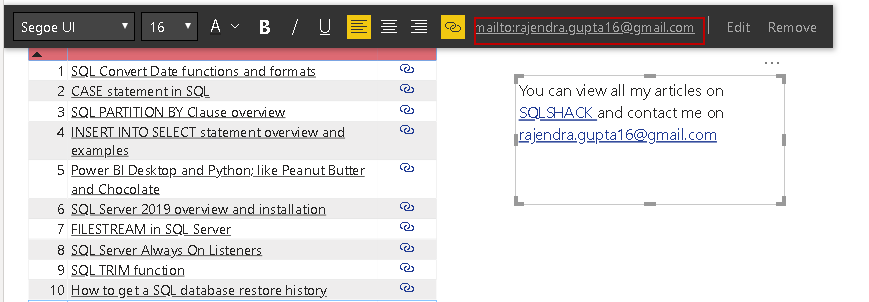
In this section, we will add an email address hyperlink.
在本节中,我们将添加一个电子邮件地址超链接。
For this demonstration, add a text box as shown below.
对于此演示,添加一个文本框,如下所示。
Write some text in this text box and do formatting such as font category, size.
在此文本框中写一些文本并进行格式化,例如字体类别,大小。
电子邮件超链接和图标 (Email hyperlink and icon)
Now, we want the following enhancements.
现在,我们需要以下增强。
- Add a text hyperlink for the SQLShack. It is equivalent to a Microsoft word hyperlink 为SQLShack添加文本超链接。 它等效于Microsoft单词超链接
- Add hyperlink for the email address 为电子邮件地址添加超链接
In the first requirement, select SQLShack and click on the link icon.
在第一个要求中,选择SQLShack并单击链接图标。
It opens a text box. Enter URL in this box.
它打开一个文本框。 在此框中输入URL。
Click done, and you get the text hyperlink, as shown below.
单击“完成”,您将获得文本超链接,如下所示。
For email, hyperlink selects the email address and click on hyperlink icon. It automatically shows the email address in the text box and adds a mailto: prefix for the email address.
对于电子邮件,超链接选择电子邮件地址,然后单击超链接图标。 它会自动在文本框中显示电子邮件地址,并添加一个mailto:前缀 电子邮件地址。
Click done, and you can see email hyperlink.
单击完成,您可以看到电子邮件超链接。
Users can click on this email hyperlink, and it redirects you to an appropriate email client such as outlook, mail.
用户可以单击此电子邮件超链接,它将您重定向到适当的电子邮件客户端,例如Outlook,邮件。
It gives a warning message that Power BI desktop wants to launch a mail application that is not a part of it.
它给出警告消息,说明Power BI桌面要启动不属于其中的邮件应用程序。
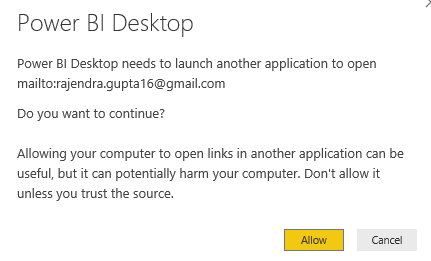
Click on Allow. It opens a new mail message. It puts the hyperlink email address in the To: list.
单击允许。 它打开一个新的邮件。 它将超链接电子邮件地址放入“ 收件人:”列表中。
It is especially useful in case you want to specify email address in the report for any issues with the reports shared with the user. Users do not need to copy mail address or write it that might have spelling mistakes.
如果您要在报告中指定电子邮件地址,以解决与用户共享的报告中的任何问题,该功能特别有用。 用户不需要复制或写可能有拼写错误的邮件地址。
Now, let’s make changes in the excel sheet and replace the web URL with an email address. Click on refresh data, and you see updated data in Power BI Desktop.
现在,让我们在Excel工作表中进行更改,然后将Web URL替换为电子邮件地址。 单击刷新数据,然后在Power BI Desktop中看到更新的数据。
Now change the data category as Web URL and view the report. But we do not get the hyperlink for the email addresses.
现在,将数据类别更改为Web URL并查看报告。 但是我们没有获得电子邮件地址的超链接。
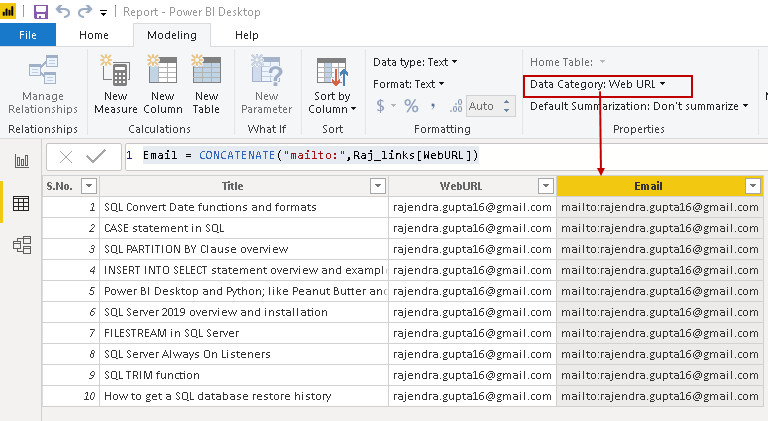
Go back to data view and add a new column that concatenates prefix mailto: for the email addresses. We have previously observed that in textbox Power BI Desktop automatically adds this prefix, but in table data, we are required to add it manually.
返回数据视图并添加一个新列,该列将前缀mailto:连接到电子邮件地址。 以前我们已经观察到Power BI Desktop在文本框中会自动添加此前缀,但是在表数据中,我们需要手动添加它。
Email = CONCATENATE(“mailto:”,Raj_links[WebURL])
电子邮件= CONCATENATE(“ mailto:”,Raj_links [WebURL])
Categorize this new column as a web URL and switch to the report view. Right-click on fields, refresh it, remove the WebURL column and tick on the new column Email.
将此新列分类为Web URL,然后切换到报告视图。 右键单击字段,刷新它,删除“ WebURL”列,然后在新列“电子邮件”上打勾。
You get email hyperlink as shown below.
您将获得电子邮件超链接,如下所示。
Now, turn on the URL icon, and it changes icon per the following image.
现在,打开URL图标,然后根据下图更改图标。
结论 (Conclusion)
In this article, we explored the use of a Web URL and Icon URL for Power BI Desktop reports. It helps us to provide references for URL and specifying a contact email address in the URL and icon form as well.
在本文中,我们探讨了Web URL和Icon URL在Power BI Desktop报告中的使用。 它有助于我们为URL提供参考,并以URL和图标形式指定联系人电子邮件地址。
翻译自: https://www.sqlshack.com/web-url-configuration-in-a-power-bi-desktop-report/
Power BI Desktop报告中的Web URL配置相关推荐
- 在Power BI Desktop报告中使用图像
介绍 (Introduction) In the article Web URL configuration in a Power BI Desktop report, we explored a d ...
- 如何在Power BI Desktop报表中使用Web数据源
This article explores various ways to use a Web data source in Power BI Desktop reports. 本文探讨了Power ...
- Power BI Desktop中的“提问”功能
In this article, we are going to learn how to use Power BI Desktop Q&A functionality to enable u ...
- 使用Power BI Desktop可视化分析冠状病毒数据
This article gives you an overview of representing coronavirus spread using Power BI Desktop visuali ...
- power bi导入文件夹_从Power BI Desktop中的PDF文件导入数据
power bi导入文件夹 Power BI Desktop is a useful reporting and analytical tool to represent data in variou ...
- power bi可视化表_滚动器可视化功能,用于Power BI Desktop中的股价变动
power bi可视化表 In the article, Candlestick chart for stock data analysis in Power BI Desktop, we explo ...
- 用于Power BI Desktop中的库存数据分析的烛台图
Candlestick chart for stock data analysis in Power BI Desktop 用于Power BI Desktop中的库存数据分析的烛台图 Power B ...
- Power BI Desktop中的分解树
介绍 (Introduction) Power BI is enriched with many useful visualizations and helps to represent data i ...
- power python_在 Power BI Desktop 中运行 Python 脚本
在 Power BI Desktop 中运行 Python 脚本Run Python scripts in Power BI Desktop 06/02/2020 本文内容 你可以直接在 Power ...
最新文章
- java数据库连接的作用_java数据库连接池的作用
- 路由器级联后网速慢的原因分析和问题解决
- III 25 git
- Gradle笔记系列(一)
- 基于SignalR实现B/S系统对windows服务运行状态的监测
- oracle模拟试题
- 软件设计的第一性原理:结构化抽象
- JAVA将ResultSet结果集遍历到List中
- mysql练习题练习
- 8VC Venture Cup 2016 - Final Round (Div. 2 Edition) C. XOR Equation 数学
- 【PPT分享】特斯拉远景规划及中国供应链的机遇.pdf(附119页ppt下载链接)
- 机器人末端执行器气爪怎么吸合_工业机器人带动末端执行器市场发展
- Java 泛型的实例化总结
- 如何查看或修改FANUC机器人的系统变量?
- 安川机器人SOCKET 通讯
- 最难学的十大编程语言,C++排第二,它竟是第一名!不服
- 关于vue移动端下载图片
- 深入理解卷积网络的卷积
- python在家创业项目_8种可以让你在家创业的项目
- 非常棒的开源协同办公OA项目,收藏了!
热门文章
- idea主题颜色Linux,intellij idea 主题大全,看不惯idea 那2种主题的来这里了
- linux系统可以安装搜狗输入法,在Arch Linux系统中安装搜狗输入法的方法
- java 内存分配实例_java内存管理实例讲解
- 2019 vs 安装odt_河南2019二级造价师考试教材出版信息,免费送考试大纲
- cookie代码加时间多久出现一次_恶意代码分析 丨 一个毫无套路的咸鱼诈骗网站...
- 【OpenJ_Bailian - 2790】迷宫(bfs)
- python小括号( )与中括号 [ ]
- E20170816-mk
- C# tif文件转jpg
- 计算机组成原理(三)--存储器的层次结构