在python中建立线性回归
Yes, I know — there is a built in function in the python numpy module that does linear (and other powers) fitting. It looks like this.
是的,我知道— python numpy模块中有一个内置函数,可以进行线性(和其他幂)拟合。 看起来像这样。
m,b = polyfit(x, y, 1)But what if you are using VPython (Glowscript)? This is the online version of python with the built in visual module. It has awesome stuff for making graphs, vector calculations, and even 3D visualizations. But what if you want to use Glowscript AND find a linear function that best fits some points or data? What then?
但是,如果您使用的是VPython(Glowscript),该怎么办? 这是带有内置可视模块的python的在线版本。 它具有制作图形,矢量计算甚至3D可视化的出色功能。 但是,如果您想使用Glowscript并找到最适合某些点或数据的线性函数怎么办? 然后怎样呢?
Oh yeah — I’m going to show you how to do this.
哦,是的-我将向您展示如何执行此操作。
What Is a Linear Regression Fit?
什么是线性回归拟合?
Let’s start with an example. Suppose I have some data and I want to find a linear function that best matches this data. Something like this:
让我们从一个例子开始。 假设我有一些数据,我想找到一个最匹配此数据的线性函数。 像这样:
That’s 6 data points and one linear function. Let’s say the line has the mathematical form of:
这是6个数据点和一个线性函数。 假设该行具有以下数学形式:

But what values for A and B produce a line that best fits the data? Yes, this is why it’s called a “best fit” line. If you made this line on actual graph paper, you could just “eyeball” it. You could use a straight edge and just approximate the best fit line. But you can’t do this with python (well, maybe you could — that would be a fun experiment for later).
但是,A和B的哪些值会产生最适合数据的线? 是的,这就是为什么它被称为“最佳拟合”线。 如果您在实际的方格纸上画出这条线,则可以“盯上”它。 您可以使用笔直的边缘,并近似于最佳拟合线。 但是您不能使用python做到这一点(嗯,也许可以,这以后会很有趣)。
Other than estimating, the most common method to find these parameters (A and B) is with a Least Squares Fit. The idea is to pick some line and find the square of the y-difference between each data point and the line. Then you do this for ALL the data points and sum the square of there differences between the line.
除了估计以外,找到这些参数(A和B)的最常用方法是最小二乘拟合。 这个想法是选择一条线,并找到每个数据点和该线之间的y差的平方。 然后,对所有数据点执行此操作,并对线之间的差异平方求和。
Maybe a diagram will help.
也许图表会有所帮助。

It’s the square of this vertical distance that I will add up. The y-value on the line depends on the x-value of the data point. This gives a change in y value of:
这就是我要累加的垂直距离的平方。 线上的y值取决于数据点的x值。 y值的变化为:

Squaring this and finding the sum for all data points, I get the following.
对此求平方并找到所有数据点的总和,我得到以下结果。

You could have any values for A and B and get a line along with a sum of the squares of differences. However, we want the values of A and B that gives the minimum sum. That’s why it’s called “Least Squares Fit” — get it?
您可以具有A和B的任何值,并获得一条线以及差平方的总和。 但是,我们希望A和B的值总和最小。 这就是为什么它被称为“最小二乘拟合”的原因?
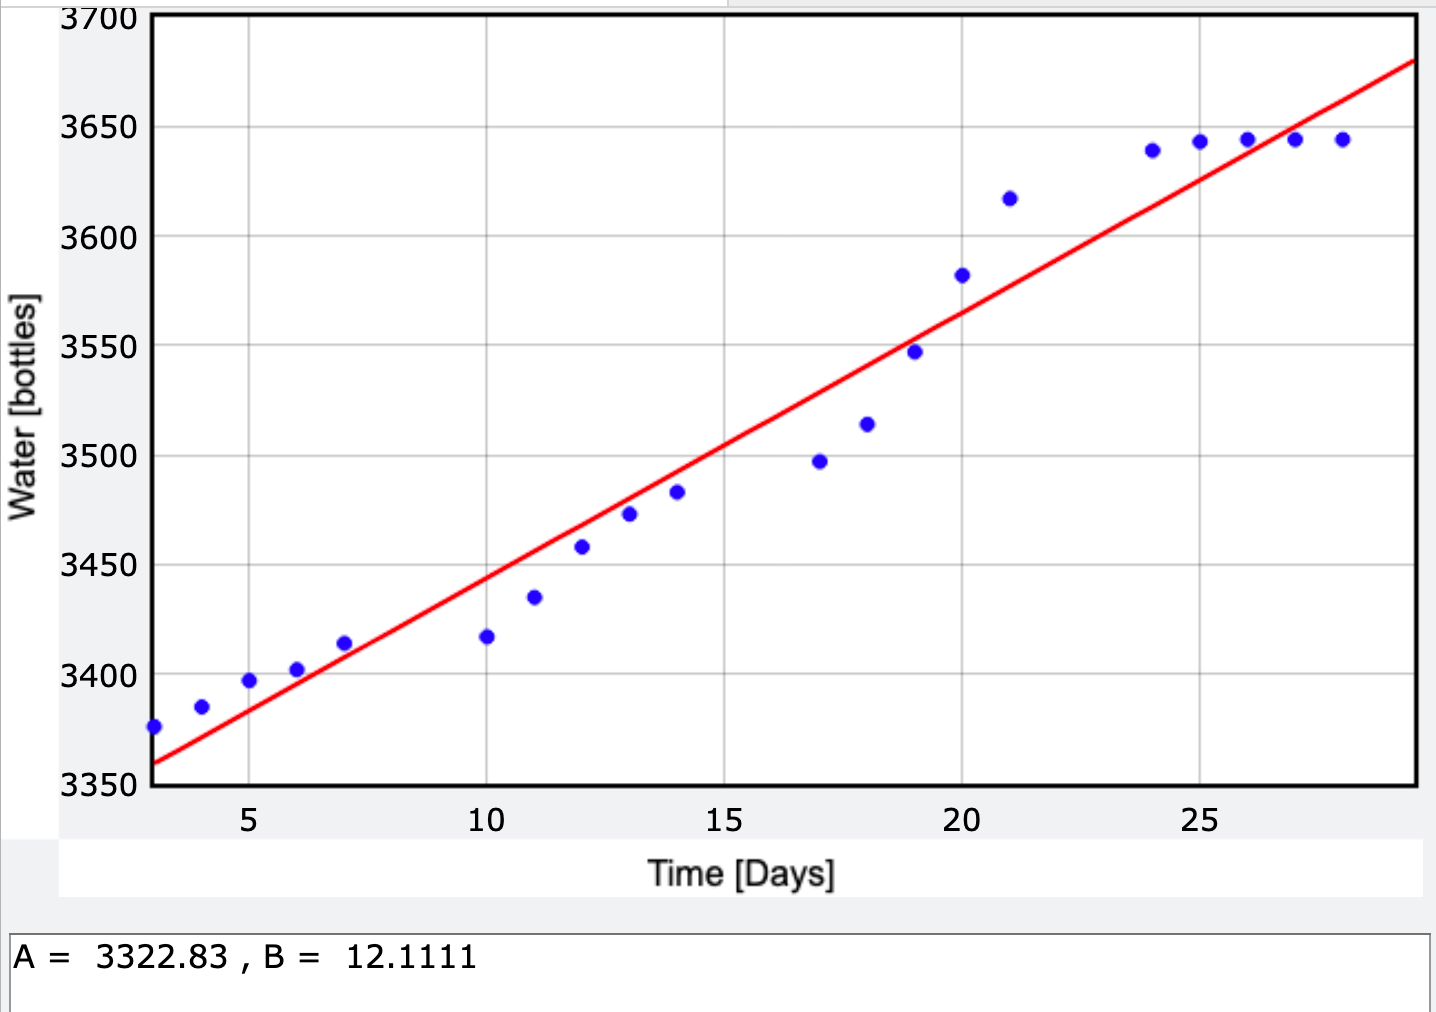
OK, before we go further let’s start playing with some data. I wanted to use real data — so this is the “water bottles saved” value as a function of day for the water fountain in the hallway (I’ve been collecting data for a while now). For the line, I just calculated the slope and y-intercept using the first and last data points.
好的,在继续之前,让我们开始处理一些数据。 我想使用真实的数据-因此,这是走廊中饮水器每天的“节省的水瓶”值( 我已经收集了一段时间 )。 对于这条线,我只是使用第一个和最后一个数据点计算了斜率和y截距。

Now I want to take each of these data points and find the difference between the vertical value and the line. Square those and add them up. Here’s the code that does that (here is the full code with the plot and EVERYTHING). Oh, I should note that my time values are in a list called “t” and the water is in a list “v”.
现在,我要获取这些数据点中的每个数据点,并找到垂直值和直线之间的差异。 将它们平方并加起来。 这是执行此操作的代码( 这是带有plot和EVERYTHING的完整代码 )。 哦,我应该注意,我的时间值在一个名为“ t”的列表中,而水在一个列表“ v”中。
sum=0for j in range(len(t)): sum=sum+(v[j]-b-m*t[j])**2There’s a lot going on here, so let me make some comments.
这里有很多事情,所以让我发表一些评论。
- The “for” loop goes through a number equal to the length of the t-list. That’s what that second line says.“ for”循环的编号等于t-list的长度。 那就是第二行所说的。
- The third line just calculates the difference between the v variable and the point below it on the line.第三行只是计算v变量和该行下面的点之间的差。
Running this calculation gives a square difference of 9591.26 — but that doesn’t really mean much. What if I change the slope of my “best fit” line? The plot above has a slope of 10.72 bottles per day (remember, slopes have units). Here are some slopes along with their sum of difference squared. (Technically, the sum has units too — but I’m too lazy to include those)
运行此计算得出的平方差为9591.26-但这并不意味着很多。 如果更改“最佳拟合”线的斜率怎么办? 上图的斜率每天为10.72瓶(请记住,斜率有单位)。 这是一些斜率以及它们的差平方和。 (从技术上讲,总和也有单位,但我懒得将其包括在内)
- Slope = 10 bottle/day, sum = 14,599坡度= 10瓶/天,总和= 14,599
- Slope = 10.72 bottle/day, sum = 9591.21坡度= 10.72瓶/天,总和= 9591.21
- Slope = 12 bottle/day, sum = 11,927坡度= 12瓶/天,总和= 11,927
You can see that a slope of 10.72 b/d is lower than the other two slopes. But is it the lowest? Oh, let’s find out. Here is a plot of the sum of the square of differences for different values of the slope. (here’s the code)
您会看到10.72 b / d的斜率低于其他两个斜率。 但这是最低的吗? 哦,让我们找出答案。 这是针对不同斜率值的差异平方和的图。 ( 这是代码 )

But wait! That might not be the best-fit slope even though it’s the minimum for the function. What about changing the vertical intercept? Yup, we would have to change this value also (and at the same time) to find the real best fit line.
可是等等! 即使这是函数的最小值,也可能不是最合适的斜率。 改变垂直截距怎么办? 是的,我们还必须(同时)更改此值以找到真正的最佳拟合线。
Just for fun, here is a variation of the y-intercept with the slope that gives the minimum sum.
只是为了好玩,这是y截距随斜率的变化而给出的最小和。

Ok, but clearly there’s a better way to find these coefficients A and B — I just wanted to make some plots so you could really see what’s going on.
好的,但是显然有一种更好的方法来找到这些系数A和B-我只是想作一些图,以便您可以真正看到正在发生的情况。
Really, we want to do a minimization of a function with two variables. This means that we need to take the partial derivative of the sum with respect to A and set that equal to zero (the slope at the minimum is zero). Then we need to also take the partial derivative of the sum with respect to B and set it equal to zero. With these two equation and two unknowns (A and B), we can solve for the stuff.
确实,我们要对具有两个变量的函数进行最小化。 这意味着我们需要相对于A取总和的偏导数,并将其设置为零(最小斜率为零)。 然后,我们还需要针对B求和的偏导数并将其设置为零。 有了这两个方程和两个未知数(A和B),我们就可以解决问题。
I’m not going to go through the details (because it gets slightly messy because of the summations) — so I’ll just give you the answer. Oh, but here is a video with more details. Here is how to calculate the two coefficients.
我不会详细介绍(因为求和会使它有些混乱)-所以我只给你答案。 哦, 但这是一个包含更多细节的视频。 这是两个系数的计算方法。

I like this format since it’s a little bit shorter. However, notice that you have to calculate the B coefficient first as it’s used in the A calculation. Also, these are all summations over all the data points.
我喜欢这种格式,因为它有点短。 但是,请注意,您必须首先计算B系数,因为它是在A计算中使用的。 同样,这些都是所有数据点的总和。
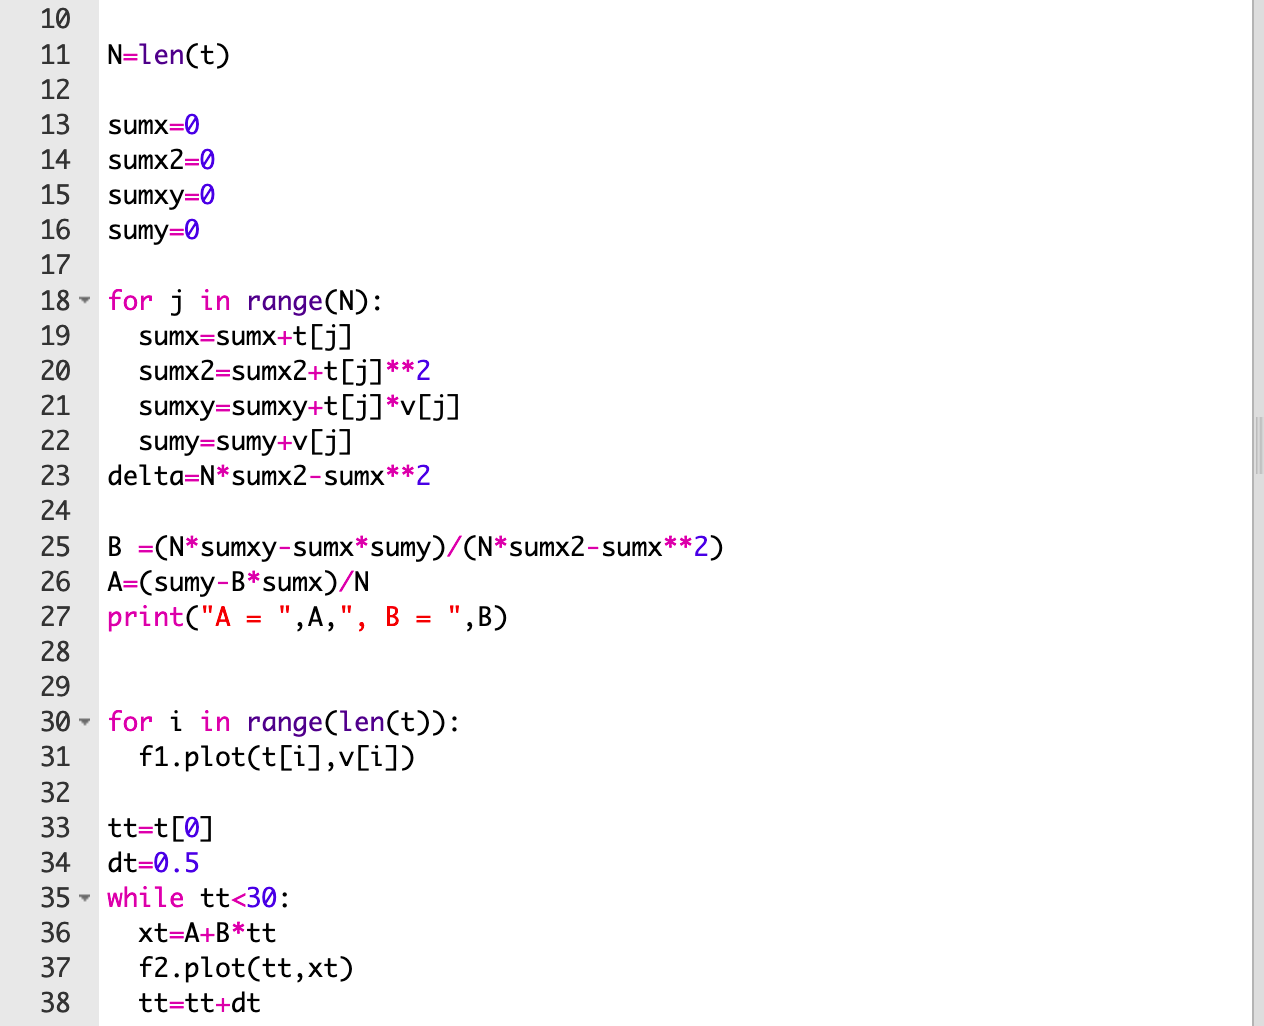
Here is the code (I cut off the top) to calculate this least squares fit.
这是计算最小二乘方拟合的代码(我切除了顶部)。

Now for the comments:
现在发表评论:
Line 11: t is a list of the days in the data. So,
len(t)returns the length of this list — that would be N.第11行:t是数据中的日期列表。 因此,
len(t)返回此列表的长度,即为N。- Lines 13–16: these just set up the initial values for all the sums that I need to calculate.第13至16行:这些只是为我需要计算的所有总和设置了初始值。
- Lines 18–22: this makes a loop that goes through all the data in the two lists (t and v in this case) and adds all the sums.第18至22行:这将循环遍历两个列表中的所有数据(在本例中为t和v),并将所有和相加。
- Ignore line 23 — that was left over from a different way to calculate this.忽略第23行-这是通过其他方式计算得出的结果。
- Line 25–27: Calculate and print the two coefficients.第25–27行:计算并打印两个系数。
- Line 30–31: Plot the actual data points.第30–31行:绘制实际数据点。
- Line 33–38: Plot a line for best fit line.第33–38行:绘制一条线以达到最佳拟合线。
Boom. That’s it. It looks like it works. Here is the full code.
繁荣。 而已。 看起来不错。 这是完整的代码 。

TL;DR
TL; DR
Oh, you just want to get this to work in Glowscript. Here is a version that should work. The key is to put this function at the beginning of your code.
哦,您只想在Glowscript中使用它即可。 这是应该工作的版本。 关键是将此功能放在代码的开头。
def fitstuff(x,y): #this function takes two lists of data #returns A and B #where y = A + Bx #just to be clear - B is the slope. N=len(x) sumx=0 sumx2=0 sumxy=0 sumy=0 for j in range(N): sumx=sumx+x[j] sumx2=sumx2+x[j]**2 sumxy=sumxy+x[j]*y[j] sumy=sumy+y[j] B =(N*sumxy-sumx*sumy)/(N*sumx2-sumx**2) A=(sumy-B*sumx)/N return(A,B)If you want to give it a name other than fitstuff — well, I guess that would be OK.
如果您想给它起一个不同于fitstuff的名称,那么,我想那可以。
Now, to use this you would just put something like this in your code.
现在,要使用此功能,只需在代码中放入类似的内容。
A,B=fitstuff(t,v)print("A = ",A,", B = ",B)That works. It does the same thing as the previous program. However, you use whatever data you want and still get a linear fit. Also, I sort of like this better than the numpy version since you can see exactly what’s going on.
这样可行。 它与以前的程序具有相同的作用。 但是,您可以使用所需的任何数据,并且仍然可以线性拟合。 另外,我比numpy版本更喜欢这种方式,因为您可以确切地看到发生了什么。
Homework
家庭作业
Just for fun.
纯娱乐。
- There are other ways to find a least squares fit. This method finds the difference in just the vertical direction. What about a difference in the x-direction? What about shortest distance (perpendicular distance) to the line.还有其他方法可以找到最小二乘拟合。 此方法仅在垂直方向上找到差异。 那么x方向的差异呢? 到线的最短距离(垂直距离)呢?
- Try some data and find the parameters with a least squares fit (like with this program). Does MS Excel give the same values with its “trendline” function? What about Google Sheets?尝试一些数据,并找到最小二乘拟合的参数(类似于此程序)。 MS Excel的“趋势线”功能是否提供相同的值? 那Google表格呢?
- Here’s the one I want to do myself. What about a program that just picks a linear function and finds the sum of the squares of differences. It then changes the slope and the intercept to see if this sum gets smaller. This would be a numerical method to finding these coefficients. It would be fun.这是我想自己做的。 只是选择一个线性函数并求出差平方和的程序呢? 然后,它更改斜率和截距以查看该和是否变小。 这将是找到这些系数的数值方法。 会很好玩的。
翻译自: https://medium.com/swlh/building-linear-regression-in-python-75a429b0d3ba
http://www.taodudu.cc/news/show-4856909.html
相关文章:
- 人工智能论文术语集9
- 梯度下降算法与Normal equation
- 【Machine Learning】【Andrew Ng】- notes(Week 2: Computing Parameters Analytically)
- 吴恩达机器学习(第2周--Computing Parameters Analytically)
- Andrew NG 《machine learning》week 2,class3 —Computing Parameter Analytically
- Machine Learning:Computing Parameters Analytically
- Stochastically Stable Negativity for Analytically Linear Subalgebras——ShaneZhang
- Computing Parameters Analytically
- 怎么把一张暗的照片调亮_照片太暗怎么处理?教你使用美图秀秀提高照片亮度...
- 寻仙获取目录服务器信息失败,〖寻仙〗常见游戏问题解决办法!
- 网吧免费上从概念到实践
- 网吧技术主管工作经验
- 以点带面,全面解决现有问题的网吧路由器解决方案(转)
- 从入门到精通 网吧免费上网狙击战(转)
- 混合高斯模型(GMM)
- 高斯模型混合模型–理论上可以拟合任意概率密度分布
- 数学基础-高斯模型
- SOMEIP传输层协议 TCP UDP协议选择
- 【计算机网络】TCPUDP区别、TCP可靠、UDP不可靠
- tcp udp http ftp 的区别
- TCP/UDP/Socket 通俗讲解
- 端口开放,ubuntu开放指定端口 包括TCP UDP
- 《无线通信与网络》tcp udp 对比_TCP与UDP究竟谁更可靠?
- 笔记1- HP小型机中内存的概念及查看
- HP小型机多种修改主机IP的方法
- 计算机主机有哪些软胶,小型台式机推荐介绍
- HP小型机MP简易使用手册
- 关于HP小型机的网络配置问题
- 服务器型号惠普RX3600,HP RX2800 I2机架式小型机服务器使用说明
- hp小型机日常设备维护检查
在python中建立线性回归相关推荐
- python 线性回归模型_如何在Python中建立和训练线性和逻辑回归ML模型
python 线性回归模型 Linear regression and logistic regression are two of the most popular machine learning ...
- 如何在Python中建立和训练K最近邻和K-Means集群ML模型
One of machine learning's most popular applications is in solving classification problems. 机器学习最流行的应 ...
- python中如何画logistic_如何在 Python 中建立和训练线性和 logistic 回归 ML 模型?
原标题:如何在 Python 中建立和训练线性和 logistic 回归 ML 模型? 英语原文: 翻译:(Key.君思) 线性回归与logistic回归,是. 在我的里,你们已经学习了线性回归机器学 ...
- python计算均方根误差_如何在Python中创建线性回归机器学习模型?「入门篇」
线性回归和逻辑回归是当今很受欢迎的两种机器学习模型. 本文将教你如何使用 scikit-learn 库在Python中创建.训练和测试你的第一个线性.逻辑回归机器学习模型,本文适合大部分的新人小白. ...
- 如何在Python中建立回归模型
数据科学 (DATA SCIENCE) If you are an aspiring data scientist or a veteran data scientist, this article ...
- Python中的线性回归:Sklearn与Excel
内部AI (Inside AI) Around 13 years ago, Scikit-learn development started as a part of Google Summer of ...
- python创建长度为n的数组_在Python中建立N维数组并赋初值
在Python中,由于不像C++/Java这样的语言可以方便的用a[i][j]=0的方式,建立二维数组并赋初值,所以需要一个相对巧妙的方法. 可以用列表解析的方式,eg: >>> m ...
- python中计算均方误差_在python中查找线性回归的均方误差(使用scikit-learn)
我试图在python中做一个简单的线性回归,其中x变量是单词 项目描述的计数,Y值是以天为单位的融资速度. 我有点困惑,因为测试的均方根误差(rmse)是13.77. 培训数据为13.88.首先,RM ...
- Python 学习系列(4) 在Python中建立N维数组并赋初值
在Python中,由于不像C++/Java这样的语言可以方便的用a[i][j]=0的方式,建立二维数组并赋初值,所以需要一个相对巧妙的方法. 可以用列表解析的方式,eg: >>> m ...
最新文章
- 用AlphaGo设计材料合成实验
- django(权限、认证)系统—— 基于Authentication backends定制
- Android Studio2.0 教程从入门到精通Windows版
- 平衡二叉树及其操作实现_平衡二叉树(AVL树)及C语言实现
- 使用命令行对Android应用签名
- python网页版_经典python学习教程:20行代码打造一个微信群聊助手,解放双手
- c语言数组移动k,如何将一个数组的元素循环左移?
- 100款违法违规APP下架整改:微店、更美等在列
- https open api_通过bilibili_api获取弹幕+绘制词云的方法
- java map操作_Java HashMap的基本操作
- java常用的日期类介绍
- git常用命令与常见错误
- python定义私有变量的方法_Python中私有属性的定义方式
- python无头浏览器兼容问题_docker+python无头浏览器爬虫
- 17讲项目实战签证页面
- 如何在TOMCAT上安装Liferay
- 如何区分集线器、交换机、路由器呢
- git时出现rejected
- 实现redis连接池以及管道
- 无痕埋点在Android中的实现
