python自动化数据报告_如何:使用Python将实时数据自动化到您的网站
python自动化数据报告
This tutorial will be helpful for people who have a website that hosts live data on a cloud service but are unsure how to completely automate the updating of the live data so the website becomes hassle free. For example: I host a website that shows Texas COVID case counts by county in an interactive dashboard, but everyday I had to run a script to download the excel file from the Texas COVID website, clean the data, update the pandas data frame that was used to create the dashboard, upload the updated data to the cloud service I was using, and reload my website. This was annoying, so I used the steps in this tutorial to show how my live data website is now totally automated.
对于拥有在云服务上托管实时数据的网站但不确定如何完全自动化实时数据更新的网站的人来说,本教程将非常有用。 例如:我托管了一个网站 ,该网站在交互式仪表板上显示按县分类的德克萨斯州COVID病例数,但是每天我必须运行脚本以从德克萨斯州COVID网站下载excel文件,清理数据,更新以前的熊猫数据框。用于创建仪表板,将更新的数据上传到我正在使用的云服务,然后重新加载我的网站。 这很烦人,所以我使用了本教程中的步骤来展示我的实时数据网站现在是如何完全自动化的。
I will only be going over how to do this using the cloud service pythonanywhere, but these steps can be transferred to other cloud services. Another thing to note is that I am new to building and maintaining websites so please feel free to correct me or give me constructive feedback on this tutorial. I will be assuming that you have basic knowledge of python, selenium for web scraping, bash commands, and you have your own website. Lets go through the steps of automating live data to your website:
我将只讨论如何使用pythonanywhere的云服务来执行此操作,但是这些步骤可以转移到其他云服务。 要注意的另一件事是,我是网站建设和维护的新手,请随时纠正我或对本教程给我有建设性的反馈。 我假设您具有python的基本知识,用于网络抓取的Selenium,bash命令,并且您拥有自己的网站。 让我们完成将实时数据自动化到您的网站的步骤:
- web scraping with selenium using a cloud service使用云服务使用Selenium进行Web抓取
- converting downloaded data in a .part file to .xlsx file将.part文件中的下载数据转换为.xlsx文件
- re-loading your website using the os python package使用os python软件包重新加载您的网站
- scheduling a python script to run every day in pythonanywhere安排python脚本每天在pythonanywhere中运行
I will not be going through some of the code I will be showing because I use much of the same code from my last tutorial on how to create and automate an interactive dashboard using python found here. Lets get started!
我将不会看过将要显示的一些代码,因为我使用了上一篇教程中的许多相同代码,它们是关于如何使用此处找到的python创建和自动化交互式仪表板的。 让我们开始吧!
web scraping with selenium using a cloud service
使用云服务使用Selenium进行Web抓取
So in your cloud service of choice (mine being pythonanywhere), open up a python3.7 console. I will be showing the code in chunks but all the code can be combined into one script which is what I have done. Also, all the file paths in the code you will have to change to your own for the code to work.
因此,在您选择的云服务(我的网站是pythonanywhere)中,打开一个python3.7控制台。 我将分块显示代码,但是所有代码都可以组合成一个脚本,这就是我所做的。 同样,您必须将代码中的所有文件路径更改为自己的路径,代码才能正常工作。
from pyvirtualdisplay import Displayfrom selenium import webdriverimport timefrom selenium.webdriver.chrome.options import Optionswith Display(): # we can now start Firefox and it will run inside the virtual display browser = webdriver.Firefox()# these options allow selenium to download files options = Options() options.add_experimental_option("browser.download.folderList",2) options.add_experimental_option("browser.download.manager.showWhenStarting", False) options.add_experimental_option("browser.helperApps.neverAsk.saveToDisk", "application/octet-stream,application/vnd.ms-excel")# put the rest of our selenium code in a try/finally # to make sure we always clean up at the end try: browser.get('https://www.dshs.texas.gov/coronavirus/additionaldata/')# initialize an object to the location on the html page and click on it to download link = browser.find_element_by_xpath('/html/body/form/div[4]/div/div[3]/div[2]/div/div/ul[1]/li[1]/a') link.click()# Wait for 30 seconds to allow chrome to download file time.sleep(30)print(browser.title) finally: browser.quit()In the chunk of code above, I open up a Firefox browser within pythonanywhere using their pyvirtualdisplay library. No new browser will pop on your computer since its running on the cloud. This means you should test out the script on your own computer without the display() function because error handling will be difficult within the cloud server. Then I download an .xlsx file from the Texas COVID website and it saves it in my /tmp file within pythonanywhere. To access the /tmp file, just click on the first “/” of the files tab that proceeds the home file button. This is all done within a try/finally blocks, so after the script runs, we close the browser so we do not use any more cpu time on the server. Another thing to note is that pythonanywhere only supports one version of selenium: 2.53.6. You can downgrade to this version of selenium using the following bash command:
在上面的代码中,我使用pyanytdisplaydisplay库在pythonanywhere中打开了Firefox浏览器。 自从它在云上运行以来,没有新的浏览器会在您的计算机上弹出。 这意味着您应该在没有display()函数的情况下在自己的计算机上测试脚本,因为在云服务器中错误处理将很困难。 然后,我从Texas COVID网站下载.xlsx文件,并将其保存在pythonanywhere中的/ tmp文件中。 要访问/ tmp文件,只需单击文件选项卡的第一个“ /”,然后单击主文件按钮即可。 这都是在try / finally块中完成的,因此在脚本运行之后,我们关闭浏览器,因此我们不再在服务器上使用更多的CPU时间。 要注意的另一件事是pythonanywhere仅支持一个Selenium版本: 2.53.6。 您可以使用以下bash命令降级到该版本的Selenium:
pip3.7 install --user selenium==2.53.62. converting downloaded data in a .part file to .xlsx file
2. 将.part文件中的下载数据转换为.xlsx文件
import shutilimport globimport os# locating most recent .xlsx downloaded filelist_of_files = glob.glob('/tmp/*.xlsx.part')latest_file = max(list_of_files, key=os.path.getmtime)print(latest_file)# we need to locate the old .xlsx file(s) in the dir we want to store the new xlsx file inlist_of_files = glob.glob('/home/tsbloxsom/mysite/get_data/*.xlsx')print(list_of_files)# need to delete old xlsx file(s) so if we download new xlsx file with same name we do not get an error while moving itfor file in list_of_files: print("deleting old xlsx file:", file) os.remove(file)# move new data into data dirshutil.move("{}".format(latest_file), "/home/tsbloxsom/mysite/get_data/covid_dirty_data.xlsx")When you download .xlsx files in pythonanywhere, they are stored as .xlsx.part files. After some research, these .part files are caused when you stop a download from completing. These .part files cannot be opened with typical tools but there is a easy trick around this problem. In the above code, I automate moving the new data and deleting the old data in my cloud directories. The part to notice is that when I move the .xlsx.part file, I save it as a .xlsx file. This converts it magically, and when you open this new .xlsx file, it has all the live data which means that my script did download the complete .xlsx file but pythonanywhere adds a .part to the file which is weird but hey it works.
当您在pythonanywhere中下载.xlsx文件时,它们将存储为.xlsx.part文件。 经过研究,这些.part文件是在您停止下载完成时引起的。 这些.part文件无法使用典型工具打开,但是可以解决此问题。 在上面的代码中,我自动移动了新数据并删除了云目录中的旧数据。 需要注意的部分是,当我移动.xlsx.part文件时,我将其另存为.xlsx文件。 这会神奇地进行转换,当您打开这个新的.xlsx文件时,它具有所有实时数据,这意味着我的脚本确实下载了完整的.xlsx文件,但是pythonanywhere向该文件中添加了.part很奇怪,但嘿,它起作用了。
3. re-loading your website using the os python package
3.使用os python软件包重新加载您的网站
import pandas as pdimport relist_of_files = glob.glob('/home/tsbloxsom/mysite/get_data/*.xlsx')latest_file = max(list_of_files, key=os.path.getctime)print(latest_file)df = pd.read_excel("{}".format(latest_file),header=None)# print out latest COVID data datetime and notesdate = re.findall("- [0-9]+/[0-9]+/[0-9]+ .+", df.iloc[0, 0])print("COVID cases latest update:", date[0][2:])print(df.iloc[1, 0])#print(str(df.iloc[262:266, 0]).lstrip().rstrip())#drop non-data rowsdf2 = df.drop([0, 1, 258, 260, 261, 262, 263, 264, 265, 266, 267])# clean column namesdf2.iloc[0,:] = df2.iloc[0,:].apply(lambda x: x.replace("\r", ""))df2.iloc[0,:] = df2.iloc[0,:].apply(lambda x: x.replace("\n", ""))df2.columns = df2.iloc[0]clean_df = df2.drop(df2.index[0])clean_df = clean_df.set_index("County Name")clean_df.to_csv("/home/tsbloxsom/mysite/get_data/Texas county COVID cases data clean.csv")df = pd.read_csv("Texas county COVID cases data clean.csv")# convert df into time series where rows are each date and clean updf_t = df.Tdf_t.columns = df_t.iloc[0]df_t = df_t.iloc[1:]df_t = df_t.iloc[:,:-2]# next lets convert the index to a date time, must clean up dates firstdef clean_index(s): s = s.replace("*","") s = s[-5:] s = s + "-2020" #print(s) return sdf_t.index = df_t.index.map(clean_index)df_t.index = pd.to_datetime(df_t.index)# initalize df with three columns: Date, Case Count, and Countyanderson = df_t.T.iloc[0,:]ts = anderson.to_frame().reset_index()ts["County"] = "Anderson"ts = ts.rename(columns = {"Anderson": "Case Count", "index": "Date"})# This while loop adds all counties to the above ts so we can input it into plotlyx = 1while x < 254: new_ts = df_t.T.iloc[x,:] new_ts = new_ts.to_frame().reset_index() new_ts["County"] = new_ts.columns[1] new_ts = new_ts.rename(columns = {new_ts.columns[1]: "Case Count", "index": "Date"}) ts = pd.concat([ts, new_ts]) x += 1ts.to_csv("/home/tsbloxsom/mysite/data/time_series_plotly.csv")time.sleep(5)#reload website with updated dataos.utime('/var/www/tsbloxsom_pythonanywhere_com_wsgi.py')Most of the above code I explained in my last post which deals with cleaning excel files using pandas for inputting into a plotly dashboard. The most important line for this tutorial is the very last one. The os.utime function shows access and modify times of a file or python script. But when you call the function on your Web Server Gateway Interface (WSGI) file it will reload your website!
我在上一篇文章中解释了上面的大多数代码,其中涉及使用熊猫清理excel文件并输入到绘图仪表板。 本教程最重要的一行是最后一行。 os.utime函数显示文件或python脚本的访问和修改时间。 但是,当您在Web服务器网关接口(WSGI)文件上调用该函数时,它将重新加载您的网站!
4. scheduling a python script to run every day in pythonanywhere
4.计划每天在pythonanywhere中运行的python脚本
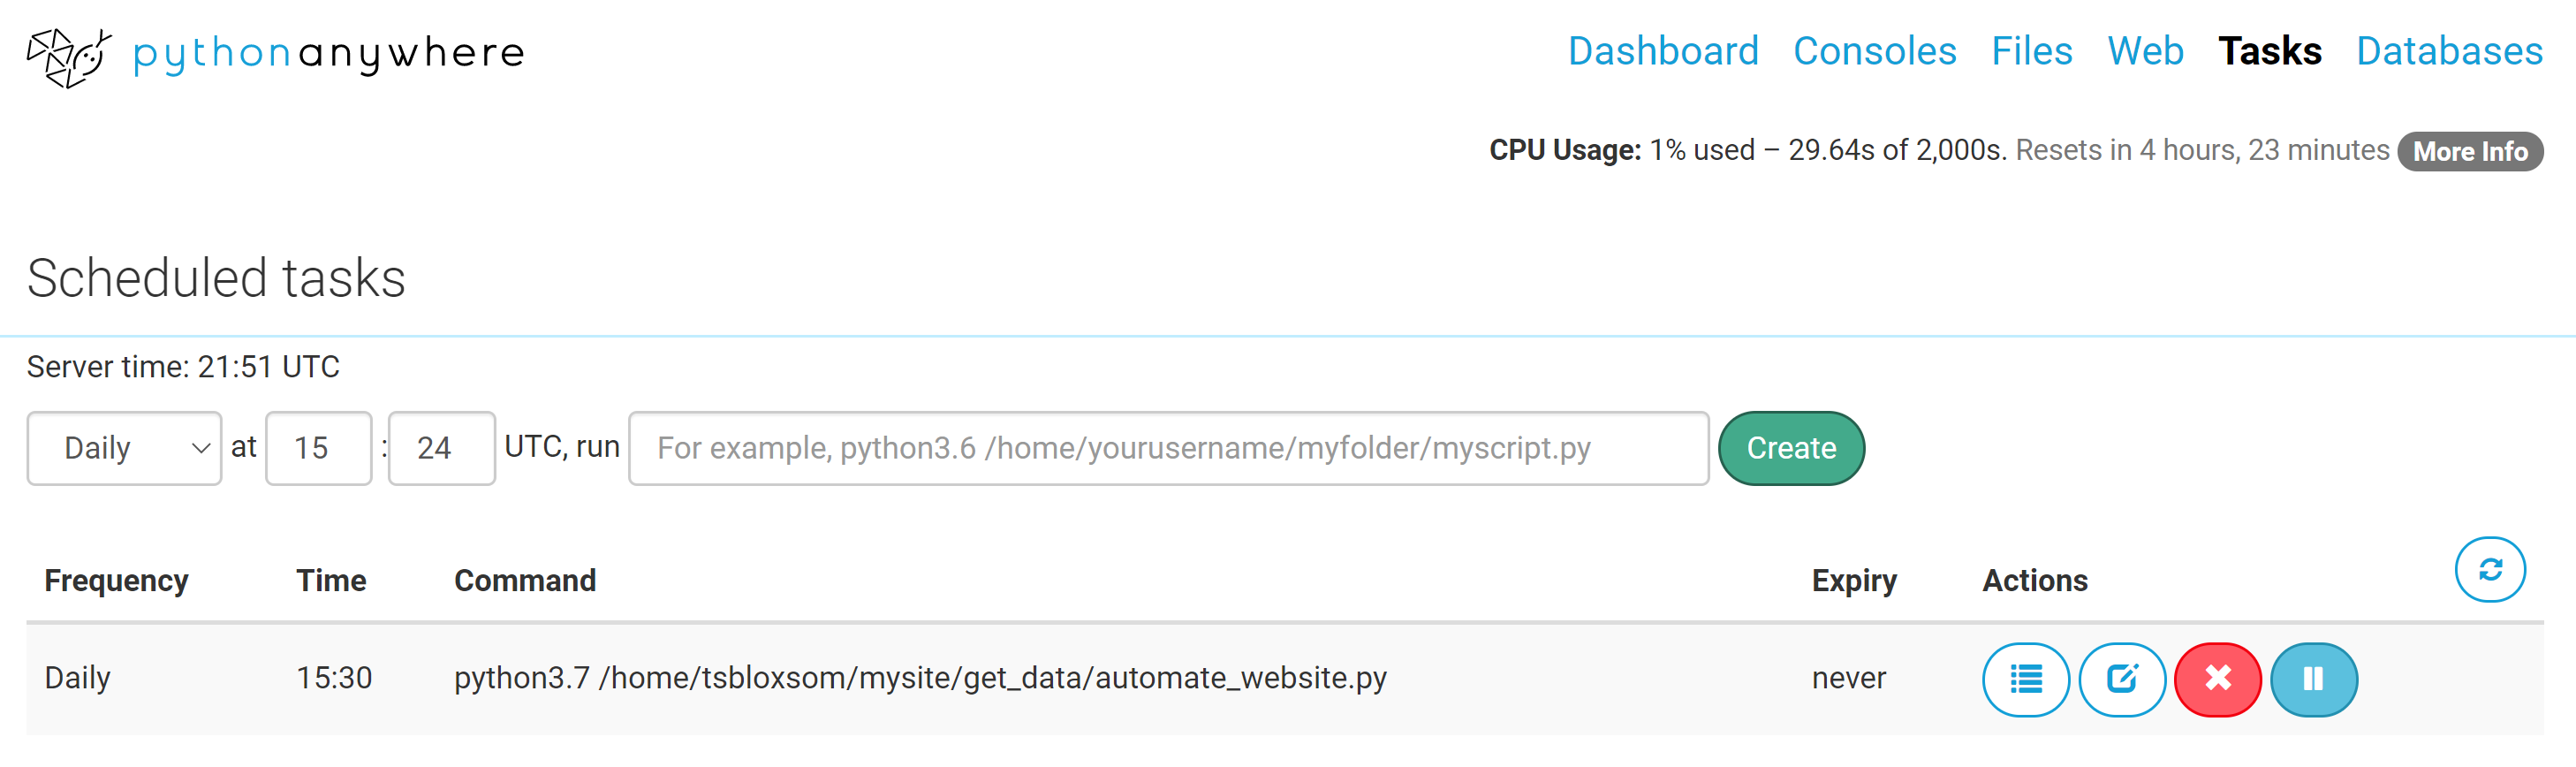
Now for the easy part! After you combine the above code into one .py file, you can make it run every day or hour using pythonanywhere’s Task tab. All you do is copy and paste the bash command, with the full directory path, you would use to run the .py file into the bar in the image above and hit the create button! Now you should test the .py file using a bash console first to see if it runs correctly. But now you have a fully automated data scraping script that your website can use to have daily or hourly updated data displayed without you having to push one button!
现在简单一点! 将以上代码组合成一个.py文件后,您可以使用pythonanywhere的“任务”标签使它每天或每小时运行一次。 您要做的就是复制并粘贴带有完整目录路径的bash命令,您将使用该命令将.py文件运行到上图中的栏中,然后单击“创建”按钮! 现在,您应该首先使用bash控制台测试.py文件,以查看其是否正常运行。 但是现在您有了一个全自动的数据抓取脚本,您的网站可以使用它来显示每日或每小时的更新数据,而无需按一个按钮!
If you have any questions or critiques please feel free to say so in the comments and if you want to follow me on LinkedIn you can!
如果您有任何疑问或批评,请随时在评论中说,如果您想在LinkedIn上关注我,可以!
翻译自: https://towardsdatascience.com/how-to-automate-live-data-to-your-website-with-python-f22b76699674
python自动化数据报告
http://www.taodudu.cc/news/show-997571.html
相关文章:
- 学习深度学习需要哪些知识_您想了解的有关深度学习的所有知识
- 置信区间估计 预测区间估计_估计,预测和预测
- 地图 c-suite_C-Suite的模型
- sap中泰国有预扣税设置吗_泰国餐厅密度细分:带有K-means聚类的python
- 傅里叶变换 直观_A / B测试的直观模拟
- 鸽子 迷信_人工智能如何帮助我战胜鸽子
- scikit keras_Scikit学习,TensorFlow,PyTorch,Keras…但是天秤座呢?
- 数据结构两个月学完_这是我作为数据科学家两年来所学到的
- 迈向数据科学的第一步:在Python中支持向量回归
- 使用Python和MetaTrader在5分钟内开始构建您的交易策略
- ipywidgets_未来价值和Ipywidgets
- 用folium模块画地理图_使用Folium表示您的地理空间数据
- python创建类统计属性_轻松创建统计数据的Python包
- knn分类 knn_关于KNN的快速小课程
- 机器学习集群_机器学习中的多合一集群技术在无监督学习中应该了解
- 政府公开数据可视化_公开演讲如何帮助您设计更好的数据可视化
- 消费者行为分析_消费者行为分析-是否点击广告?
- 魅族mx5游戏模式小熊猫_您不知道的5大熊猫技巧
- 数据科学中的数据可视化
- 多重线性回归 多元线性回归_了解多元线性回归
- 如何使用Python处理丢失的数据
- 为什么印度盛产码农_印度农产品价格的时间序列分析
- tukey检测_回到数据分析的未来:Tukey真空度的整洁实现
- 到2025年将保持不变的热门流行技术
- 马尔科夫链蒙特卡洛_蒙特卡洛·马可夫链
- 数据分布策略_有效数据项目的三种策略
- 密度聚类dbscan_DBSCAN —基于密度的聚类方法的演练
- 从完整的新手到通过TensorFlow开发人员证书考试
- 移动平均线ma分析_使用动态移动平均线构建交互式库存量和价格分析图
- 静态变数和非静态变数_统计资料:了解变数
python自动化数据报告_如何:使用Python将实时数据自动化到您的网站相关推荐
- 二分法python上机实验报告_二分查找-Python刷题笔记
二分搜索是一种在有序数组中查找某一特定元素的搜索算法. 二分查找示意图 搜索过程从数组的中间元素开始,如果中间元素正好是要查找的元素,则搜索过程结束:如果某一特定元素大于或者小于中间元素,则在数组大于 ...
- python+selenium+phantomJS爬取国家地表水水质自动监测实时数据发布系统——动态网页爬虫
一.关于phantomjs 1.介绍 PhantomJS是一个为自动化而生的利器,它本质上是一个基于webkit内核的无界面浏览器,并可使用JavaScript或CoffeeScript进行编程.由于 ...
- 数据可视化分析票房数据报告_票房收入分析和可视化
数据可视化分析票房数据报告 Welcome back to my 100 Days of Data Science Challenge Journey. On day 4 and 5, I work ...
- 数据科学家数据分析师_站出来! 分析人员,数据科学家和其他所有人的领导和沟通技巧...
数据科学家数据分析师 这一切如何发生? (How did this All Happen?) As I reflect on my life over the past few years, even ...
- 【数据架构】Netflix 万亿级实时数据基础架构的四个创新阶段
我叫徐振中.我于 2015 年加入 Netflix,担任实时数据基础架构团队的创始工程师,后来领导了流处理引擎团队.我在 2010 年代初对实时数据产生了兴趣,从那时起我就相信还有很多价值有待发掘. ...
- python获取excel数据制作有文字和图表的报告_如何用Python绘制学术报告图表?
原标题:如何用Python绘制学术报告图表? 作者:ExcelTing 原文:http://cnblogs.com/excelting/p/6507680.html 全文约 3581 字,读完可能需要 ...
- python电影数据分析报告_【python数据分析实战】电影票房数据分析(二)数据可视化...
在上一部分<[python数据分析实战]电影票房数据分析(一)数据采集> 已经获取到了2011年至今的票房数据,并保存在了mysql中. 本文将在实操中讲解如何将mysql中的数据抽取出来 ...
- python 支付宝个人账单_解析2018年度三大用户数据报告——网易云音乐、支付宝、微信...
文章分别给大家简单的解析一下2018年度网易云音乐.支付宝.微信的用户数据报告. 继网易云音乐.支付宝相继发布2018年用户数据报告后,微信也悄悄发布自己的数据报告,截止目前大家期待的三大产品数据报告 ...
- python主成分分析实验报告_主成分分析案例1-Python数据科学技术详解与商业项目实战精讲 - Python学习网...
主成分分析案例1主成分分析案例1 查找并更新 在取出数据后,更改字段内容后使用save方法更新数据.这种方式是最佳的更新方式.$user = User::find(1); $user->name ...
最新文章
- 熬了几个大夜,学完一套985博士总结的「卷积神经网络、目标检测、OpenCV」学习笔记(20G高清/PPT/代码)...
- ajax 和xmlHttpRequest区别
- 用Alpha生成Trimp图的方法(python)
- 几个值得收藏的国外有关Vue.js网站
- 【转】crontab 详解
- 超级马里奥游戏像素素材_《超级马里奥3D世界+库巴之怒》游戏文件尺寸相当小...
- myeclipse mysql 乱码_MyEclipse与mysql增改查现乱码解决方案绝对有效
- 分别写出引入CSS的3种方式, 特点, 优先级
- android打开相机拍照及打开相册选择照片
- android之自定义弹框
- jQuery 5 条件选择器
- 比较ole db/odbc/ado/ado.net/jdbc
- PDF怎么打印?为什么有时选择打印没有反应?
- 中西方对时间的差异_中西文化的差异-2 时间观
- 执行款不足以清偿全部债务时应当如何抵充
- BW项目随手记:SAP 采购单位和基本计量单位转换关系
- [BZOJ3238] [AHOI2013] 差异 - 后缀自动机
- java简单搭建分布式架构
- iOS开源库–最全的整理
- 编程之美--游戏之乐--1.3一摞烙饼的排序