logistic 回归_具有Logistic回归的优秀初学者项目
logistic 回归
Welcome to this friendly beginner’s guide to creating a logistic regression model for classification in python!
欢迎使用这个友好的初学者指南,以在python中创建用于分类的逻辑回归模型!
With this guide I want to give you an easy way to complete your first data science project by creating a logistic regression machine learning model used for classification. I will explain all the steps thoroughly to make sure that you know what is going on. We will be working with a very famous and known data set originating from 1936. I have used Google Colab to write the code.
通过本指南,我想通过创建用于分类的逻辑回归机器学习模型 ,为您提供一个简单的方法来完成您的第一个数据科学项目。 我将彻底解释所有步骤, 以确保您了解正在发生的事情 。 我们将使用源自1936年的非常著名的已知数据集进行工作。我使用Google Colab编写了代码。
The article consists of the following steps:
本文包括以下步骤:
- Introduction to the data数据介绍
- Binary- vs multiclass classification (an explanation)二进制-多类分类(说明)
- Importing the data导入数据
- Splitting the data into training and test data将数据分为训练和测试数据
- Scaling the training and test data扩展训练和测试数据
- Building and training the logistic regression for classification model建立和训练分类模型的逻辑回归
- Evaluating the results评估结果
Conclusion and bye byes
结论和再见
I will be showing all the code, and also provide a strong explanation at each step. Sounds good?- Lets do it!
我将展示所有代码,并在每个步骤中都提供有力的解释。 听起来不错?-让我们开始吧!
数据介绍 (Introduction to the data)
The data can be found here. You will be directed to at Kaggle site (see photo below. I have highlighted the download button in yellow). After downloading the file I have renamed it to dataset_iris.csv.
数据可以在这里找到。 您将被带到Kaggle网站(见下图。我以黄色突出显示了下载按钮)。 下载文件后,我将其重命名为dataset_iris.csv 。
The dataset consists of 150 entries of data about iris plants. There are exactly 50 of each type of iris described in the data. The data points for each flower are:
该数据集包含有关虹膜植物的150个数据条目。 数据中描述的每种类型的虹膜正好有50种。 每朵花的数据点是:
- SepalLengthCmSepalLengthCm
- SepalWidthCmSepalWidthCm
- PetalLengthCm花瓣长度
- PetalWidthCm花瓣宽度
- Species种类
In total we have 4 variables (1 to 4) that have an influence on which species of plant a given plant might be. In machine learning terms these variables are called features. The final variable (5) is called a label, and it is the label/species that we would like to predict.
总共我们有4个变量(1到4),这些变量会影响给定植物可能属于哪种植物。 用机器学习术语,这些变量称为功能。 最终变量(5)称为标签,它是我们希望预测的一个或多个标签 。
These are the 20 first rows of the data for you to familiarize with.
这些是您要熟悉的数据的前20行。
二进制与多类分类 (Binary- vs multiclass classification)
For this project you will be creating a logistic regression model for classification. To make the logistic regression model work as a classification model we have to apply a small trick (don’t worry it won’t be difficult). Classification problems can be divided into two categories, binary- and multiclass. The first is a classification problem where the outcome is limited to two different classes. This could be yes or no classifications. Will the customer buy the product or not? Whereas the latter is a classification problem where the outcome can be more than 2 classes, as in the case of this project where we have 3 different classes of plants.
对于此项目,您将创建用于分类的逻辑回归模型。 为了使逻辑回归模型可以用作分类模型,我们必须应用一个小技巧(不要担心这不会很困难)。 分类问题可以分为两类,二类和多类。 第一个是分类问题,其中结果仅限于两个不同的类别。 这可以是是或否的分类。 客户是否会购买产品? 后者是一个分类问题,其结果可能超过两个类别,例如在该项目中,我们有3种不同类别的植物。
Often logistic regression is not used for classification problems, and there are other models that can naturally do classifications. However, the logistic model is very common and a good model to get familiar with, which is why I have chosen to implement it here anyway. And it does indeed work, we just have to provide the model with a small power up.
通常,逻辑回归不用于分类问题,还有其他一些自然可以进行分类的模型。 但是,逻辑模型非常普遍,并且是一个很好的熟悉模型,因此无论如何我都选择在这里实现它。 它确实有效,我们只需要为模型提供少量电源即可。
Alright, enough talking already, let’s code!Each code snippet will be followed with an explanation of what just happened.
好了,已经说够了,让我们编写代码!每个代码段后面都将出现一个解释。
导入数据 (Importing the data)
import pandas as pddataset = pd.read_csv('dataset_iris.csv')dataset.head()We need the pandas library to get access to the data and we import it to a variable called pd.
我们需要pandas库来访问数据,并将其导入到名为pd的变量中。
pd (pandas) has a function called read_csv() which allows us to read data from a comma separated file, and it returns a DataFrame which we save to a variable that we call dataset.
pd (pandas)具有一个称为read_csv()的函数,该函数使我们能够从逗号分隔的文件中读取数据,并且它返回一个DataFrame,我们将其保存到一个称为数据集的变量中。
A pandas DataFrame has a function called head() which displays the first 5 entries in the DataFrame. (See output photo).
熊猫DataFrame具有一个名为head()的函数,该函数显示DataFrame中的前5个条目。 (请参见输出照片)。
Now we have all the data saved in a DataFrame format next we will divide the data into features and labels (remember the features are the independent variables that influence the dependent variable called the label).
现在我们将所有数据保存为DataFrame格式,接下来将数据分为要素和标签(请记住,要素是会影响称为标签的因变量的自变量)。
x = dataset.iloc[:, 1:-1].valuesy = dataset.iloc[:, -1].valuesprint(x[:10])print(y[:10])We can access different rows and columns of a DataFrame by using iloc followed by the index of the rows and columns we want, and finally appending .values to get the actual values. We save this to variables x and y.
我们可以使用iloc以及所需的行和列的索引,最后附加.values以获得实际值,从而访问DataFrame的不同行和列。 我们将其保存到变量x和y。
- x now contains 150 rows of features. We see the 10 first rows in the output photo.x现在包含150行要素。 我们在输出照片中看到前10行。
- y now contains the 150 corresponding species/labels. We see the first 10 labels in the output photo.y现在包含150个相应的种类/标签。 我们会在输出照片中看到前10个标签。
We have two more steps to complete before we are ready to create and train our model, let’s do those now!
在准备创建和训练模型之前,我们还有两个步骤需要完成,现在就开始做吧!
将数据分为训练和测试数据 (Splitting the data into training and test data)
from sklearn.model_selection import train_test_splitx_train, x_test, y_train, y_test = train_test_split(x, y, test_size = 0.2, random_state = 0)From the scikit-learn library (called sklearn. You will meet sklearn many times!) and model_selection we import train_test_split.
从scikit-learn库(称为sklearn 。您将多次遇到sklearn !)和model_selection,我们导入train_test_split。
train_test_split allows us to split our data intro training data and test data. It takes 4 parameters: the features (x), the labels (y), test_size (what fraction of the data should become test data) and finally random_state (put any number here, but use 0 to get same results as me).
train_test_split允许我们拆分数据入门培训数据和测试数据。 它包含4个参数: 功能 (x), 标签 (y), test_size (数据的小部分应成为测试数据),最后是random_state (在此处输入任何数字,但使用0可获得与我相同的结果)。
Why do we split the data?When we train a model with data it will get familiar with that data and be able to make perfect predictions when it is introduced to the same data again. It won’t be a lot of fun to only use the model on data it has already seen as we do not want to predict things we already know! Therefore, we split the data and first introduce the test data to the model when it is time to test our models performance.
我们为什么要拆分数据? 当我们使用数据训练模型时,它将熟悉该数据,并在再次将其引入相同数据时能够做出完美的预测。 仅对已经看到的数据使用该模型并不会带来很多乐趣,因为我们不想预测我们已经知道的事情! 因此,我们拆分数据,并在需要测试模型性能时首先将测试数据引入模型。
Now to the final step before making the model…
现在到制作模型的最后一步...
缩放数据 (Scaling the data)
We need to scale the data through a method called standardization. (don’t worry about how it works right now, that is a topic for another day). Standardization will scale the values of the features so that almost all of them are in the range of -1 to 1. Some machine learning models are sensitive to whether or not data has been scaled, and logistic regression is one such model. As an example: If we do not scale the data the model might consider 2000m larger than 3km. Scaling will help us get rid of this problem.
我们需要通过一种称为标准化的方法来缩放数据。 (不要担心它现在如何工作,这是另一天的话题)。 标准化将缩放功能部件的值,以便几乎所有功能部件的值都在-1到1的范围内。某些机器学习模型对是否已缩放数据很敏感,而逻辑回归就是这样一种模型。 例如:如果我们不缩放数据,则模型可能会考虑比3km大2000m。 扩展将帮助我们摆脱这个问题。
from sklearn.preprocessing import StandardScalersc = StandardScaler()x_train = sc.fit_transform(x_train)x_test = sc.transform(x_test)We import the StandardScaler class from sklearn.preprocessing.
我们从sklearn.preprocessing导入StandardScaler类。
We create an instance of StandardScaler and call it sc.
我们创建StandardScaler的实例,并将其称为sc。
We call the fit_transform() method from sc, which both fits the scaler to the data and simultaneously scales the training data returning it to the x_train variable.
我们从sc调用fit_transform()方法, 这既使缩放器适合数据,又同时缩放训练数据并将其返回给x_train变量。
Lastly we also scale the test data. At this point the scaler is already fitted to the training data and should therefore not be fitted again. We simply call the transform() method which returns the transformed test data.
最后,我们还扩展了测试数据。 此时,定标器已经安装到训练数据中,因此不应再次安装。 我们只需要调用transform()方法即可返回转换后的测试数据。
- In the output photo after the print statement we can see the first 10 entries of the scaled data. Indeed we can see that the values are mostly between -1 and 1在打印语句后的输出照片中,我们可以看到缩放数据的前10个条目。 实际上,我们可以看到这些值大多在-1和1之间
And now to the step that we have all been waiting for!
现在,我们一直在等待这一步骤!
创建和训练逻辑回归模型 (Creating and training the logistic regression model)
We are now ready to create the logistic regression model for a multiclass problem. Up until now we have: imported the data, split it into training and testing data and lastly scaled the data to make it more suitable for our machine learning model.
现在,我们准备为多类问题创建逻辑回归模型。 到目前为止,我们已经:导入数据,将其分为训练和测试数据,最后缩放数据以使其更适合我们的机器学习模型。
from sklearn.linear_model import LogisticRegressionclassifier = LogisticRegression(multi_class='ovr', random_state = 0)classifier.fit(x_train, y_train)We import LogisticRegression from sklearn.linear_model
我们从sklearn.linear_model导入LogisticRegression
We create an instance of the LogisticRegression class called classifier by calling LogisticRegression(), as parameters we input multi_class=’ovr’ and random_state=0.
我们通过调用LogisticRegression()创建名为classifier的LogisticRegression类的实例,作为参数,我们输入multi_class =' ovr '和random_state = 0 。
multi_class=’ovr’ is the trick I mentioned previously which makes the logistic regression model work in a multiclass scenario. If our problem had simply been binary we would have left this parameter out. Random_state needs any number as input, you can enter 0 to get the same results as me.
multi_class ='ovr'是我之前提到的技巧,它使逻辑回归模型在多类场景中工作。 如果我们的问题只是二进制问题,我们将忽略此参数。 Random_state需要任何数字作为输入,您可以输入0以获得与我相同的结果。
Wow! That was actually it.
哇! 就是这样。
Now lets see how well our model performs.
现在让我们看看我们的模型表现如何。
预测结果 (Predicting results)
from sklearn.metrics import confusion_matrix, accuracy_scorecm = confusion_matrix(predictions, y_test)print(cm)accuracy_score(predictions, y_test)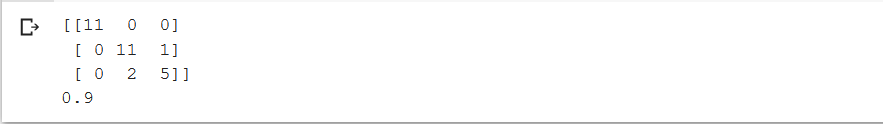
We import confusion_matrix and accuracy_score. They are kind of self explanatory, however, I will comment a bit on them.
我们导入confusion_matrix和precision_score 。 它们有点自我解释,但是,我将对它们进行一些评论。
The confusion_matrix takes two parameters: Our predicted values and the expected values, in this case predictions and y_test. The same applies for the accuracy_score.
confusion_matrix采用两个参数:我们的预测值和期望值,在这种情况下为预测和y_test。 这同样适用于accuracy_score。
We print the confusion_matrix called cm
我们打印出称为cm的confusion_matrix
The accuracy_score automatically prints out its return value
precision_score自动打印出其返回值
结论 (Conclusion)
We can see that our model has an accuracy score of 0.9, which means it is correct 90% of the time!
我们可以看到我们的模型的准确度得分是0.9,这意味着90%的时间是正确的!
Congratulations you have now completed a machine learning and data science project!
恭喜,您现在已经完成了机器学习和数据科学项目!
现在要做什么? (What to do now?)
There are many ways to improve this project! I wanted to keep this guide as simple as possible for everyone to be able to participate. Because of this I have cut some corners and skipped some of the best practices in data science. Normally you would do a lot more data analysis before training the model, like visualizing the data, and also do more work to validate the accuracy of the model. I recommend that you try to complete a project with binary classification as well, so that you master both. Try to do a Google search for linearRegression(multi_class=’ovr’) to completely understand what is going on in this step. Also logistic regression might not be the best machine learning model for this project, I simply chose it because it is so well known and I consider it important to learn. You could try implementing other models in this project and maybe you will achieve better results.
有很多方法可以改善这个项目! 我希望本指南尽可能地简化,以使每个人都能参与。 因此,我偷偷摸摸走了一些数据科学的最佳实践。 通常,在训练模型之前,您会做很多数据分析,例如可视化数据,并且还要做更多工作来验证模型的准确性。 我建议您也尝试使用二进制分类来完成一个项目,这样您就可以同时掌握两者。 尝试在Google中搜索linearRegression(multi_class ='ovr'),以完全了解此步骤中发生的情况。 另外,逻辑回归可能不是该项目的最佳机器学习模型,我之所以选择它是因为它众所周知,我认为学习很重要。 您可以尝试在该项目中实现其他模型,也许会获得更好的结果。
To get better at AI, machine learning and data science I recommend that you keep practicing. This could include reading other guides here on medium, taking a course on udemy or maybe applying to a boot camp, there are many possibilities! If you are interested in avoiding my biggest mistake for yourself, have a look at my article called My biggest mistake learning machine learning.
为了更好地掌握AI,机器学习和数据科学,我建议您继续练习。 这可能包括在媒体上阅读其他指南,参加关于udemy的课程或申请新兵训练营,这里有很多可能性! 如果您有兴趣避免自己遇到最大的错误,请参阅我的文章《 我最大的错误学习机器学习》。
I hope this article has been helpful to you! If you have any questions or comments feel free to reach out to me in the response section below.
希望本文对您有所帮助! 如果您有任何疑问或意见,请随时在下面的回复部分中与我联系。
Keep learning! — Jacob Toftgaard Rasmussen
保持学习! —雅各布·托夫加德·拉斯穆森
翻译自: https://medium.com/swlh/a-good-beginner-project-with-logistic-regression-60b78e38484e
logistic 回归
http://www.taodudu.cc/news/show-863384.html
相关文章:
- 脉冲多普勒雷达_是人类还是动物? 多普勒脉冲雷达和神经网络的目标分类
- pandas内置绘图_使用Pandas内置功能探索数据集
- sim卡rfm_信用卡客户的RFM集群
- 需求分析与建模最佳实践_社交媒体和主题建模:如何在实践中分析帖子
- 机器学习 数据模型_使用PyCaret将机器学习模型运送到数据—第二部分
- 大数据平台蓝图_数据科学面试蓝图
- 算法竞赛训练指南代码仓库_数据仓库综合指南
- 深度学习 图像分类_深度学习时代您应该阅读的10篇文章了解图像分类
- 蝙蝠侠遥控器pcb_通过蝙蝠侠从Circle到ML:第一部分
- cnn卷积神经网络_5分钟内卷积神经网络(CNN)
- 基于树的模型的机器学习
- 数据分析模型和工具_数据分析师工具包:模型
- 图像梯度增强_使用梯度增强机在R中进行分类
- 机器学习 文本分类 代码_无需担心机器学习-如何在少于10行代码中对文本进行分类
- lr模型和dnn模型_建立ML或DNN模型的技巧
- 数量和质量评价模型_数量对于语言模型可以具有自己的质量
- mlflow_使用MLflow跟踪进行超参数调整
- 聊天产生器
- 深度学习领域专业词汇_深度学习时代的人文领域专业知识
- 图像分类
- CSDN-Markdown基本语法
- python3(一)数字Number
- python3(二)Numpy
- python3(三)Matplotlib
- python3(四)Pandas库
- python3(六)监督学习
- pycharm中如何调用Anoconda的库
- TensorFlow(四)优化器函数Optimizer
- TensorFlow(三)常用函数
- TensorFlow(五)常用函数与基本操作
logistic 回归_具有Logistic回归的优秀初学者项目相关推荐
- logistic回归预测_使用Logistic回归的suv购买预测
logistic回归预测 In this blog-post ,I will go through the process of creating a machine learning model f ...
- 多元有序logistic回归分析_有序Logistic回归实例分析(Ordinal Regression)
如果研究X对于Y的影响,Y为定量数据则可以使用线性回归分析.如果Y是定类数据,此时则需要使用Logit(logistic)回归分析.Logit回归共分为三种,分别是二元Logit(Logistic)回 ...
- 逻辑回归是分类还是回归_分类和回归:它们是否相同?
逻辑回归是分类还是回归 You might have come across the terms Regression and Classification, and might as well th ...
- 特征选择 回归_如何执行回归问题的特征选择
特征选择 回归 1.简介 (1. Introduction) 什么是功能选择 ? (What is feature selection ?) Feature selection is the proc ...
- python如何做混合模型面板回归_面板模型回归操作指南,适合初学者!
面板数据(panel data)是指不同对象在不同时间上的指标数据.目前面板数据被广泛地应用于经济研究中.本文简单介绍下,使用SPSSAU进行面板数据回归分析步骤. 一.数据格式 下图中,展示的就是一 ...
- 二元logistic模型案例_二元逻辑回归的简介与操作演示
二元逻辑回归介绍 定义 Logistic回归主要用于因变量为分类变量(如是否等)的回归分析,自变量可以为分类变量,也可以为连续变量.它可以从多个自变量中选出对因变量有影响的自变量,并可以给出预测公式用 ...
- 多元有序logistic回归_医学统计与R语言:多分类logistic回归HosmerLemeshow拟合优度检验...
微信公众号:医学统计与R语言如果你觉得对你有帮助,欢迎转发 输入1:multinominal logistic regression install.packages("nnet" ...
- 多变量逻辑回归python_Python实现逻辑回归(Logistic Regression in Python)
本文基于yhat上Logistic Regression in Python,作了中文翻译,并相应补充了一些内容.本文并不研究逻辑回归具体算法实现,而是使用了一些算法库,旨在帮助需要用Python来做 ...
- 逻辑回归解释 (Logistic Regression)
文章目录 什么是逻辑回归算法? 可视化曲线python 代码 最大似然估计 梯度下降法 Python代码简单实现(批量梯度下降法) 优缺点 什么时候用 多分类 应用场景 总结 什么是逻辑回归算法? L ...
最新文章
- Elasticsearch之Search API
- python1000个常用代码-介绍Python中几个常用的类方法
- 前端要凉?微软开源Sketch2Code,草图秒变代码
- 多表查询返回多个DataTable,合并到一个Table中.
- 高德地图上线武汉千家商超信息 可预约团购、查营业时间和电话
- 什么样的 python 可以可谓专业 PyPI 项目?刚刚学到三个概念:pep8、Sphinx、pytest与GitHub Action的集成
- JVM笔记7:类加载器
- 配置vue前端服务器及express服务器端的服务器同时运行——concurrently
- echar柱状图调整柱的高低
- redis hset hget字典的实现
- 数据挖掘之数据处理——SVM神经网络的数据分类预测-意大利葡萄酒种类识别
- 素人程序员:如何在技术浪潮更迭中保持较高成长速度?
- R语言使用cph函数和rcs函数构建限制性立方样条cox回归模型、使用anova函数进行方差分析通过p值确认指定连续变量和风险值HR之间是否存在非线性关系
- 【安卓开发系列 -- APP】APP 开发基础技术整理
- Set集合下的奇葩,TreeSet有序而且类型相同
- 泡沫破裂的经济学原理
- 【正点原子MP157连载】第十九章 OLED实验-摘自【正点原子】STM32MP1 M4裸机CubeIDE开发指南
- 7-88 组合成最小的三位数
- 【LeetCode】老虎证券面试-括号嵌套且满足优先级
- 2023年入门网络安全(黑客)收藏这个就够了
热门文章
- mongodb第二篇文章~关于集群认证的那点事
- file命令及Linux重要关键路径介绍
- 纯CSS3实现Material Design
- 《穿靴子的猫》蓝光720P 1080P高清中英双字 下载
- 活动目录数据库授权恢复
- in作为介词的用法_英语中in/on/at/to/from/by/with/for/about/after/before的用法
- 下面哪项属于计算机在教育教学中的应用,东师现代教育技术18秋在线作业2答案...
- 物联网卡linux,Server Develop (六) Linux epoll总结
- 憎恨之心最强套装攻略_冰雪攻略来袭,打金人不用慌
- [蓝桥杯][2017年第八届真题]正则问题(DFS)