火狐开发者工具_性能审核:Firefox开发人员工具深入研究
火狐开发者工具
In this article, we’ll cover Firefox Web Developer Tools (“DevTools”) — a set of tools designed to help developers inspect, debug, profile and optimize the performance of websites and web applications. We’ll particularly look at the tools related to performance, but we’ll also see how to get started using DevTools in general, and learn about some useful settings.
在本文中,我们将介绍Firefox Web开发人员工具(“ DevTools”)—一组旨在帮助开发人员检查,调试,分析和优化网站和Web应用程序性能的工具。 我们将特别关注与性能相关的工具,但还将了解一般如何使用DevTools的入门知识,并了解一些有用的设置。
You can access DevTools in different ways:
您可以通过不同的方式访问DevTools:
click on the hamburger menu at the right of the navigation toolbar, click on Web Developer, then choose the sub-tool you want to use
单击导航工具栏右侧的汉堡菜单,单击Web Developer ,然后选择要使用的子工具
use keyboard combinations, such as Shift+F5 (Windows and macOS) for the Performance tool and Ctrl+Shift+E (Windows) or Cmd+Option+E (macOS) for the Network tool
使用键盘组合,例如Performance工具使用Shift + F5 (Windows和macOS),Network工具使用Ctrl + Shift + E (Windows)或Cmd + Option + E (macOS)
right-click anywhere in the page a choose Inspect Element.
右键单击页面中的任意位置,然后选择检查元素 。
DevTools设置 (DevTools Settings)
The Firefox DevTools have many options that help developers customize their experience, such as the option to Enable time-stamps in the Web Console, or to Disable HTTP Cache, which is used to simulate first-load performance in all pages that have DevTools open.
Firefox DevTools有许多选项可帮助开发人员自定义其体验,例如在Web Console中启用时间戳或禁用HTTP Cache的选项,该选项用于模拟所有打开DevTools的页面的首次加载性能。
You can access the DevTools Settings panel in different ways:
您可以通过不同的方式访问“ DevTools设置”面板:
Start by opening DevTools, next:
首先打开DevTools,然后进行以下操作:
either click the Settings button in the toolbar
或者点击工具栏中的设置按钮
press
F1to show the Settings panel on top of any current tool按
F1以在任何当前工具的顶部显示“设置”面板press Ctrl+Shift+O (Windows and Linux), Cmd+Shift+O (macOS) to show the Settings panel.
按Ctrl + Shift + O (在Windows和Linux中), Cmd + Shift + O (macOS)以显示“设置”面板。
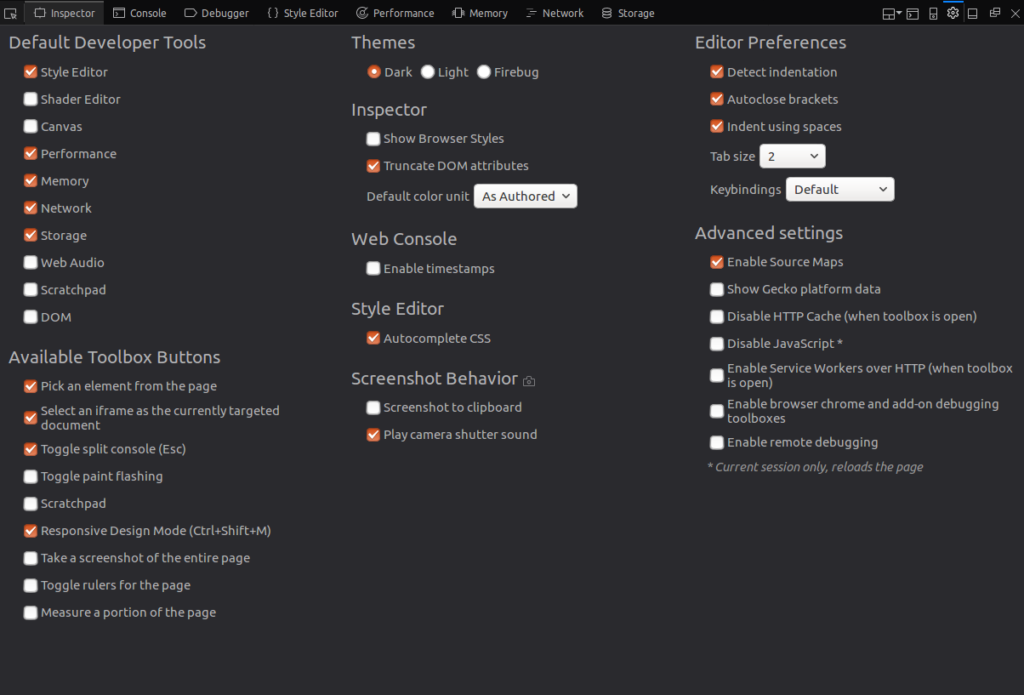
Here you can choose your default tools, the buttons you want to show in the toolbox, themes (dark-light-Firebug) and other advanced settings.
在这里,您可以选择默认工具,要在工具箱中显示的按钮,主题(暗光Firebug)和其他高级设置。
注重性能的工具 (Performance-focused Tools)
When analyzing the performance of a web application, you need to differentiate between load-time performance and run-time performance.
分析Web应用程序的性能时,您需要区分加载时性能和运行时性能。
Load-time performance answers questions like “what resources are taking too much time to load?” When dealing with run-time performance, we need to focus on JavaScript and CSS (CSS animations in particular) so we’re able to see where the code spends most of its time and what’s causing bottlenecks.
加载时性能回答了诸如“哪些资源需要花费太多时间来加载?”之类的问题。 在处理运行时性能时,我们需要专注于JavaScript和CSS(尤其是CSS动画),以便我们能够看到代码大部分时间都花在了哪里以及造成瓶颈的原因。
Let’s look at the Network Monitor and the Performance Tool.
让我们看一下网络监视器和性能工具。
网络监视器 (The Network Monitor)
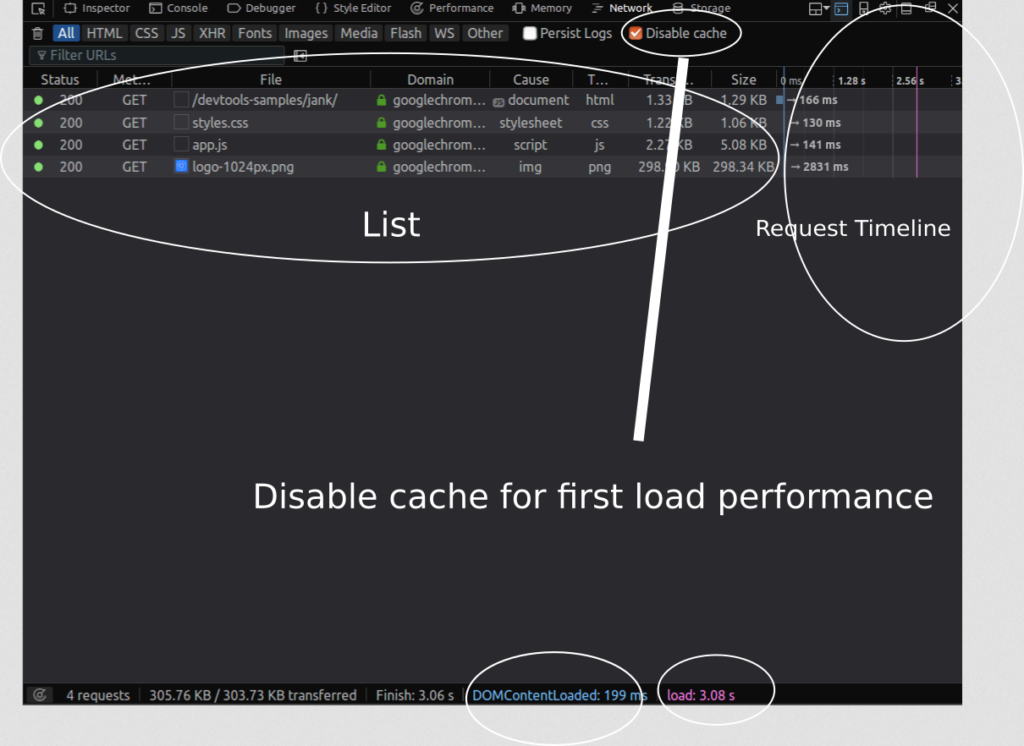
The Network Monitor shows you a tabular view of all network requests that Firefox made (for example, when it’s loading a page, or sending XMLHttpRequests, Fetch API requests etc.).
网络监视器向您显示Firefox发出的所有网络请求的表格视图(例如,在加载页面或发送XMLHttpRequest ,Fetch API请求等)。
It can also display request-related HTTP headers, HTTP responses and cookies, and let you search through them. You can also use it to perform, display and save a performance analysis of the current page load.
它还可以显示与请求相关的HTTP标头,HTTP响应和cookie,并让您搜索它们。 您还可以使用它来执行,显示和保存当前页面加载的性能分析。
In a nutshell, this tool can be used to determine how long the browser takes to download different assets of a web page.
简而言之,该工具可用于确定浏览器下载网页的不同资产所花费的时间。
You can also use this tool to monitor and single out requests that are slowing or blocking the web page’s fast loading. The Network panel shows you when principal events are fired (DOMContentLoaded and load).
您还可以使用此工具来监视和挑选出正在减慢或阻止网页快速加载的请求。 “网络”面板显示触发主要事件的时间( DOMContentLoaded和load )。
请求时间表 (Request Timeline)
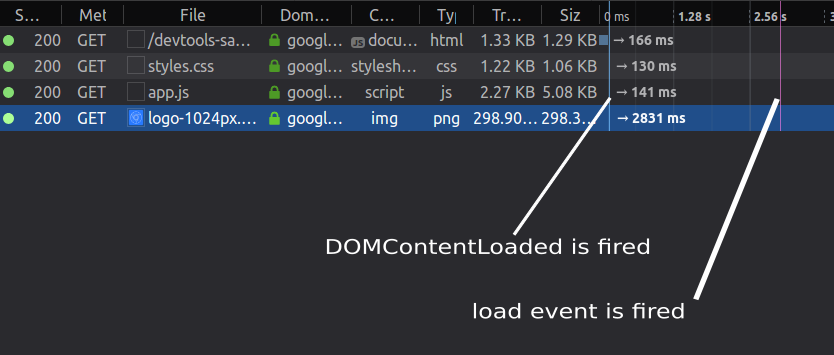
Each request in the network list has a timeline column which displays timing information related to the request, such as the total time taken to load the resource.
网络列表中的每个请求都有一个时间轴列,该列显示与该请求有关的时序信息,例如加载资源所需的总时间。
DevTools marks major life-cycle events in the report, like DOMContentLoaded, and page load. The blue refers to the time when the event DOMContentLoaded is fired; the purple line refers to the time when the page’s load event is fired.
DevTools在报告中标记了主要的生命周期事件,例如DOMContentLoaded和page load 。 蓝色表示触发DOMContentLoaded事件的时间。 紫色线表示触发页面的load事件的时间。
DOMContentLoaded与加载事件 (DOMContentLoaded vs Load Events)
The DOMContentLoaded event fires right when the HTML document is completely loaded and parsed, not including CSS style sheets, images, and frames.
当HTML文档完全加载并解析后, DOMContentLoaded事件就会触发,其中不包括CSS样式表,图像和框架。
The event load fires when the HTML document and all associated style sheets, images and frames are completely loaded.
HTML文档以及所有关联的样式表,图像和框架完全加载后,事件load触发。
请求详细信息面板 (Request Details Panel)
Once you click on a request in the requests list, you can a see right-docked details pane which has many different tabs such as headers, params, response, timings and security.
在“请求”列表中单击一个请求后,您可以在右下方看到详细信息窗格,该窗格具有许多不同的选项卡,例如标题,参数,响应,时间和安全性。
For performance, we’ll particularly look at the timing information.
为了提高性能,我们将特别关注时序信息。
网络计时 (Network Timings)
In this pane, there are many timing metrics related to each request:
在此窗格中,有许多与每个请求相关的计时指标:
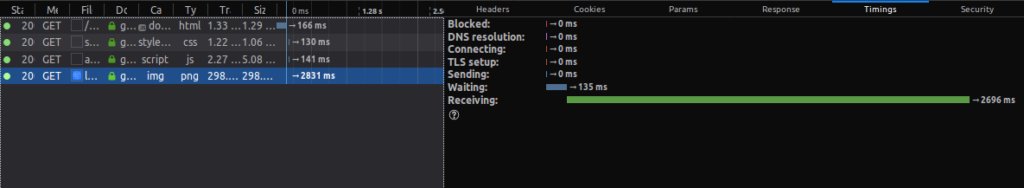
Blocked is the time spent in a queue waiting for a network connection.
阻塞是队列中等待网络连接所花费的时间。
Sending is the time taken for sending the request to the server.
发送是将请求发送到服务器所花费的时间。
Receiving is the time taken to receive the response from the server or (if it’s cached) to read it from the cache.
接收是从服务器接收响应或(如果已缓存)从缓存读取响应所花费的时间。
Waiting is the total time waited by the client before the first byte has been received. In other performance analysis tools like WebPageTest.org or Chrome’s DevTools, this is called TTFB or Time to First Byte.
等待是客户端在接收到第一个字节之前等待的总时间。 在其他性能分析工具(如WebPageTest.org或Chrome的DevTools)中,这称为TTFB或首字节时间。
There’s also DNS resolution, which is the time taken to resolve the host name of the server, and Connecting, which is the time taken to open a TCP connection.
还有DNS解析 (这是解析服务器的主机名所花费的时间)和Connecting (这是打开TCP连接所花费的时间)。
如何分析加载时间性能 (How to analyze the load time performance)
The Network Monitor integrates a performance analysis tool that can be used to analyze the load-time performance of your web page.
网络监视器集成了性能分析工具,可用于分析网页的加载时间性能。
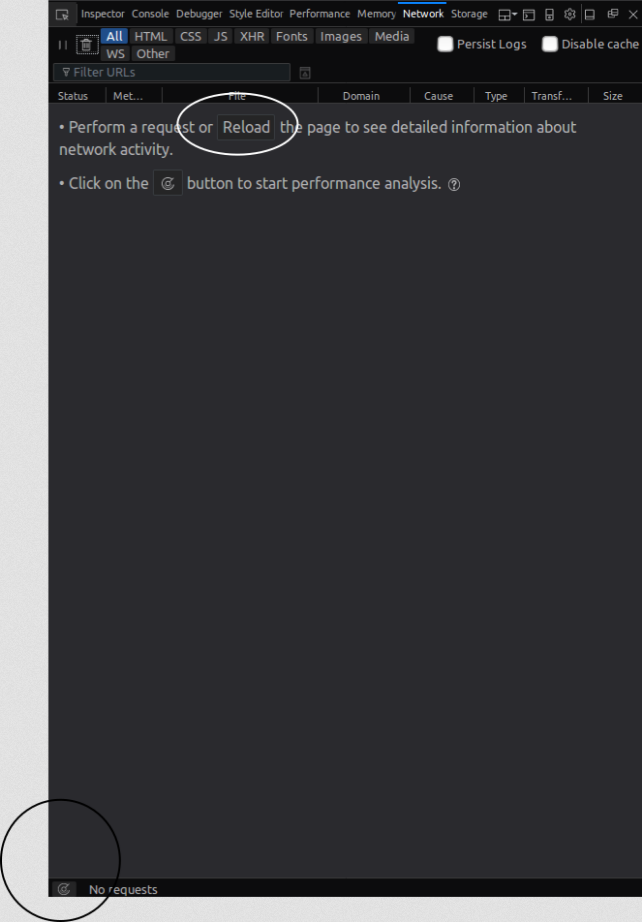
To start analyzing the load-time performance, you can:
要开始分析加载时性能,您可以:
click the Analyze icon in the bottom status bar
单击底部状态栏中的“ 分析”图标
- reload your page or make a network request while your Network monitor is open (actually this is going only to show tabular information about requests not do a load-time performance analysis).重新打开页面或在网络监视器打开时发出网络请求(实际上,这只会显示有关请求的表格信息,而不会进行加载时性能分析)。
The final report shows a pie chart and a corresponding table for the received resources by types: JavaScript, CSS, images and fonts etc. and a summary with the following details:
最终报告按类型(JavaScript,CSS,图像和字体等)显示饼图和相应资源接收资源的表格,以及带有以下详细信息的摘要:
- number of cached responses缓存的响应数
- total requests总要求
- size尺寸
- transferred size转移尺寸
- loading time加载时间
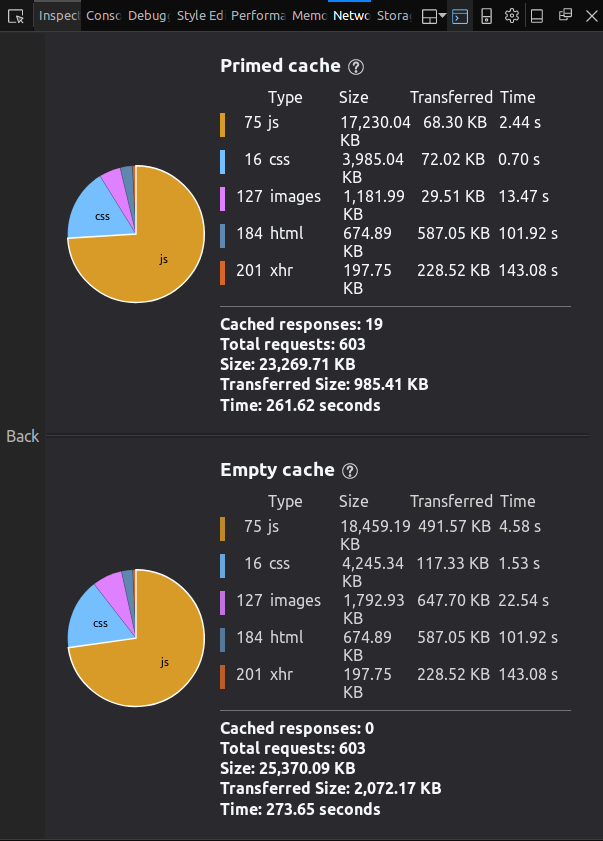
The web page is tested with an empty cache, and with a primed cache.
使用空的缓存和预填充的缓存测试网页。
首次加载性能 (First load performance)
Firefox’s DevTools allow you to analyze the performance of your web application in two different situations:
Firefox的DevTools允许您在两种不同情况下分析Web应用程序的性能:
- Without caching, which emulates the first-time visit when assets are still not cached.不使用缓存,它模拟资产仍未缓存时的首次访问。
- With caching, which emulates the second-time visits. The browser has already cached the app’s assets, eliminating many round-trips to the server. 具有缓存功能,可模拟第二次访问。 浏览器已经缓存了应用程序的资产,从而消除了到服务器的多次往返。
You can also use the Disable Cache setting to emulate the first-time load of a web page when the DevTools are open on any tab.
当在任何选项卡上打开DevTools时,也可以使用“ 禁用缓存”设置来模拟网页的首次加载。
JavaScript性能和响应能力 (JavaScript Performance and Responsiveness)
JavaScript is single-threaded, which means the browser runs code synchronously, but thanks to HTML5 Web Workers (a standard API for multi-threading JavaScript) you can also run code in other threads.
JavaScript是单线程的,这意味着浏览器可以同步运行代码,但是由于有了HTML5 Web Workers(用于多线程JavaScript的标准API),您还可以在其他线程中运行代码。
This single thread is responsible for running all the work the browser is doing such as layout rendering, calculating styles and collecting garbage.
这个单线程负责运行浏览器正在执行的所有工作,例如布局渲染,计算样式和收集垃圾。
Also methods such setTimeout, events such click and load and resource fetching, all get executed by the single thread. (It’s true that these tasks are executed asynchronously, but the a-synchronicity in JavaScript is different: it’s emulated by using an event-driven approach, with an events loop and queue.)
同样,诸如setTimeout类的方法,诸如click和load以及资源获取之类的事件都由单个线程执行。 (的确,这些任务是异步执行的,但是JavaScript中的异步性是不同的:它是通过使用事件驱动的方法,事件循环和队列来模拟的。)
Good performance and responsiveness are due to JavaScript’s asynchronous model, but long-running functions can lead to bad performance and poor UI responsiveness.
良好的性能和响应能力归因于JavaScript的异步模型,但是长时间运行的功能可能会导致性能下降和UI响应能力差。
性能工具 (The Performance tool)
The Performance tool allows you to discover bottlenecks and performance issues of your web pages by giving you insights into your web page’s UI responsiveness (in response to user interactions) and your JavaScript code performance.
通过性能工具,您可以洞察网页的UI响应度(响应用户交互)和JavaScript代码性能,从而发现网页的瓶颈和性能问题。
With the Performance tool, you can start a performance analysis of your currently opened web page over a period of time that you can control with start and stop recording buttons. The tool then shows you a summary, and tabular and graph views of the operations the browser was doing to render your page.
使用性能工具,您可以在一段时间内开始对当前打开的网页进行性能分析,您可以使用“开始”和“停止记录”按钮进行控制。 然后,该工具向您显示浏览器为呈现页面而进行的操作的摘要以及表格和图形视图。
You can look for and detect long-running pieces of code that block the single thread using the Performance tool.
您可以使用“性能”工具查找并检测长时间运行的代码块,这些代码会阻塞单个线程。
如何使用效果工具 (How to use the Performance tool)
The steps to use the performance tool are quite easy:
使用性能工具的步骤非常简单:
- open your web page, open the Performance panel, then start recording the performance打开您的网页,打开“效果”面板,然后开始录制效果
- wait a few seconds, also make sure to interact with your page during the profiling, then stop the recording等待几秒钟,还要确保在分析过程中与您的页面进行互动,然后停止录制
- look for any long-running functions or events, and focus (zoom in) on the time portions where FPS is low.寻找任何长时间运行的功能或事件,并集中(放大)FPS较低的时间部分。
- when you find any activities that can be targeted for further optimization, you can use other sub-tools to get detailed information about where to take action.当找到可以进一步优化的目标活动时,可以使用其他子工具获取有关在何处采取措施的详细信息。
Make sure to follow some user interaction scenarios and interact with the different parts of your app’s UI during the profiling process, particularly the parts you want to optimize. Also avoid unnecessary extra actions: for example, don’t interact with the parts you’re not trying to analyze, since they’ll just add more noise to your report’s results.
确保在分析过程中遵循一些用户交互方案,并与应用程序UI的不同部分进行交互,尤其是要优化的部分。 还要避免不必要的额外操作:例如,不要与您不想分析的部分进行交互,因为它们只会给报告的结果带来更多干扰。
选择时间范围 (Selecting the Time Range)
Firefox’s DevTools support selecting or narrowing the time range over the profile’s time. You can click on the timeline or the FPS chart section, then drag your mouse to select a span of time. Once you stop dragging, DevTools updates the other views and charts to only display information about events that happened during that time span.
Firefox的DevTools支持选择或缩小配置文件时间范围内的时间范围。 您可以单击时间线或FPS图表部分,然后拖动鼠标以选择时间跨度。 停止拖动后,DevTools将更新其他视图和图表,以仅显示有关在该时间段内发生的事件的信息。
FPS图表 (The FPS chart)
The frame-rate chart displays the frames per second over the period of the recording. When the recording is running, this chart acts like an FPS meter with live values.
帧速率表显示记录期间每秒的帧数。 运行记录时,此图表的作用类似于具有实时值的FPS仪表。
The FPS chart shows the max, min values of FPS and the average FPS value over the time of profiling. All these values can quickly tell you if you have any performance bottlenecks.
FPS图表显示了分析期间FPS的最大值,最小值和平均FPS值。 所有这些值都可以快速告诉您是否存在性能瓶颈。
If you’re running any animations, the FPS should be 60 fps. Watch this video to understand why this value is important:
如果您正在运行任何动画,则FPS应该为60 fps 。 观看此视频以了解为什么此值很重要:
You can use this chart to quickly spot visual gaps (collapses) and inconsistencies that denote severe drops of the frame rate (meaning the browser is having performance bottlenecks).
您可以使用此图表快速发现视觉差距(崩溃)和不一致现象,这些现象表示帧速率严重下降(意味着浏览器存在性能瓶颈)。
You can see from this screenshot an FPS chart with collapses:
您可以从此屏幕截图中看到带有折叠的FPS图表:

瀑布图 (The Waterfall chart)
Wikipedia explains a waterfall chart as:
维基百科将瀑布图解释为:
a form of data visualization that helps in understanding the cumulative effect of sequentially introduced positive or negative values. The waterfall chart is also known as a flying bricks chart or Mario chart due to the apparent suspension of columns (bricks) in mid-air.
一种数据可视化形式,有助于理解顺序引入的正值或负值的累积效果。 由于空中的圆柱(砖块)明显悬浮,瀑布图也称为飞砖图或马里奥图。

Image source
图片来源
In the case of the Performance tool, the Waterfall chart displays a breakdown of the activities and browser-specific events the browser was performing, such as:
对于性能工具,瀑布图显示浏览器正在执行的活动和特定于浏览器的事件的明细,例如:
- layout rendering or laying out elements (called also reflows)布局渲染或布局元素(也称为重排)
- styling造型
- animation frames requests动画帧请求
- repaints or pixels drawing重新绘制或绘制像素
- garbage collecting etc.垃圾收集等
Layout operations or reflows and style calculations are expensive, so these can be potential areas for optimization. See this Google article for more details.
布局操作或重排以及样式计算非常昂贵,因此它们可能是优化的潜在领域。 有关更多详细信息,请参见这篇Google文章 。
Here’s a screenshot of the waterfall chart of an example application:
这是示例应用程序的瀑布图的屏幕截图:

呼叫树视图 (The Call Tree view)
The Call Tree view displays the JavaScript functions on which the browser spent most of its time, with important measures such as the activity’s total time, self time and their percentages relative to the total profiling time.
“调用树”视图显示浏览器大部分时间用于其上JavaScript函数,并具有重要的度量标准,例如活动的总时间,自身时间以及它们相对于总分析时间的百分比。

Self time refers to the time taken solely by the operation without considering the functions it calls.
自拍时间是指操作仅在不考虑其调用的功能的情况下所花费的时间。
Total time refers to the time taken by the operation and the functions it calls.
总时间是指操作及其调用的功能所花费的时间。
The Call Tree tells you, statistically, in which functions (aggregated) your browser is spending most of the time across a recording.
调用树可以统计地告诉您浏览器在记录中花费了大部分时间的功能(合计)。
JS火焰图 (The JS Flame Chart)
The Flame Chart displays a Flame graph of JavaScript call stacks during the profiling period. Flame charts are a type of performance visualization created by Brendan Gregg.
火焰图在分析期间显示JavaScript调用堆栈的火焰图。 火焰图是Brendan Gregg创建的一种性能可视化形式。

A Flame Chart enables most of the hot code-paths to be identified quickly and accurately.
通过火焰图,可以快速,准确地识别大多数热代码路径。
Stacked bars mean that the top operation, which exists directly in the CPU, invoked the bottom operation.
堆叠的条表示直接在CPU中存在的顶层操作调用了底层操作。
You can read more about Flame charts here.
您可以在此处有关Flame图表的信息 。
You can use the Frame rate and JavaScript Flame charts, the Waterfall and the Call Tree views to figure out where you have performance problems, and to single out the particular functions that need optimization.
您可以使用帧速率和JavaScript Flame图表,“瀑布”视图和“调用树”视图来找出性能问题所在,并找出需要优化的特定功能。
The Flame Chart shows you the state of the call stack of particular functions at particular times of the recording.
火焰图显示在记录的特定时间特定功能的调用堆栈的状态。
The Flame Chart has tons of data, so to get meaningful readings you need to zoom in until you select a few milliseconds.
火焰图具有大量数据,因此要获得有意义的读数,您需要放大直到选择几毫秒。
颜色代码 (Color Codes)
The different charts and sections are color coded using the same colors for the same types of operations and assets — JavaScript, CSS, rendering, painting etc.
不同的图表和部分使用相同的颜色对相同类型的操作和资产(JavaScript,CSS,渲染,绘画等)进行颜色编码。
You can use colors to distinguish between operations in different views, quickly spot the type of the operation causing issues, and to keep up with the operations’s types when switching between different perspectives.
您可以使用颜色来区分不同视图中的操作,快速找出引起问题的操作类型,以及在不同视角之间切换时跟上操作类型。
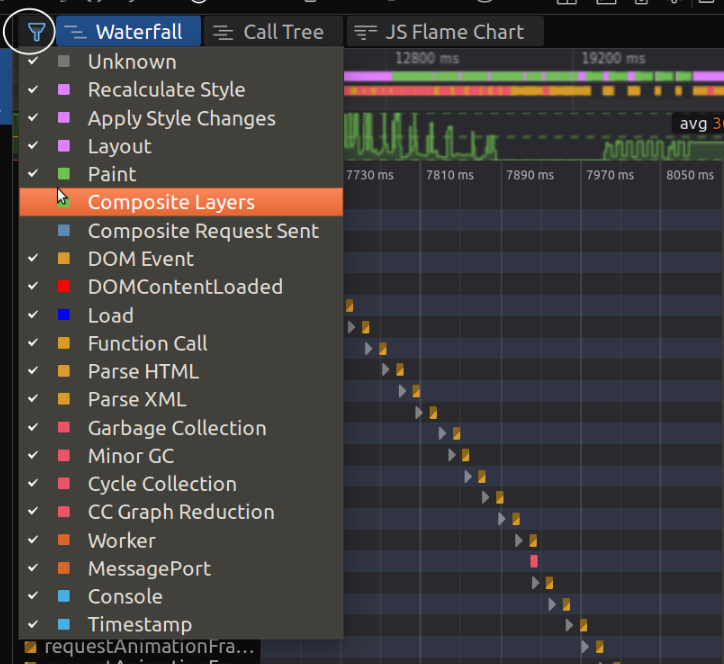
You can filter out the single activities that you want to see in your charts and views via this menu, where you can also see the different colors associated with the different operations.
您可以通过此菜单过滤掉想要在图表和视图中看到的单个活动,还可以在其中看到与不同操作相关的不同颜色。
For example, if you’re working with CSS animations, what you need to focus on are activities such as Recalculate Style, Apply Style Changes, Layout and Paint. You can filter out the other activities for less noise.
例如,如果您正在使用CSS动画,则需要重点关注诸如重新计算样式,应用样式更改,布局和绘画之类的活动。 您可以过滤掉其他活动以减少噪音。
For JavaScript, you need to focus on Function Call, Parse HTML and Parse XML.
对于JavaScript,您需要专注于函数调用,解析HTML和解析XML。
结论 (Conclusion)
In this article, we’ve seen how to get started with Firefox’s DevTools and how to use different performance-related sub-tools. Firefox’s DevTools are incredibly comprehensive, and with Firefox’s recent performance upgrade, it’s all the more able to accurately identify truly problematic areas of a website’s rendering processes. We encourage you to explore further on your own, now that you’re familiar with the terminology and know what to look for.
在本文中,我们已经了解了如何开始使用Firefox的DevTools以及如何使用与性能相关的其他子工具。 Firefox的DevTools令人难以置信的全面,并且随着Firefox最近的性能升级,它更加能够准确地识别网站渲染过程中真正有问题的区域。 既然您已熟悉术语并知道要查找的内容,我们鼓励您自己进一步探索。
翻译自: https://www.sitepoint.com/performance-auditing-a-firefox-developer-tools-deep-dive/
火狐开发者工具
火狐开发者工具_性能审核:Firefox开发人员工具深入研究相关推荐
- web应用调试工具_如何使用浏览器开发人员工具调试渐进式Web应用程序
web应用调试工具 Interested in learning JavaScript? Get my ebook at jshandbook.com 有兴趣学习JavaScript吗? 在jshan ...
- 火狐是用java开发的吗_超级不负责任 Firefox开发人员因Java区块而受到攻击
火狐是用java开发的吗 由于上周晚些时候发布了补丁,因此Java现在需要明确的许可才能在最新版本的Firefox中运行. Mozilla的开发人员是Firefox背后的非营利组织,他们希望它能帮助保 ...
- android底层开发工具,Android Developer Tools(开发人员工具)
在做Android开发的过程中,不可避免地需要使用到自带的android developer tools(开发人员工具),这是一个强大的开发辅助工具,随着android版本的更新,developer ...
- java 集成开发工具_最好的Java开发人员测试和集成工具
java 集成开发工具 通过从您的应用程序学习企业APM产品,发现更快,更有效的性能监控. 参加AppDynamics APM导览! 无论您是刚刚起步还是已经从事了一段时间,使用正确的工具进行编程都可 ...
- 哈希在线计算工具_哈希:开发人员的绝佳工具
哈希在线计算工具 Hashing is an important topic for programmers and computer science students to be familiar ...
- mysql查询性能测试工具_性能测试之数据库监控分析工具PMM
PMM(Percona Monitoring and Management) 是一个用于管理和监控数据库性能的开源平台. . 它能提供全面的基于时间和各类监控指标.计数器的分析. 性能测试中,是做数据 ...
- IE浏览器开发人员工具怎么使用
大家都知道IE是Windows系统默认的浏览器,功能齐全,方便用户操作,也为开发人员提供了许多便捷.为了帮助开发人员更好的调试浏览器,IE为大家准备了强大的开发人员工具,要怎么使用这个功能呢?下面小编 ...
- Win10系统 IE11浏览器调用F12开发人员工具,打开后底部显示空白
Win10系统 IE11浏览器点击F12开发人员工具,打开后底部显示空白. 经过尝试发现该问题与安全选项里的一个策略有关系. 在安全选项里,找到"用户帐户控制:以管理员批准模式运行所有管理员 ...
- ie 开发人员工具使用方法(F12)
reference:http://blog.csdn.net/xinjoker/article/details/8516914 现在网上关于IE10的开发人员工具并没有详细的中文资料,所以许多开发人员 ...
最新文章
- 光子人工智能芯片助“中国芯”换道超车
- 【08】Effective Java - 异常
- 【深夜思考】转行学java找不到工作
- 微擎css使用php变量,$_Wamp;全局变量
- python独立图形_Python图形界面(自学Python系列笔记-4)(不定期更新)
- 汽车运输、影视动画、建筑施工,Unite 2019 看技术如何颠覆传统?
- Android怎么禁用底部键,在三分钟内完全禁用并隐藏Android设备底部的虚拟按钮(适用于测试)...
- 均值定理四个公式_中考数学几何题,就考这140多条公式定理!
- windows cmd命令行查看结束进程
- LR证书过期解决办法
- 工具变量与两阶段最小二乘stata
- 电气工程及其自动化走Java_电气工程及其自动化专业项目经验范文
- Failed to initialize Data Warehouse host process
- 看我如何快速拿下整个C段主机权限
- 什么是导数、方向导数、偏导数、梯度
- matlab 编程小球经历路程(s)以及第几次反弹高度(L)
- 学校关于配备计算机教室的申请,学校多媒体教室的申请书
- 利用matlab实现硬币分类,一种硬币计数分类整理机的制作方法
- 面试题大全-计算机网络
- 冈萨雷斯数字图像处理——彩色图像增强3实例