如何识别SQL Server中运行缓慢的查询
总览 (Overview )
Slow running queries are one of the most common problems in every organization dealing with huge amounts of data. And the most challenging problem, in almost all the clients, I work with, is how to find the queries running slow and figuring out what is the actual cause behind the performance problem. Thankfully, the solution, in most cases, is simple.
运行缓慢的查询是每个处理大量数据的组织中最常见的问题之一。 在与我合作的几乎所有客户端中,最具挑战性的问题是如何查找运行缓慢的查询并找出导致性能问题的真正原因是什么。 幸运的是,在大多数情况下,解决方案很简单。
I always suggest to spend most of the time on figuring out the actual cause behind the problem, not on thinking about the potential solutions which might exist.
我总是建议将大部分时间都花在找出问题背后的实际原因上,而不是考虑可能存在的潜在解决方案。
Fortunately, there are some tools and techniques which a Developer or DBA should always use (at least) to have a fair idea about the queries running slow.
幸运的是,开发人员或DBA应该始终使用(至少)使用一些工具和技术,以使查询运行缓慢的想法更为合理。
Before going into the details, I would like to mention here that the tools and techniques I will mention here will be for SQL Developers who do not have expert knowledge of database administration and for Database Administrators who are in the start of their career.
在开始讨论细节之前,我想在此提及,我将在这里提及的工具和技术将针对那些不具备数据库管理专业知识SQL开发人员以及那些刚刚起步的数据库管理员。
Note: I will be using SQL Server 2016 for my test cases in this article. If you have any prior version, then the Query Store is not available for you but all the other tools will still work.
注意:本文将针对测试用例使用SQL Server 2016。 如果您有任何以前的版本,则查询存储对您不可用,但所有其他工具仍然可以使用。
工具与技术 (Tools & techniques)
Like every kind of work in the world there are special tools required. The process of identifying slow running queries is no different. In this article, I will only mention tools which are already exist on your system or you can download them free.. I would not say that commercial tools do not help, in fact, in large organizations I would strongly recommend those to save time performing deep dives into each server for highlighting slow running queries. But for the purposes of this article, we want to roll up our sleeves and learn the fundamentals using the existing tools we already have at our disposal.
像世界上每一种工作一样,都需要特殊的工具。 识别运行缓慢的查询的过程没有什么不同。 在本文中,我只会提及系统上已经存在的工具,或者您可以免费下载它们。.我不会说商业工具无济于事,实际上,在大型组织中,我强烈建议您使用这些工具以节省执行时间深入研究每台服务器,以突出显示运行缓慢的查询。 但是,出于本文的目的,我们希望袖手旁观,并使用我们已经掌握的现有工具来学习基础知识。
The first tool which I will mention here is abuilt-in tool for SQL Server Management Studio;“Activity Monitor”. You can view this by Right Clicking on Instance Name in SQL Server Management Studio and selecting “Activity Monitor”.
我将在这里提到的第一个工具是SQL Server Management Studio的内置工具。 “活动监视器”。 您 可以通过在SQL Server Management Studio中右键单击实例名称并选择“活动监视器”来查看。
Activity monitor tells you what the current and recent activities are in your SQL Server Instance.
活动监视器告诉您SQL Server实例中当前和最近的活动。
The above screenshot displays an overview window for the Activity Monitor. This screen will show you the graphs for Processor Times, Waiting Tasks, and Batch Requests. Generally, the lower the number of counts the better the performance. In large organizations with huge load there might be huge number of batch requests with high processor times but that does not necessarily indicate a performance problem.
上面的屏幕快照显示了活动监视器的概述窗口。 该屏幕将显示“处理器时间”,“等待任务”和“批处理请求”的图形。 通常,计数越少,性能越好。 在具有巨大负载的大型组织中,可能会有大量具有较高处理器时间的批处理请求,但这不一定表示性能问题。
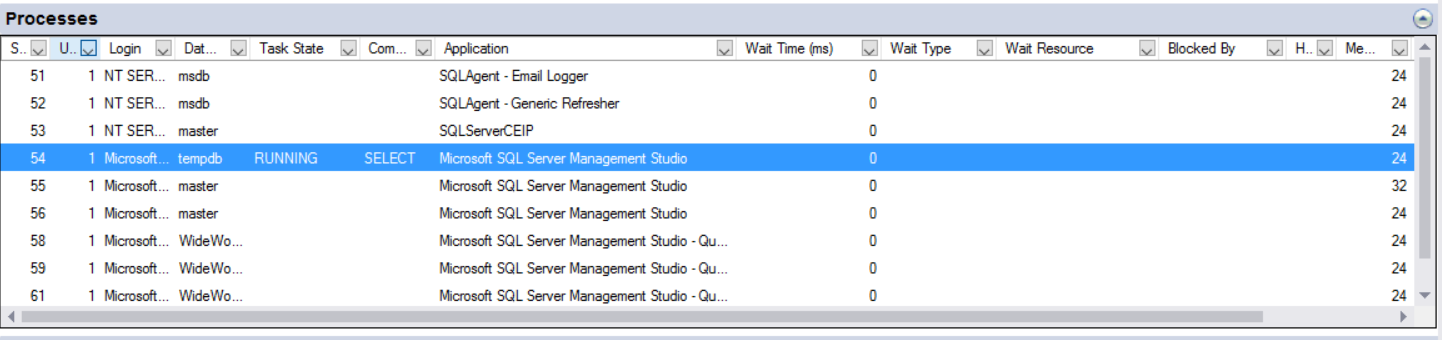
After the overview, you need to focus on Processes which gives you the access to view all the processes running in your instance and having a deeper look for how many processes are waiting, blocking or blocked. This way you can get the idea if you have queries running slow because of any specific wait or if the queries taking time are being blocked by other processes. In this view, you can Right Click on any process and click on Details to view the actual TSQL running for that session.
概述之后,您需要专注于进程,该进程使您可以查看实例中运行的所有进程,并更深入地了解正在等待,阻塞或阻塞的进程数。 这样,如果由于任何特定的等待而导致查询运行缓慢,或者查询耗时,或者其他进程阻塞了查询,则可以理解。 在此视图中,可以右键单击任何进程,然后单击“ 详细信息”以查看为该会话运行的实际TSQL。
The queries which are being blocked are those which are actually suspended because of any other process working on the resources the process depends upon. So, if you find queries which are being blocked by other processes then simply check for the root blocker which is causing all the blocking by looking at the Blocked By column. Try to consider just that query, not all the processes which are blocked.
被阻塞的查询实际上是由于任何其他进程正在使用该进程所依赖的资源而实际上被挂起的查询。 因此,如果您发现被其他进程阻止的查询,则只需查看“ 阻止者”列即可检查引起所有阻止的根阻止程序。 尝试仅考虑该查询,而不要考虑所有被阻止的进程。
And the queries which are waiting for any specific resource, gives you information about the Wait Resource so you can check for the Wait Type and try to figure out the solution for that problem. Some of the most common wait stats are listed in a comprehensive SQL Shack’s SQL Server wait types section. Go through that in details for further actions.
等待所有特定资源的查询为您提供了有关等待资源的信息,因此您可以检查“ 等待类型”并尝试找出解决该问题的方法。 全面SQL Shack的SQL Server等待类型部分中列出了一些最常见的等待统计信息。 详细了解该操作以采取进一步的措施。
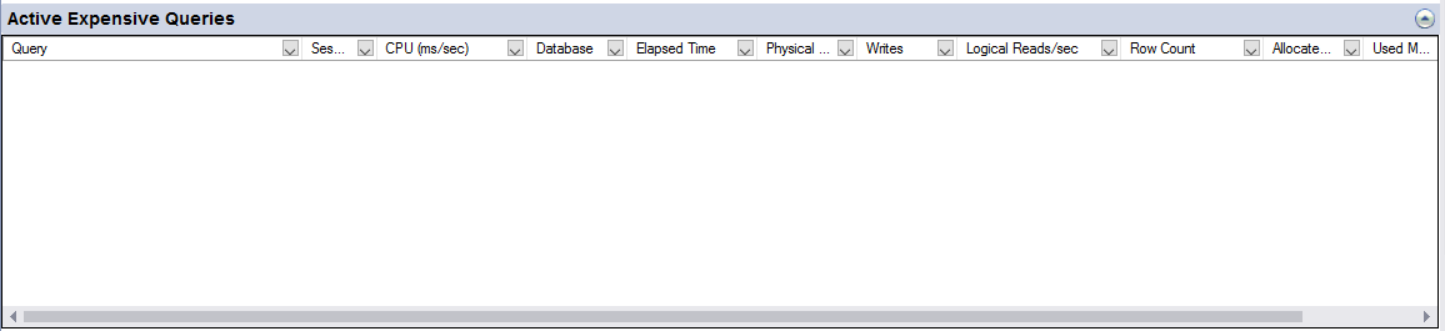
The Active Expensive and Recent Expensive queries will give you information about the queries which have high CPU, Logical Reads or High Elapsed time.
活动的昂贵查询和最近的昂贵查询将为您提供有关具有高CPU,逻辑读取或高消耗时间的查询的信息。
You can go to each section for Current or Recent expensive queries. Sort them by Elapsed time, Logical Read and CPU Time one by one and check the execution plan. In the execution plan you will be able to find out why these expensive queries were taking an inordinate amount of time so that you can take appropriate actions to resolve them. I will let you know how to go through the SQL Server Query Execution Plan later in this article so stay tuned.
您可以转到每个部分以查询当前或最近的昂贵查询。 按照经过时间,逻辑读取和CPU时间对它们进行一次排序,然后检查执行计划。 在执行计划中,您将能够找到为什么这些昂贵的查询会花费大量时间的原因,以便您可以采取适当的措施来解决它们。 我将在本文后面让您知道如何通过SQL Server查询执行计划,敬请关注。
The next tool is the “Query Store”. This is helpful and could save your life in situation where you were called in the middle of the night to check why SQL Server was slow 1 hour earlier.
下一个工具是“查询存储” 。 这很有用,可以在半夜打电话给您检查为什么SQL Server速度比1小时慢的情况下可以挽救您的生命。
Generally, prior to SQL Server 2016, without any third-party application or custom solutions, you are not able to look at the history of query execution. So, the Query Store provides a great deal of value added functionality in this regard. Ed Pollack wrote about Query Store here so do check this article as it’s a great resource to deep dive into query store.
通常,在SQL Server 2016之前,没有任何第三方应用程序或自定义解决方案,您将无法查看查询执行的历史记录。 因此,查询存储在这方面提供了很多增值功能。 埃德·波拉克 ( Ed Pollack ) 在此处撰写了有关查询存储的文章,因此请查看本文,因为它是深入研究查询存储的重要资源。
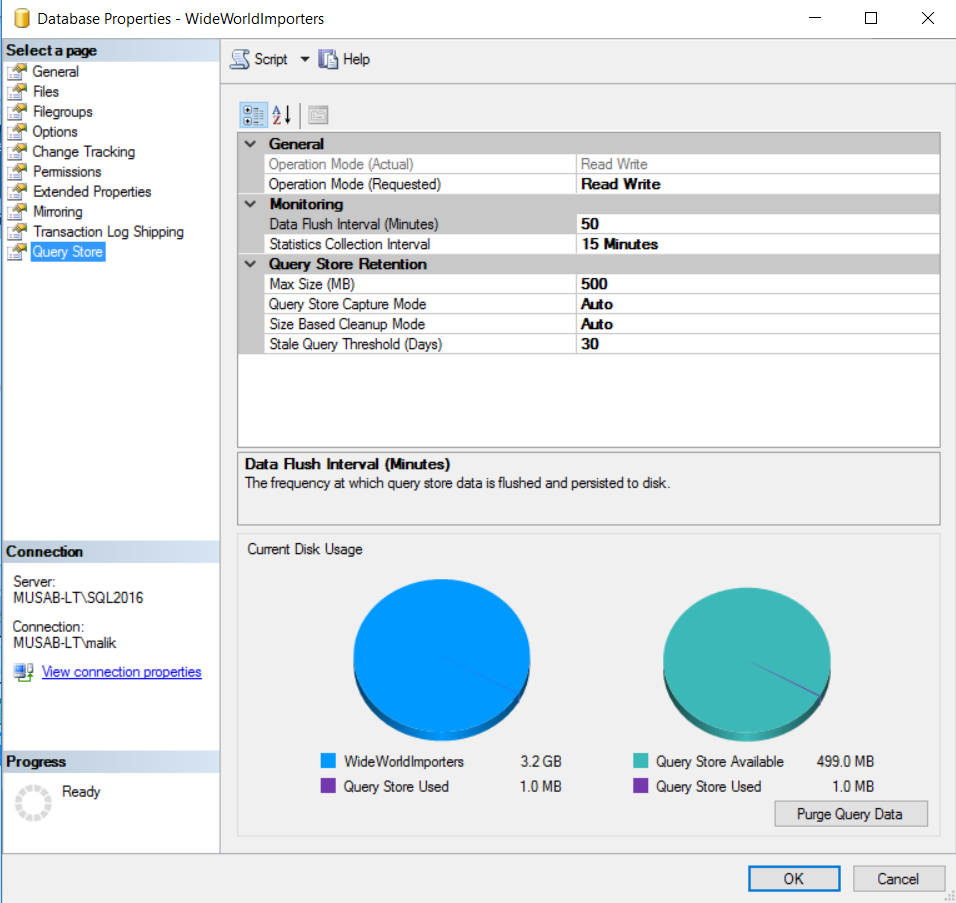
If you have SQL Server 2016 or higher so first you need to enable it in your database properties. After enabling the Query Store, you will have the properties of your database as shown in the screenshot below:
如果您具有SQL Server 2016或更高版本,则首先需要在数据库属性中启用它。 启用查询存储后,您将拥有数据库的属性,如下面的屏幕快照所示:
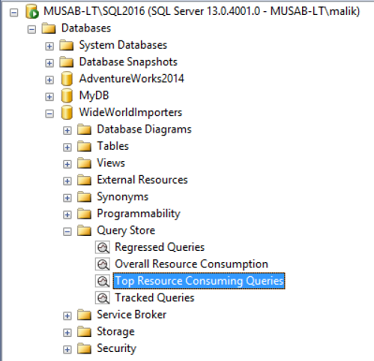
After you have enabled the Query Store you can expand the database objects and go to the “Top Resource Consuming Queries” as shown in the below screenshot:
启用查询存储后,您可以展开数据库对象并转到“顶级资源消耗查询”,如以下屏幕快照所示:
Note: Give the Query Store a day or two to capture the production load so that you can easily work on it with real load.
注意:给查询存储区一两天来捕获生产负载,以便您可以轻松处理实际负载。
Right Click on Top Resource Consuming Queries and select “View Top Resource Consuming Queries”, you will be taken to the window showing these high resource consuming queries. You can customize the view by selecting an appropriate “metric” like Duration, CPU Time, Logical Read or Memory Consumption. The second thing you need to change is “Statistic”. You can change it to Min, Max or Avg. I would recommend to use Average Statistic with all metrics mentioned above to get queries.
右键单击顶部资源消耗查询,然后选择“查看顶部资源消耗查询”,您将进入显示这些高资源消耗查询的窗口。 您可以通过选择适当的“度量标准”(例如“持续时间”,“ CPU时间”,“逻辑读取”或“内存消耗”)来自定义视图。 您需要更改的第二件事是“统计”。 您可以将其更改为最小,最大或平均。 我建议对以上提到的所有指标使用平均统计信息来获取查询。
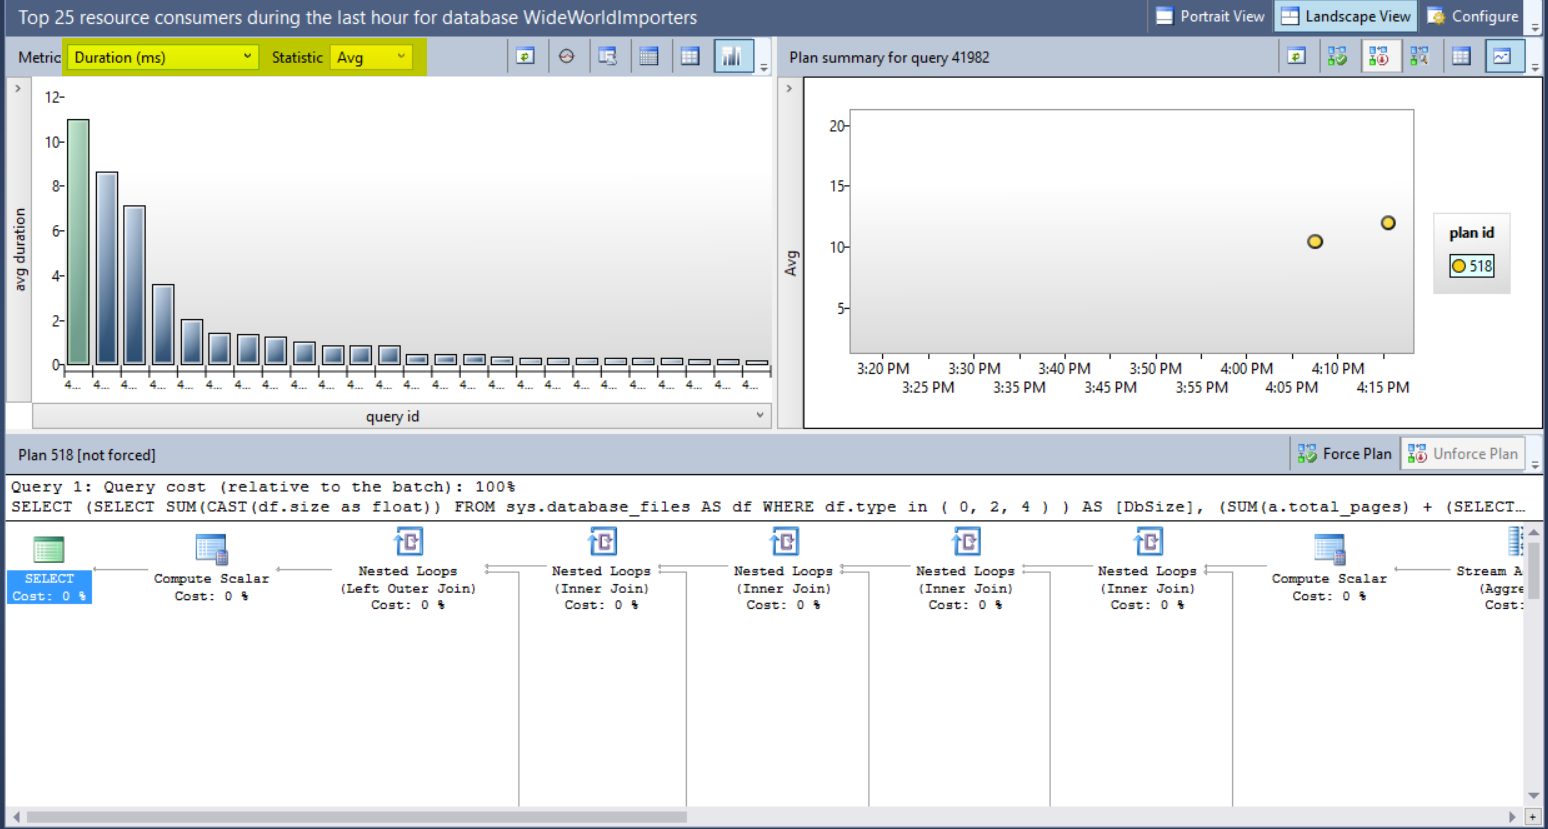
The next step is to highlight the queries which are consuming high resources. After highlighting the graph value in the left-hand side window (as highlighted in the screenshot below) you will get the query execution plan in the bottom window.
下一步是突出显示消耗大量资源的查询。 在左侧窗口中突出显示图形值(如下面的屏幕快照中突出显示)后,您将在底部窗口中获得查询执行计划。
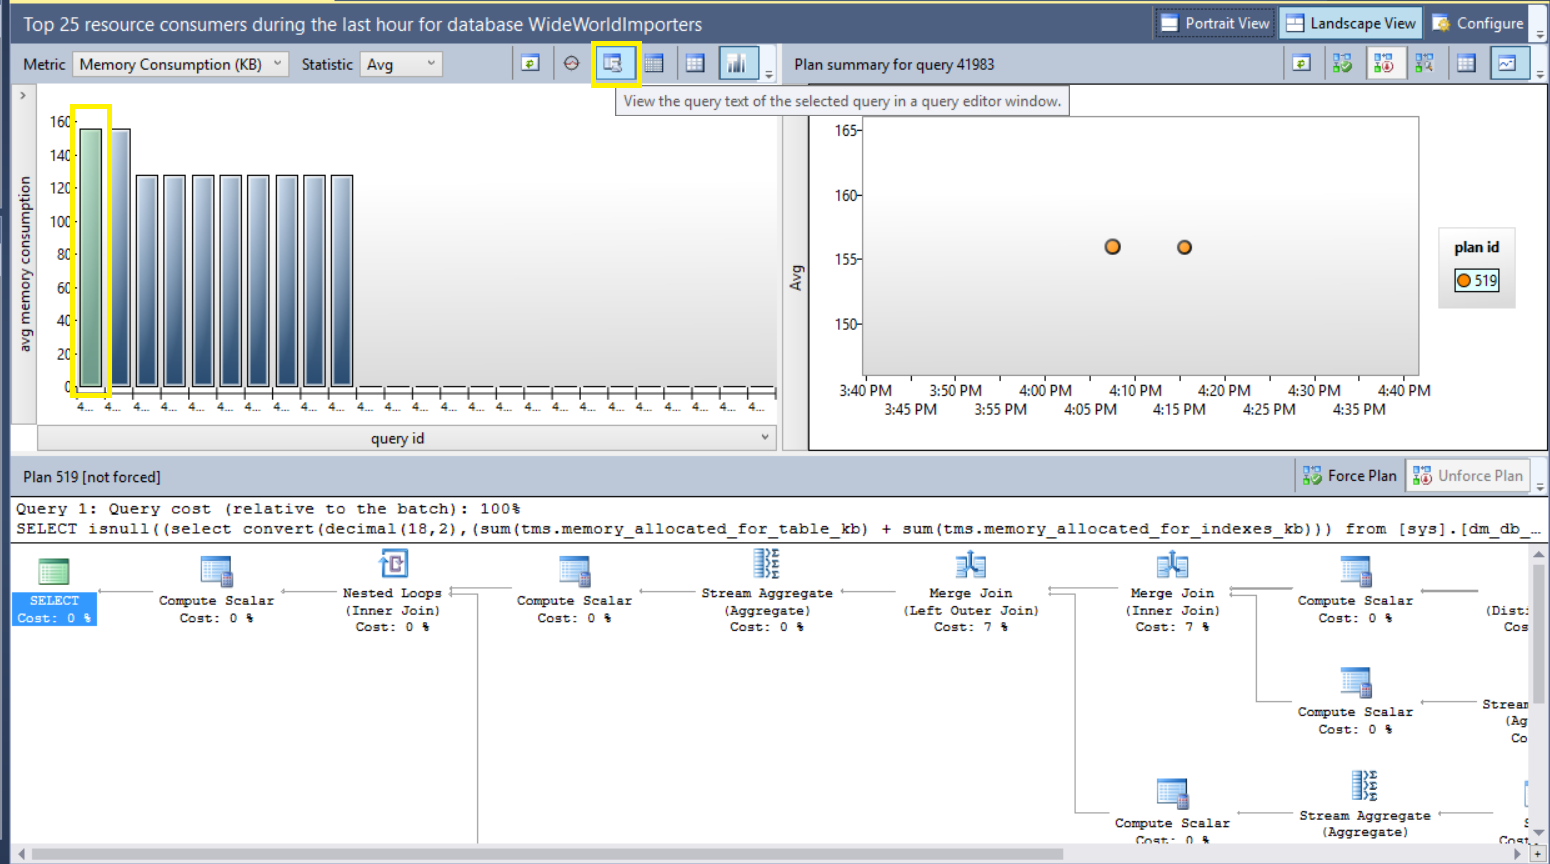
You can click on the mentioned below highlighted button in the Query Store window to get the actual Query Text for further analysis.
您可以在“查询存储”窗口中单击下面提到的突出显示的按钮,以获取实际的查询文本以进行进一步分析。
So, as of now, you have multiple ways to get High Resource usage queries. Now we will see how we can check why the queries are running slow and which part of the query needs to be fixed (if required).
因此,到目前为止,您有多种方法来获取高资源使用率查询。 现在,我们将看到如何检查查询运行缓慢的原因以及查询的哪一部分需要修复(如果需要)。
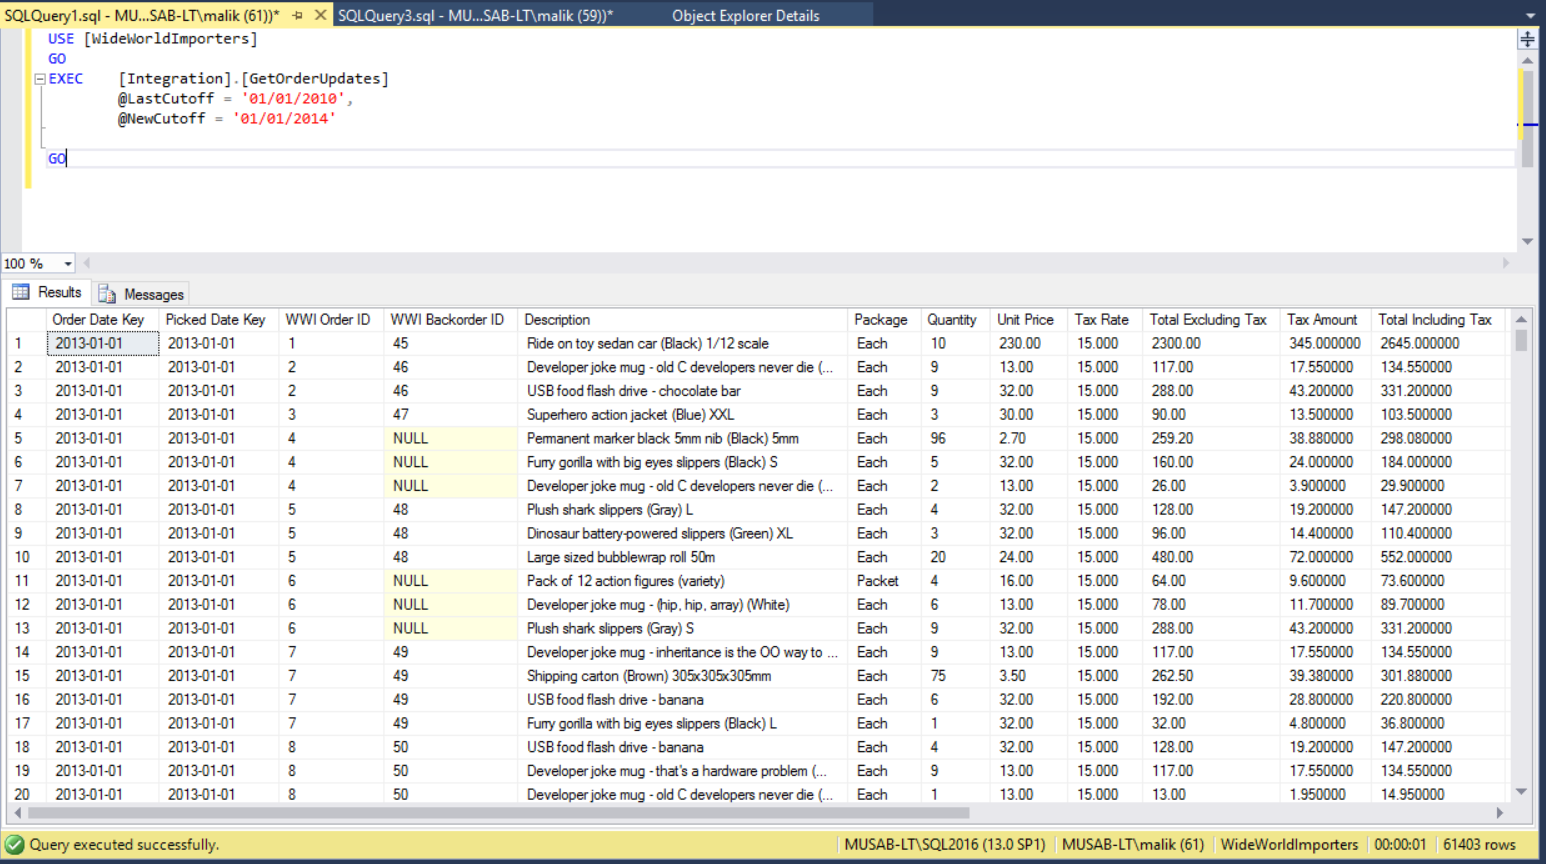
So, here I will take the example of a query used in Microsoft sample database “WideWorldImporters”. The TSQL executes a stored procedure “[Integration].[GetOrderUpdates]”.
因此,在这里我将以Microsoft示例数据库“ WideWorldImporters”中使用的查询为例。 TSQL执行存储过程“ [Integration]。[GetOrderUpdates]” 。
The call of this Stored Procedure takes around a second and I will not be optimizing it. This is just to give you an example that how may know, how this second was spent. We also want to know which part of the query is taking most time as well as on which table we must focus.
此存储过程的调用大约需要一秒钟,而我不会对其进行优化。 这只是为了给您一个示例,说明如何知道此秒是如何花费的。 我们还想知道查询的哪一部分花费最多的时间,以及我们必须关注的表。
Below is the stored procedure call and results.
下面是存储过程的调用和结果。
So now we have the call and we will dig deeper into this.
因此,现在有了电话,我们将对此进行更深入的研究。
First, we need to enable the Query Statistics for this session. We will enable CPU and IO statistics for this query session by issuing the TSQL “SET STATISTICS TIME, IO ON”.
首先,我们需要为此会话启用查询统计信息。 通过发出TSQL“ SET STATISTICS TIME,IO ON ” ,我们将为此查询会话启用CPU和IO统计信息。
After executing the mentioned above TSQL for enabling Statistics, we will get IO for each table and Total CPU cost for the queries running inside the stored procedure in Messages tab as shown in below screenshot.
在执行上述用于启用统计信息的 TSQL之后,我们将获得每个表的IO,以及在“ 消息”选项卡中存储过程中运行的查询的总CPU成本,如下面的屏幕快照所示。
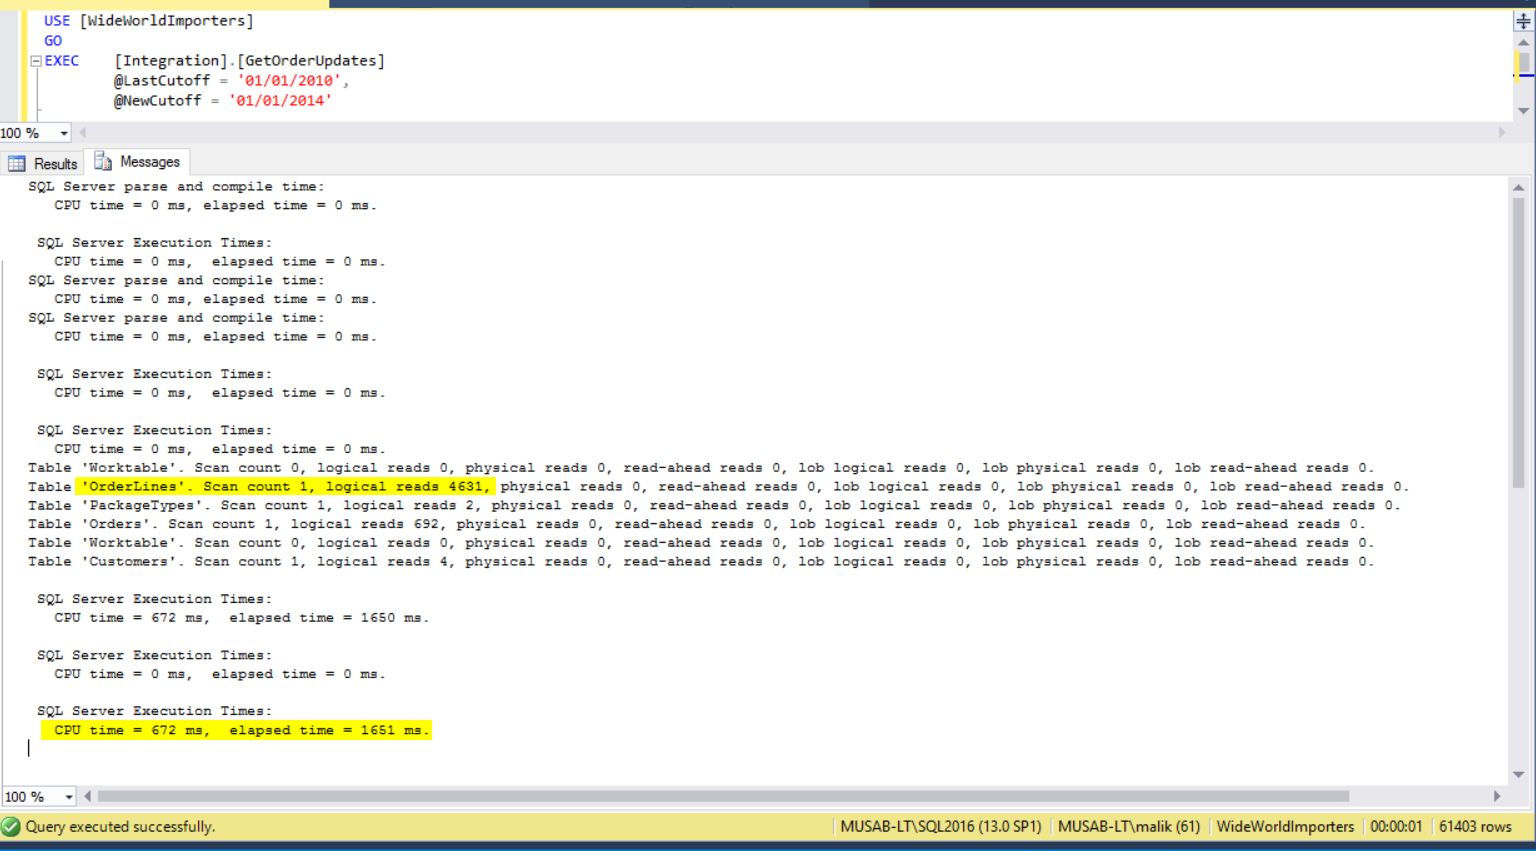
In the above screenshot, we can see that the most IO is taken by OrderLines table and there is only one query which is executing inside the Stored Procedure which is taking 672 ms CPU time (1650 ms Elapsed time).
在上面的屏幕截图中,我们可以看到OrderLines表占用了最多的IO,并且在存储过程中执行的查询只有一个,这占用了672 ms CPU时间(1650 ms经过时间)。
Note: There might be multiple queries running inside a stored procedure so keep in mind that Statistics will give you time for each query as well as the total for all the queries at the end. So, in case of Stored Procedures for total CPU time only consider the last CPU time and for each query consider its CPU time only and exclude the last CPU time as it’s only a total for all.
注意:存储过程中可能有多个查询在运行,因此请记住,统计信息将为您提供每个查询的时间以及最后所有查询的总数。 因此,在存储过程的总CPU时间情况下,仅考虑最后一个CPU时间,对于每个查询,仅考虑其CPU时间,并排除最后一个CPU时间,因为这仅是所有时间的总和。
As of now, we know that the OrderLines table is taking most of the Logical Reads.
到目前为止,我们知道OrderLines表正在执行大多数逻辑读取。
Next, we will enable the Actual Execution Plan for the query by clicking the icon
接下来,我们将通过单击图标启用查询的实际执行计划
After including the Actual Execution Plan, we will re-execute the query and view the execution plan.
包括实际执行计划后,我们将重新执行查询并查看执行计划。
Though, we can obtain much detailed information about Query Execution Plan inside SQL Server Management Studio but there is another great free tool out on web which can be used to explore Query Execution Plan in much more intuitive way that is ApexSQL Plan.
虽然,我们可以在SQL Server Management Studio中获得有关查询执行计划的详细信息,但是Web上还有另一个很棒的免费工具,可以用来以更直观的方式浏览查询执行计划,即ApexSQL Plan 。
After installing this tool, you might need to restart the SQL Server Management Studio so install it and then re-execute the query to get an Execution Plan. A screenshot tour for this tool is provided here. After executing the query, Right Click on the Execution Plan and you will have the option of “View with ApexSQL Plan”.
安装此工具后,您可能需要重新启动SQL Server Management Studio,然后进行安装,然后重新执行查询以获取执行计划。 这里提供了此工具的屏幕快照。 执行查询后,右键单击执行计划,您将选择“ 使用ApexSQL计划查看 ”。
After viewing the Execution Plan in ApexSQL Plan, you can see the highlighted items in mentioned below screenshot which will be opened in the ApexSQL Plan.
在ApexSQL计划中查看执行计划后,您可以在下面的屏幕快照中看到突出显示的项目,这些项目将在ApexSQL计划中打开。
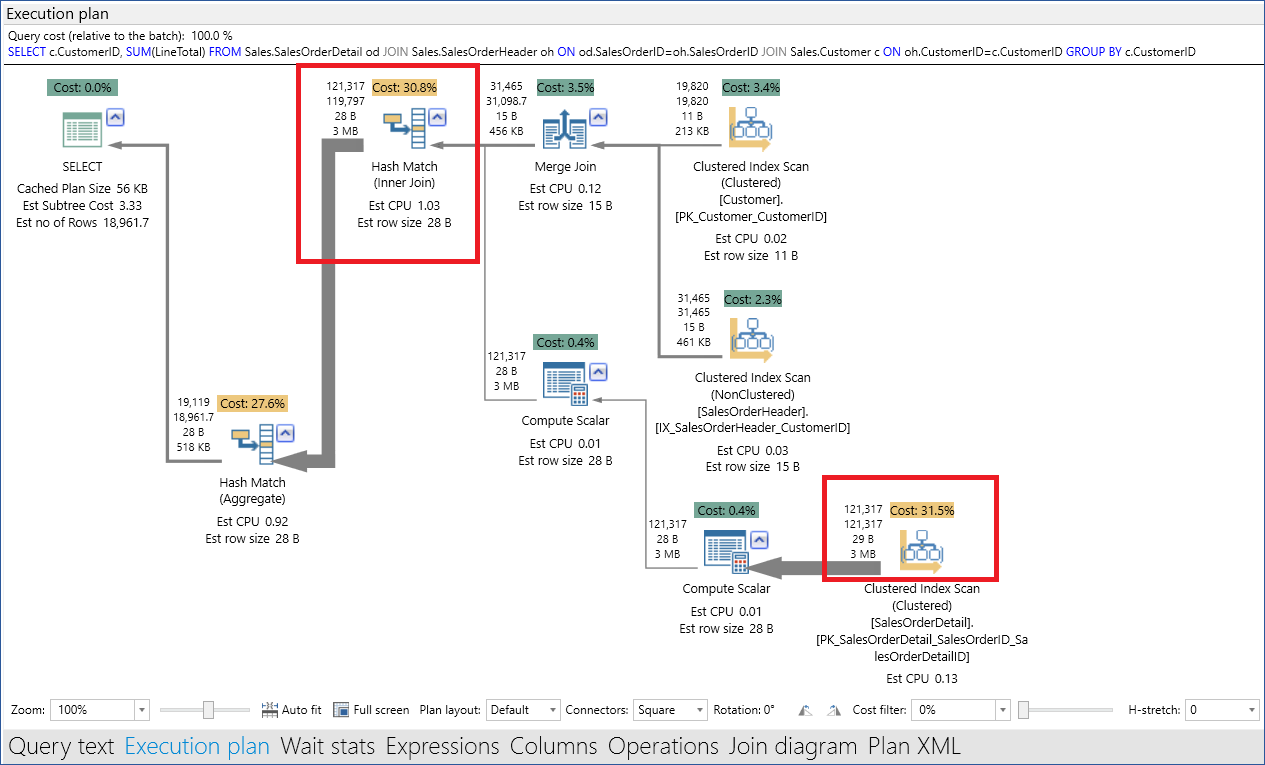
Couple of points and tips here to look at
这里要看的几点要点
- If the table is using Key Lookup, then try to remove that lookup by adding those columns in the index which is used by the table. 如果表正在使用“键查找”,请尝试通过在表使用的索引中添加这些列来删除该查找。
- If number of rows returned by the query is way off as compared to number of rows returned by table operators (as highlighted in the lower section of the query plan), then try to re-write the query which filters the data using more columns to reduce the number of rows. 如果查询返回的行数与表运算符返回的行数相去甚远(在查询计划的下部突出显示),请尝试重新编写查询,以使用更多列过滤数据减少行数。
- If estimated rows and actual rows have huge difference, then try to update the Statistics of under lying tables. 如果估计的行和实际的行有很大的差异,请尝试更新下层表的统计信息。
- If there are missing indexes indicated by the query, then try to evaluate the index and if that index is helping you query then add it to the corresponding table. 如果查询指示缺少索引,请尝试评估索引,如果该索引对您有帮助,则将其添加到相应的表中。
Finally, if your queries are performing well in single execution and only have problem while running in production load so you can easily fake the production load for a single query by using Adam Machanic’s SQL Stress Tool which is available to download from the link here. Then you can capture that slow running query from the techniques mentioned above and tune it up accordingly.
最后,如果您的查询在单次执行中表现良好,并且仅在以生产负载运行时才出现问题,那么您可以使用Adam MachanicSQL Stress Tool(可从此处的链接下载)轻松地伪造单个查询的生产负载。 然后,您可以从上述技术中捕获运行缓慢的查询,并进行相应的调整。
摘要 (Summary)
Mentioned above tools, techniques and tips are the most common solutions for troubleshooting slow running queries. These are common, generic and mostly queries do benefit from them.
上面提到的工具,技术和提示是对运行缓慢的查询进行故障排除的最常见解决方案。 这些是常见的,通用的,大多数查询确实可以从中受益。
Keep in mind there is no pet rule for performance optimization and troubleshooting the slow running queries and this topic is way too big to cover in some articles so I have tried to sum up in a single article some of the most important and common tools and techniques so that the basic trouble shooting should be made easy.
请记住,对于性能优化和对运行缓慢的查询进行故障排除,没有一条小规则,这个主题太大了,无法在某些文章中介绍,因此我试图在一篇文章中总结一些最重要,最常见的工具和技术。这样就可以简化基本的故障排除过程。
翻译自: https://www.sqlshack.com/how-to-identify-slow-running-queries-in-sql-server/
如何识别SQL Server中运行缓慢的查询相关推荐
- 【SQL】在SQL Server中多表关联查询问题
好久没有写SQL语句的多表连接查询,总在用框架进行持久化操作.今天写了一个多表关联查询,想根据两个字段唯一确定一条数据 失败的案例如下: SELECT cyb.id,ad.name FROM [Gen ...
- 数据库SQL Server中数据的模糊查询
1.Like 使用Like查询时,字段中的类容并不一定与查询内容完全匹配,只要字段中含有这些内容即可! 代码如下: select StudentName, StudentAdress from Stu ...
- 深入浅出SQL Server中的死锁
简介 死锁的本质是一种僵持状态,是多个主体对于资源的争用而导致的.理解死锁首先需要对死锁所涉及的相关观念有一个理解. 一些基础知识 要理解SQL Server中的死锁,更好的方式是通过类比从更大的面理 ...
- cte公用表表达式_CTE SQL删除; 在SQL Server中删除具有公用表表达式的数据时的注意事项
cte公用表表达式 In this article, the latest in our series on Common table expressions, we'll review CTE SQ ...
- SQL Server中数据透视表的Python脚本
This article talks about Python scripts for creating pivot tables in multiple ways. 本文讨论了以多种方式创建数据透视 ...
- sql server作业_在SQL Server中报告作业失败并发出警报
sql server作业 SQL Server Agent can be used to run a wide variety of tasks within SQL Server. The buil ...
- sql机器学习服务_机器学习服务–在SQL Server中配置R服务
sql机器学习服务 The R language is one of the most popular languages for data science, machine learning ser ...
- cte公用表表达式_在SQL Server中使用CTE进行插入和更新(公用表表达式)
cte公用表表达式 In CTEs in SQL Server; Querying Common Table Expressions the first article of this series, ...
- SQL Server中的锁的简单学习
原文:SQL Server中的锁的简单学习 简介 在SQL Server中,每一个查询都会找到最短路径实现自己的目标.如果数据库只接受一个连接一次只执行一个查询.那么查询当然是要多快好省的完成工作.但 ...
最新文章
- Hystrix 超时配置重写
- java版扫雷下载_Java 实现扫雷游戏(MineSweeper)
- POJ-2407 欧拉函数
- ubuntu php mysql5.6_Ubuntu16.04搭建php5.6Web服务器环境
- emacs .emacs_谁在乎Emacs?
- WIN10 3个手指拖动_想预防老年痴呆,这5个吃饭习惯请立刻改掉,这3个手指动作马上做起来!...
- 入门微信小程序[第六篇]微信小程序 -- 大樱桃的安排
- 暗黑系游戏_国产暗黑系手机游戏,超多种职业等你选择,雷霆游戏新作好玩吗?...
- codeforces——961A Tetris
- svn汉化失败解决方法
- AIDA64 Business Edition(系统检测)多国语言绿色特别
- appid+openid(微信小程序)
- 最美证件照工作室需要买什么东西
- CS1526号错误是什么
- java 大臣的旅费_蓝桥杯 大臣的旅费
- tp5shop tp5商城 WSTMart B2B2C开源商城系统
- 计算机网络hdcp是什么意思,4.HDCP:支持高带宽数字内容保护协议HDCP
- 手机被DNS劫持后的更改方案
- CSS之咖啡菜单网页设计
- linux 文件 复制 工具栏,Linux(Ubuntu)光盘镜像文件制作及使用攻略