SQL Server中数据透视表的Python脚本
This article talks about Python scripts for creating pivot tables in multiple ways.
本文讨论了以多种方式创建数据透视表的Python脚本。
介绍 (Introduction)
You might use PIVOT tables in Microsoft Excel for data analytics, preparing reports. It helps us to extract meaningful information from a large data set. We can transpose row into column along with aggregations on it.
您可以在Microsoft Excel中使用PIVOT表进行数据分析,并准备报告。 它有助于我们从大型数据集中提取有意义的信息。 我们可以将行及其上的聚合转置为列。
We can generate PIVOT data in different ways in SQL Server.
我们可以在SQL Server中以不同的方式生成PIVOT数据。
We can use Recursive CTE, While loop, SQL Concatenation, FOR XML PATH or CLR
我们可以使用递归CTE,While循环,SQL串联,FOR XML PATH或CLR
- Static and Dynamic SQL Pivot and Unpivot relational operator overview 静态和动态SQL Pivot和Unpivot关系运算符概述
- An overview of SSIS Pivot and SSIS Unpivot Transformations SSIS数据透视和SSIS数据透视转换概述
Python is an interactive and easy to use programming language. We explored many use cases of Python scripts on SQLShack. This article explores the use of Python for Pivot data.
Python是一种交互式且易于使用的编程语言。 我们在SQLShack上探索了许多Python脚本用例。 本文探讨了将Python用于数据透视数据的方法。
Python脚本和数据透视 (Python Scripts and Pivot)
We will explore a few methods that you can use in Python for a Pivot table. For the demonstration, create the following table and insert data into it.
我们将探讨一些可在Python中用于数据透视表的方法。 为了进行演示,请创建下表并将数据插入其中。
CREATE TABLE [dbo].[SalesData]([EmployeeID] [float] NULL,[FirstName] [nvarchar](255) NULL,[CustomerId] [float] NULL,[CustomerID1] [nvarchar](255) NULL,[CompanyName] [nvarchar](255) NULL,[OrderID] [float] NULL,[ProductID] [float] NULL,[ProductName] [nvarchar](255) NULL,[OrderDate] [datetime] NULL,[UnitPrice] [float] NULL,[Quantity] [float] NULL,[SubTotal] [float] NULL
) ON [PRIMARY]
GO
Open the following attachment to insert data into this table.
打开以下附件以将数据插入此表。
方法1:使用存储在SQL表中的数据创建数据透视 (Method 1: Create a Pivot using data stored in the SQL table)
For this demonstration, I am using data stored in the [SalesData] table of the SQLShackDemo database.
对于此演示,我使用存储在SQLShackDemo数据库的[SalesData]表中的数据。
SELECT TOP 10[FirstName],[CustomerId],[CustomerID1],[CompanyName],[OrderID],[ProductID],[ProductName],[OrderDate],[UnitPrice],[Quantity],[SubTotal]FROM [SQLShackDemo].[dbo].[SalesData] Order by [subtotal]
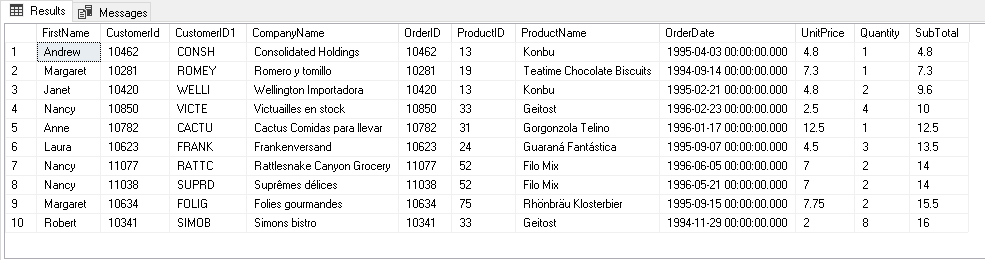
We want a PIVOT table as highlighted in the following screenshot. Here, we require Quantity, SubTotal and UnitPrice for pivot column ProductName.
我们想要一个PIVOT表,如以下屏幕快照中突出显示的那样。 在这里,我们需要枢纽列ProductName的数量,小计和单价。
We run Python scripts in SQL Server using sp_execute_external_script stored procedure.
我们使用sp_execute_external_script存储过程在SQL Server中运行Python脚本。
在SQL Server中运行Python脚本的前提条件 (Pre-requisites for running Python scripts in SQL Server)
- You should be on SQL Server 2017 or SQL Server 2019 for this article 您应该在本文SQL Server 2017或SQL Server 2019上
- Machine Services (In-Database) – Python 机器服务(数据库内)– Python
- sp_configure command sp_configure命令启用外部脚本执行
EXEC sp_configure 'external scripts enabled', 1
RECONFIGURE WITH OVERRIDE
For detailed instructions, refer to this article How to use Python in SQL Server 2017 to obtain advanced data analytics.
有关详细说明,请参阅本文如何在SQL Server 2017中使用Python以获得高级数据分析 。
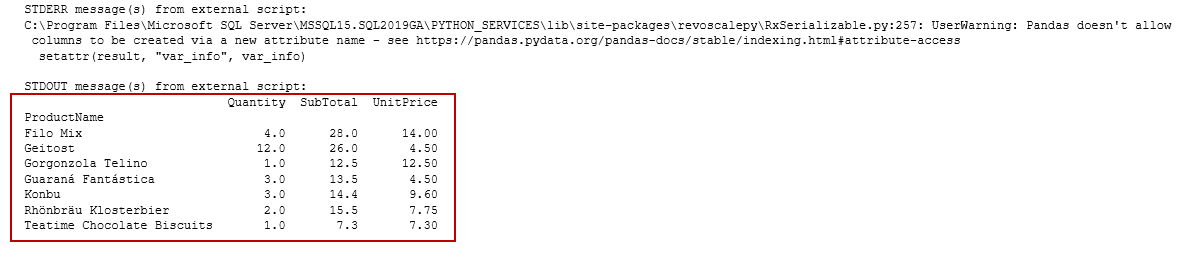
Once we have prepared the environment, execute the following Python code, and you get the output per our requirement specified above.
准备好环境后,执行以下Python代码,您将根据上面指定的要求获得输出。
EXEC sp_execute_external_script @language =N'Python',
@script=N'
import pandas as pd
import numpy as np
data = InputDataSet
#Determine pivot table
OutputDataSet = data.pivot_table(values=["UnitPrice","Quantity","SubTotal"], index=["ProductName"],
aggfunc=np.sum)
print(OutputDataSet)
',
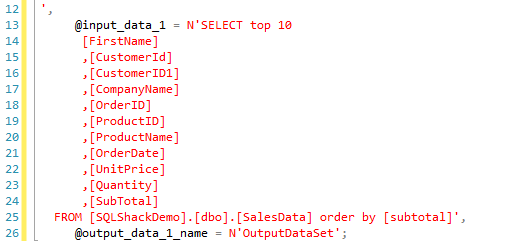
@input_data_1 = N'SELECT top 10[FirstName],[CustomerId],[CustomerID1],[CompanyName],[OrderID],[ProductID],[ProductName],[OrderDate],[UnitPrice],[Quantity],[SubTotal]FROM [SQLShackDemo].[dbo].[SalesData] order by [subtotal]',
@output_data_1_name = N'OutputDataSet'
Let’s understand the Python script.
让我们了解Python脚本。
In the first block, we use sp_execute_external_script stored procedure and define Python language for the script
在第一步中,我们使用sp_execute_external_script存储过程并为脚本定义Python语言
We import the Pandas and Numpy python module in the script. These modules provide useful functions for Pivot, data sort, aggregations.
我们在脚本中导入Pandas and Numpy python模块。 这些模块为数据透视,数据排序,聚合提供有用的功能。

In the next part, we define a data frame for the input data set. We have a pivot_table Python function for creating a pivot table from input data
在下一部分中,我们为输入数据集定义一个数据框。 我们有一个pivot_table Python函数从输入数据创建数据透视表
In data.pivot_table, we define indexes and their value column. Here, we define [ProductName] as index column and [UnitPrice],[Quantity], [SubTotal] as data value columns. Data frame OutputDataSet captures this data. We can display the output using a PRINT function
在data.pivot_table中,我们定义索引及其值列。 在这里,我们将[ProductName]定义为索引列,并将[UnitPrice],[Quantity],[SubTotal]定义为数据值列。 数据框OutputDataSet捕获此数据。 我们可以使用PRINT函数显示输出
We specify the SQL query to retrieve source data from [SalesData] table in the @input_data_1 argument
我们在@ input_data_1参数中指定SQL查询以从[SalesData]表中检索源数据
Similarly, let’s look at another example of the following source data.
同样,让我们看一下以下源数据的另一个示例。
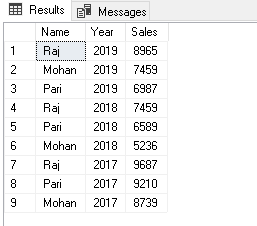
We want to generate pivot data in two formats.
我们要生成两种格式的数据透视表。
- Total Sales by each employee 每位员工的总销售额
- Total Sales by each employee in a sales year 每个员工在一个销售年度的总销售额
Execute the following Python script in SSMS.
在SSMS中执行以下Python脚本。
EXEC sp_execute_external_script @language = N'Python', @script = N'
import pandas as pd
import numpy as np
data = InputDataSet
#Determine pivot table
OutputDataSet = data.pivot_table(values=["Sales"], index=["Name"],
aggfunc=np.sum)
print(OutputDataSet)
', @input_data_1 = N'SELECT * FROM Sales', @output_data_1_name = N'OutputDataSet';
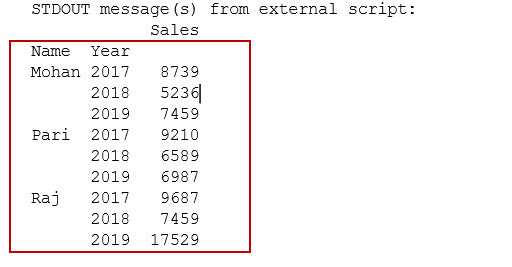
You get the following PIVOT table in the output and it satisfies our first requirement.
您将在输出中获得以下PIVOT表,它满足我们的第一个要求。
For the second requirement, let’s add a new row for Raj and now we have two entries for Raj in the year 2019.
对于第二个要求,让我们为Raj添加一个新行,现在在2019年有两个Raj条目。
Now, for this requirement, we add [Year] column as well in the index columns for Pivot.
现在,对于此要求,我们在[Pivot]的索引列中也添加[Year]列。
EXEC sp_execute_external_script @language = N'Python', @script = N'
import pandas as pd
import numpy as np
data = InputDataSet
#Determine pivot table
OutputDataSet = data.pivot_table(values=["Sales"], index=["Name","Year"],
aggfunc=np.sum)
print(OutputDataSet)
', @input_data_1 = N'SELECT * FROM Sales', @output_data_1_name = N'OutputDataSet';
In the output, we get Pivot for employees along with yearly detail. We can note that for Raj it combined both entries of year 2019 and give a sum of sales in pivot output.
在输出中,我们获得了Pivot以及每年的详细信息。 我们可以注意到,对于Raj,它合并了2019年的两个条目,并给出了枢轴输出的总销售额。
方法2:从CSV文件读取数据并使用SQL Server中的Python脚本准备PIVOT数据 (Method 2: Read data from a CSV file and prepare a PIVOT data using Python scripts in SQL Server)
In the previous examples, our source data was in SQL tables. Python can read CSV, Excel files as well using pandas’ modules.
在前面的示例中,我们的源数据在SQL表中。 Python可以使用熊猫的模块读取CSV,Excel文件。
We can store the CSV file locally in a directory, or it can read directly from a Web URL. In this demo, we use a CSV file stored on a Web URL.
我们可以将CSV文件存储在本地目录中,也可以直接从Web URL读取。 在此演示中,我们使用存储在Web URL上的CSV文件。
In the following code, we use pd.read_csv function and input a Web URL as source data. Python directly takes data from this URL, but you should have an active internet connection for it.
在以下代码中,我们使用pd.read_csv函数并输入一个Web URL作为源数据。 Python直接从该URL中获取数据,但是您应该为此具有有效的Internet连接。
data = pd.read_csv("https://media.geeksforgeeks.org/wp-content/uploads/nba.csv")
Later, we define index columns (Team, Salary) and values (college) for it. We also use aggregate function np.sum on this.
稍后,我们为其定义索引列(团队,薪水)和值(学院)。 我们还在此上使用聚合函数np.sum 。
EXEC sp_execute_external_script @language = N'Python', @script = N'
import pandas as pd
import numpy as np
data = pd.read_csv("https://media.geeksforgeeks.org/wp-content/uploads/nba.csv")
OutputDataSet = data.pivot_table(values=["College"],
index=["Team","Name","Salary","Position"], aggfunc=np.sum)
print(OutputDataSet)
', @output_data_1_name = N'OutputDataSet';
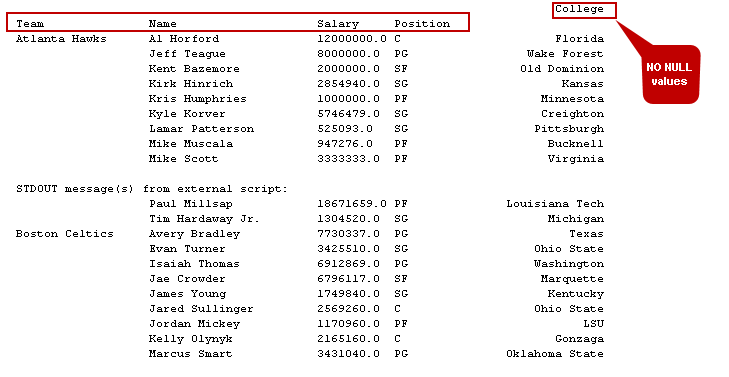
Execute this Python script and view pivot data.
执行此Python脚本并查看数据透视表数据。
In the output, we can see a few records show zero in the college column. We do not have a college name in the CSV file for those records, and in PIVOT, it shows zero for the NULL or blank cells.
在输出中,我们可以看到在College列中显示为零的一些记录。 CSV文件中没有这些记录的大学名称,在PIVOT中,NULL或空白单元格显示为零。
Suppose we do not want those records in the pivot table. Let’s drop these records having blank cells in CSV using the dropna() Python function. We use argument inplace=true to make changes in the data frame itself.
假设我们不希望数据透视表中有这些记录。 让我们使用dropna ()Python函数在CSV中删除这些具有空白单元格的记录。 我们使用参数inplace = true来更改数据框本身。
data.dropna(inplace = True)
The complete code after adding the dropna() function is below.
添加dropna()函数后的完整代码如下。
EXEC sp_execute_external_script @language = N'Python', @script = N'
import pandas as pd
import numpy as np
data = pd.read_csv("https://media.geeksforgeeks.org/wp-content/uploads/nba.csv")
data.dropna(inplace = True)
OutputDataSet = data.pivot_table(values=["College"],
index=["Team","Name","Salary","Position"], aggfunc=np.sum)
print(OutputDataSet)
', @output_data_1_name = N'OutputDataSet';
Now, execute it and notice the change in pivot tables. It eliminated records with NULL values in the output as shown in the following image.
现在,执行它并注意数据透视表中的更改。 如下图所示,它消除了输出中具有NULL值的记录。
方法3:在Python脚本中使用groupby和lambda函数的PIVOT表 (Method 3: PIVOT tables using groupby and lambda function in Python scripts)
We can use groupby and lambda functions as well in the Python scripts for Pivot tables. For this example, I have a data set of a few states of India and their cities in a SQL table.
我们也可以在数据透视表的Python脚本中使用groupby和lambda函数。 对于此示例,我在SQL表中具有印度几个州及其城市的数据集。
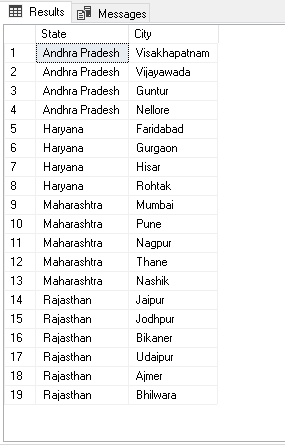
We need a pivot table from this data. In the output, it should list all cities for a state in a column; it should use || as a city name separator.
我们需要这些数据的数据透视表。 在输出中,应在列中列出某个州的所有城市; 它应该使用|| 作为城市名称分隔符。
We use the following function for our scripts.
我们对脚本使用以下功能。
- Groupby(): We use groupby() function in Python pandas data frame to split the data into the group as per defined criteria. It is a similar function as of SQL GROUP BY function. In the query, we specify the Groupby() :我们在Python熊猫数据框中使用groupby()函数,以根据定义的条件将数据拆分为组。 它与SQL GROUP BY函数类似。 在查询中,我们在状态列上指定groupby() function on the state column groupby()函数
- Lambda(): We can use a lambda function to construct anonymous functions in Python. We define expressions in this function Lambda() :我们可以使用lambda函数在Python中构造匿名函数。 我们在此函数中定义表达式
- Sorted(): It sorts the results in an ascending or descending order. It is similar to an ORDER BY clause in SQL Server Sorted():它将结果按升序或降序排序。 它类似于SQL Server中的ORDER BY子句
- Join(): The Join() function creates a concatenated string. We require it to concatenate Join(): Join()函数创建一个串联的字符串。 我们要求它连接|| in the result set ||。 在结果集中
Execute the following Python script to get the desired pivot data.
执行以下Python脚本以获取所需的数据透视表。
EXEC sp_execute_external_script @language = N'Python', @script = N'
df = Statesimport pandas as pdpivot = df.groupby("State", as_index = False).agg(lambda x: " || ".join(sorted(set(x))))OutputDataSet = pivot
', @input_data_1 = N'SELECT [State],[City]FROM [SQLShackDemo].[dbo].[States]', @input_data_1_name = N'States'WITH RESULT SETS((State NVARCHAR(100), Cities NVARCHAR(200)));
结论 (Conclusion)
In this article, we explored Python scripts for creating PIVOT tables similar to Microsoft Excel. You should explore Python as it is a popular, versatile, and useful programming language.
在本文中,我们探索了用于创建类似于Microsoft Excel的PIVOT表的Python脚本。 您应该探索Python,因为它是一种流行,通用和有用的编程语言。
翻译自: https://www.sqlshack.com/python-scripts-for-pivot-tables-in-sql-server/
SQL Server中数据透视表的Python脚本相关推荐
- Microsoft SQL Server 实现数据透视表
文章目录 使用 CASE 表达式和分组聚合 使用 PIVOT 运算符 创建动态透视表 总结 大家好,我是只谈技术不剪发的 Tony 老师.数据透视表(Pivot Table)是 Excel 中一个非常 ...
- Sql server中如何将表A和表B的数据合并(乘积方式)
sql server中如何将表A 和表B的数据合并成乘积方式,也就是说表A有2条数据,表B有3条数据,乘积后有6条数据, 这就要用到sql中的笛卡尔积方式了 1.什么是笛卡尔积 笛卡尔积在SQL中的实 ...
- 如何在SQL Server中自动进行表分区
In this article, we will demonstrate specific ways to automate table partitioning in SQL Server. Thi ...
- sas rename重命名_如何使用sp_rename命令在SQL Server中重命名表
sas rename重命名 In this article, we will learn to rename tables in SQL Server. sp_rename is a built-in ...
- Excel中数据透视表数据源更新的三种方式
Excel中数据透视表数据源更新的三种方式 1.在原有的基础上重新选择数据源 2.变数据源为表格形式,在创建一个透视表,之后如果添加的数据,选中透视表右键刷新即可 3.利用更新过的数据源再重新创建一个 ...
- wps2019数据分析加载项_WPS 2019表格中数据透视表插入计算字段操作教程
电脑越来越普及了,而大家都能熟练的操作电脑,但你知道如何在WPS表格中数据透视表插入计算字段吗?不知道了吧,其实软件操作非常简单,大家只需要按照小编下述所说的方法操作就可以了,下面小编就给大家分享这篇 ...
- SQL server 中的插入表行数据,以及插入标识值
语法介绍 (1)在SQL server数据库中我们如何添加新的行,并且添加数据呢? Insert:该语句向表中添加新行 values: 要插入的值 语法如下: Insert into 模式.表名(字段 ...
- 用于jqGrid获取SQL Server中数据的简单分页存储过程及sp_executesql的一点使用方法...
之前我第一篇有关jqGrid JSON数据的获取是动态拼接的SQL语句(因为是Access数据库),然后我自己也用SQL Server中的数据作了测试,为了方便写了一个分页的存储过程,过程中也认识了下 ...
- SQL案例学习-数据透视表
销售表数据: 通过SQL查询实现如下数据透视表: 实现SQL: SELECT COALESCE(product,'合计值') AS 产品名称, COALESCE(channel,'合计值') AS 渠 ...
最新文章
- 010 数据结构逆向—链表
- 牛客小白月赛12:月月给华华出题(欧拉函数)
- vue项目登录及token验证 vue-ant
- 电商小程序 -- 商品多规格选择弹框
- Solr 通过fl可以设置需要返回的字段
- thinkphp3 页面跳转外部链接_PPT超链接使用全攻略,你必懂的基本技巧!
- mysql自动备份linux_Mysql for linux mysql自动备份脚本
- ggplot2分面柱状图柱子比例一致_R语言柱状图
- 快速排序C语言递归代码实现
- 存储IP地址,到底用什么数据类型相对比较好
- 大文件数据传输会遇到哪些问题?
- 大数据的主要学习内容有哪些?
- 学计算机动漫设计软件,动漫设计需要学习哪些软件?
- CUDA C编程(笔记)——CUDA的异构并行计算
- IM软件中的语音录制与播放【iOS】
- Mldonkey命令解释
- macbook A1181 小白 换键盘记
- RS485 Modbus转以太网MQTT
- 数据挖掘中的 10 大算法
- HANA常用语法(持续更新)