excel切片器显示错误_Office 2016中报表用户的新Excel切片器功能
excel切片器显示错误
Whilst researching for the article Report filtering: Excel slicers vs SQL Server Reporting Services (SSRS) parameters, I discovered a new Excel Slicer feature in Microsoft Office 2016 that allows users to select/deselect multiple items without having to hold down the control (Ctrl) keyboard key. For some people, this may not be a sufficient reason to upgrade to Office 2016 but for developers of business intelligence (BI) solutions, this new feature further enhances the experience of consumers of BI solutions.
在研究“ 报告过滤:Excel Slicer 与SQL Server Reporting Services(SSRS)参数”一文时 ,我在Microsoft Office 2016中发现了一个新的Excel Slicer功能,该功能使用户可以选择/取消选择多个项目而无需按住控件( Ctrl )键盘键。 对于某些人来说,这可能不是升级到Office 2016的充分理由,但对于商业智能(BI)解决方案的开发人员而言,此新功能进一步增强了BI解决方案的消费者的体验。
背景 (Background)
Since its initial release in Office 2010, slicers have always been part of the excel reports that I produce for my clients. As per the explanation here, slicers have several advantages to the traditional filtering approach that has long existed in Excel Pivots. Some of these advantages can be summarised as follows:
自从Office 2010首次发布以来,切片器一直是我为客户生成的excel报告的一部分。 根据此处的说明,切片器相对于Excel Pivots中长期存在的传统过滤方法具有多个优点。 其中的一些优势可以总结如下:
Easily visualise items you have filtered on
轻松可视化已过滤的项目
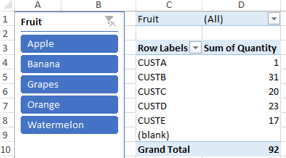
Some of the negative feedback relating to my excel reports had nothing to do with my report development but limitations of the tool in that users were usually frustrated when attempting to identify items that they have chosen as filters. For instance, Figure 1 shows my fictitious fruit sales report by total quantities of fruits purchased per customer. The screenshot shows that there are filters in the report but there is now way of knowing the actual items except for that there are (Multiple Items).
与我的excel报表有关的一些负面反馈与我的报表开发无关,但是该工具的局限性在于,在尝试识别他们选择作为筛选器的项目时,用户通常会感到沮丧。 例如, 图1显示了我的虚拟水果销售报告,其中包含每个客户购买的水果总数。 屏幕快照显示报告中有过滤器,但是除了(Multiple Items)之外,现在有一种了解实际项目的方法。

Figure 1: Traditional Excel Pivot Report Filter 图1:传统的Excel Pivot报表过滤器
In order to identify the items, you would have to click the dropdown, as shown in Figure 2. This is less frustrating because dataset from my fictitious scenario is small, but if you are referencing datasets from production systems – you are more likely to scroll down the list just to see the selected items.
为了识别项目,您必须单击下拉列表, 如图2所示。 因为我的虚拟场景中的数据集很小,所以这样做不会感到沮丧,但是如果您引用生产系统中的数据集,则可能会向下滚动列表以查看所选项目。
Figure 2: Multiple Items in Traditional Excel Pivot Report Filter 图2:传统Excel Pivot报表过滤器中的多个项目
On the other hand, however, a slicer not only indicate the presence of filters (as highlighted in Figure 3), I can also see the selected filter items.
但是,另一方面,切片器不仅指示过滤器的存在( 如图3中突出显示),我还可以看到选择的过滤器项。
Figure 3: Filtering using Excel Slicers 图3:使用Excel Slicers进行过滤
Visually Indicate items with no data
直观地指示没有数据的项目
Another benefit to using slicers is that you can visually indicate items that have no data. Say for instance, we refactor our dataset and add a dummy type of fruit called – SIFISOTEST, as shown in row 13 of Figure 4.
使用切片器的另一个好处是,您可以直观地指示没有数据的项目。 例如,我们重构数据集并添加一个称为– SIFISOTEST的虚拟水果, 如图4的第13行所示 。
Figure 4: Dummy Fruit Type 图4:虚拟水果类型
Once we have refreshed the pivot report, we can see in Figure 5 that SIFISOTEST is now part of items of our fruit slicer. It can also be seen that because there are no transactional data associated with this new dummy fruit, the background colour of the SIFISOTEST fruit is different to other items. Thus, report users can intuitively see that SIFISOTEST has no data.
刷新数据透视表报告后,我们可以在图5中看到SIFISOTEST现在是水果切片机项目的一部分。 还可以看到,因为没有与此新的虚拟水果相关的交易数据,所以SIFISOTEST水果的背景颜色与其他项目不同。 因此,报表用户可以直观地看到SIFISOTEST没有数据。
Figure 5: Updated items of in fruit slicer 图5:水果切片机中的更新项目
However, this works differently in the traditional filter as it can be seen in Figure 6 that there is no convenient way to differentiate items that do not have data.
但是,这在传统过滤器中的工作方式有所不同, 如图6所示 ,没有一种简便的方法可以区分没有数据的项目。
Figure 6: Updated items of in fruit filter 图6:水果过滤器中的更新项目
Hide items with no data
隐藏没有数据的项目
Another advantage of slicers is that they allow users to exclude filter items with no data from showing up in a slicer. This is achieved via the Slicer Settings property as shown in Figure 7.
切片器的另一个优点是,它们允许用户排除没有数据的过滤器项以使其不显示在切片器中。 这可以通过“ 切片器设置”属性来实现, 如图7所示。
Figure 7: Slicer settings dialog box 图7:“切片器设置”对话框
Immediately after you have clicked the OK button to save your Slicer settings, the SIFISOTEST item disappears from the slicer list as shown in Figure 8.
单击OK按钮以保存您的Slicer设置后, SIFISOTEST项目立即从切片器列表中消失, 如图8所示。
SIFISOTEST fruitSIFISOTEST水果的切片器项目
Custom Slicer Positions
自定义切片器位置
Much of report development has to do with working on the look and feel of the report. Some of the frustrations with traditional report filter in Excel is that you cannot move the positions of your report filters.
报表的大部分开发与处理报表的外观有关。 Excel中传统报表过滤器的一些不足之处是您无法移动报表过滤器的位置。
Figure 9: Traditional filter positions 图9:传统过滤器位置
For instance, if you try cut and move the filters in rows 1-3 shown in Figure 9 to be underneath the grand total row or delete row 4, you will run into a cells locked error message as shown in Figure 10.
例如,如果您尝试将图9所示的1-3行中的过滤器剪切并移动到总行或删除行4的下方,则会遇到如图10所示的单元锁定错误消息。
Figure 10: Filter error message 图10:过滤器错误消息
This limitation is resolved in slicers as you are able to move them around as shown in Figure 11.
切片器可以解决此限制,因为您可以如图11所示移动它们。
Figure 11: Slicers in different positions 图11:不同位置的切片机
新功能 (The New Feature)
Although since its release in Office 2010, slicers continue to be located in the INSERT menu over the releases, they have evolved in terms of graphical icons as well as functionality. In Office 2010, the slicer was a simple control that looked as shown in Figure 12.
尽管自从Office 2010中发布切片器以来,切片器仍继续位于该发行版的INSERT菜单中,但它们在图形图标和功能方面已经发展。 在Office 2010中 ,切片器是一个简单的控件,外观如图12所示。
Although no functional slicer feature was added during the release of Office 2013, a new graphical slicer icon was introduced along with a new slicer sibling, the Timeline filter – as shown in Figure 13.
尽管在Office 2013发行期间未添加功能切片器功能,但还是引入了新的图形切片器图标以及新的切片器兄弟级时间线筛选器- 如图13所示。
In Office 2016, the slicer and timeline filters return with similar graphical icons but with a new functionality for selecting and de-selecting filter items as shown in Figure 14.
在Office 2016中 ,切片器和时间轴筛选器以相似的图形图标返回,但具有用于选择和取消选择筛选器项的新功能, 如图14所示。
As soon as you add a slicer, you will notice the new icon next to the Clear Filter button. Now, if you want to filter our fictitious dataset on Grapes and Apples – you just activate multi-select by clicking on the new icon and then select the two fruit names.
添加切片器后,您会注意到“ 清除过滤器”按钮旁边的新图标。 现在,如果您要过滤葡萄和苹果上的虚拟数据集,只需单击新图标激活多选,然后选择两个水果名称即可。
Couple of things to note:
需要注意的几件事:
- To disable multi-selection, click on the icon again – which will reset it background colour to a transparent white. 要禁用多选,请再次单击该图标,这会将其背景色重置为透明的白色。
- The multi-select button can be used to both select and deselect/remove multiple items from the slicer 多选按钮可用于从切片器中选择和取消选择/删除多个项目
- Like so many controls in Microsoft Office, there is a keyboard shortcut for enabling the multi select without clicking the button. That is done by, Click alt S 像Microsoft Office中的许多控件一样,这里有一个键盘快捷键,无需单击该按钮即可启用多重选择。 这是通过单击alt S完成的
- If you prefer the old way of doing things, you can still control keyboard key to select/deselect items 如果您喜欢旧的处理方式,仍然可以控制键盘键来选择/取消选择项目
- One noticeably difference with slicer is that you can add duplicate slicers and the report won’t notice it 切片器的一个明显区别是您可以添加重复的切片器,而报告不会注意到它
结论 (Conclusion)
Ever since the initial introduction of slicers in excel 2010, report usability experience has been enhanced as slicers continue to be a better alternative to traditional report filters. The introduction of an effortless multi-select slicer in further strengthens excel as one of the leading data visualisation tools for many report users.
自从Excel 2010中首次引入切片器以来,由于切片器仍是传统报表过滤器的更好替代,因此报告可用性经验得到了增强。 毫不费力的多选切片器的引入进一步增强了excel作为许多报表用户的领先数据可视化工具之一的优势。
参考 ( Reference )
- Office 2016Office 2016
- Excel Pivot TablesExcel数据透视表
- Business Intelligence Solutions商业智能解决方案
翻译自: https://www.sqlshack.com/new-excel-slicer-feature-for-report-users-in-office-2016/
excel切片器显示错误
excel切片器显示错误_Office 2016中报表用户的新Excel切片器功能相关推荐
- excel切片器显示错误_使用切片器在Excel中设置过滤条件
excel切片器显示错误 In most cases, it's best if you keep people away from your data in Excel. It's too easy ...
- excel切片器显示错误_带切片器的Excel弹出选择器工具
excel切片器显示错误 Slicers make it easy to select from a list of items, but they take up valuable space on ...
- win10照片查看器_图片打开方式中找不到Windows图片查看器怎么办
如何在电脑中使用默认的windows图片查看器来打开图片进行查看的?有时我们可能无法找到Windows图片查看器工具,接下来小编就与大家分享,一种简单的利用windows图片查看器查看图片的具体方法. ...
- html excel导出的路径,html 导出多个excel表格数据-如何将html页面中的表格导出到excel表格...
怎样将html表格导出到excel中啊?我用的是asp.net. stringbuilder拼接的也就是说,是用字符组成的表格,这并不是意义上的表格. 要实现导出EXCEL的较麻烦,给你讲一下解题思路 ...
- excel表格横向纵向变换_什么是报表工具?和 EXCEL 有什么区别?
报表是什么? 带数据的表格和图表就都是报表,像工资表,考勤表,成绩表,资产负载表等等都是报表. 那报表工具,顾名思义就是用来做报表的工具,那 Excel 是不是也算报表工具?广义上讲当然也算.但 IT ...
- php使mysql显示错误_如何针对依赖用户输入的长查询在PHP中显示MySQL错误?
在PHP中,我试图执行一个长的MySQL查询,该查询取决于用户输入.但是,我的查询失败,并显示以下消息, "Query Failed". 实际上,每当查询失败时,我都会打印此消息, ...
- excel表格行列显示十字定位_Excel中十字交叉高亮显示的几种方法,再不会看错行了...
日常工作中,表格数据很多的情况下,查看某个数据时,一不小心就会把行.列数据看错,今天小编教大家一个十字交叉高亮显示的几种方法,数据点到哪里,就会自动以聚光灯的效果突出显示行.列,再也不担心看错数据了. ...
- excel表格行列显示十字定位_EXCEL中如何设置点击任意一个单元格出现一个十字架标明行和列...
在Excel中,为了增强活动单元格的对比性,有时候我们常常需要修改其背景颜色.字体.字号等,用来区分和其它单元格的对比! 本教程,让我们一起来学习,如何让Excel活动单元格所在行和列都着上背景颜色, ...
- 【excel】如何显示与取消表格中的打印虚线
办公技巧 一.显示打印虚线 首先选择[页面布局]→[纸张大小],这里我选择A4. 然后点击[显示分页符]就会显示打印虚线. 二.取消打印虚线 取消勾选[显示分页符]即可.
最新文章
- java无刷新上传图片_【java实现web文件无刷新上传】
- 物理学走到尽头了吗 | 维尔切克专栏
- 华为有了鸿蒙就可以翻身吗,鸿蒙2.0要来了,华为手机能靠此翻身吗?
- object-c 1
- 初识c++中的函数模板
- 虚拟专题:知识图谱 | 流程工业控制系统的知识图谱构建
- Python、TensorFlow、机器学习、深度学习四件套(附免费下载)
- c语言随机生成1到100随机数_VB之生成随机数
- python 中self
- 【转】 pycharm快捷键、常用设置、配置管理(后两者详见原博客)
- 超声波传感器测距实验
- 读书笔记 ——《系统程序员成长计划》篇4:拥抱变化
- linux_主线程子线程退出关系
- Proteus——测量脉冲频率
- 牛人整理的一些查询国内外文献资料的实用网站,专业啊,吐血推荐!
- 生日悖论 Birthday Paradox 至少有两人同一天生日概率
- python小数点处理_如何在python中打小数点
- 三郎前端特效学习源代码:图片主页轮播组件
- 机器学习西瓜书学习——绪论
- 团队多人协作、研发协作、项目管理、敏捷开发协作平台