MySQL-MongoDB开源监控利器之PMM
最近要对数据库的监控体系进行改进,发现Percona 公司的一款开源的监控工具Percona Monitoring and Management(PMM) 对于MySQL的监控指标各项值比较全面准确,现在公司内部的开发测试环境进行了部署体验。
主要的架构图如下:源于官方

可以看到主要是由客户端的代理程序node_export\mysqld_export\mongodb_export等和客户端管理工具pmm-admin做为数据的收集方式并发送到服务端的QAN API\Consul API\Prometheus等各个API然后通过Grafana来展示数据指标,界面非常靓丽
Pmm 的server端的运行方式主要有官方提供的以下三种方式:
1.已经集成好的Docker方式
2.集成好的VirtualBox方式
3. Amazon Machine Image (AMI)
在这里我用的是Docker方式,轻量部署、升级很方便
PMM的client安装比较方便,直接安装官方的yum安装就OK了
#详细的请参考官方文档
https://www.percona.com/doc/percona-monitoring-and-management/index.html
#Dokcer方式部署
提前准备好系统和Docker服务,安装不在这里展示
1-创建容器的数据磁盘
docker create \-v /opt/prometheus/data \-v /opt/consul-data \-v /var/lib/mysql \-v /var/lib/grafana \--name pmm-data \percona/pmm-server:1.1.1 /bin/true
2-创建容器的运行实例
docker run -d \-p 80:80 \--volumes-from pmm-data \--name pmm-server \--restart always \percona/pmm-server:1.1.1
#客户端安装
[root@master ~]# yum install http://www.percona.com/downloads/percona-release/redhat/0.1-4/percona-release-0.1-4.noarch.rpm
[root@master ~]# yum install -y pmm-client
#增加客户端mysql监控
[root@master ~]# pmm-admin config --server 192.168.100.171
OK, PMM server is alive.
PMM Server | 192.168.100.171
Client Name | master.wboy.com
Client Address | 192.168.100.41
[root@master ~]# pmm-admin list
pmm-admin 1.1.1
PMM Server | 192.168.100.171
Client Name | master.wboy.com
Client Address | 192.168.100.41
Service Manager | unix-systemv
No monitoring registered for this node identified as 'master.wboy.com'.
#命令帮助
[root@master ~]# pmm-admin add --help
This command is used to add a monitoring service.
Usage:
pmm-admin add [command]
Available Commands:
mysql Add complete monitoring for MySQL instance (linux and mysql metrics, queries).
linux:metrics Add this system to metrics monitoring.
mysql:metrics Add MySQL instance to metrics monitoring.
mysql:queries Add MySQL instance to Query Analytics.
mongodb Add complete monitoring for MongoDB instance (linux and mongodb metrics).
mongodb:metrics Add MongoDB instance to metrics monitoring.
proxysql:metrics Add ProxySQL instance to metrics monitoring.
Flags:
--service-port uint16 service port
Global Flags:
-c, --config-file string PMM config file (default "/usr/local/percona/pmm-client/pmm.yml")
Use "pmm-admin add [command] --help" for more information about a command.
[root@master ~]# pmm-admin add mysql --help
This command adds the given MySQL instance to system, metrics and queries monitoring.
When adding a MySQL instance, this tool tries to auto-detect the DSN and credentials.
If you want to create a new user to be used for metrics collecting, provide --create-user option. pmm-admin will create
a new user 'pmm@' automatically using the given (auto-detected) MySQL credentials for granting purpose.
Table statistics is automatically disabled when there are more than 10000 tables on MySQL.
[name] is an optional argument, by default it is set to the client name of this PMM client.
Usage:
pmm-admin add mysql [name] [flags]
Examples:
pmm-admin add mysql --password abc123
pmm-admin add mysql --password abc123 --create-user
pmm-admin add mysql --password abc123 --port 3307 instance3307
Flags:
--create-user create a new MySQL user
--create-user-maxconn uint16 max user connections for a new user (default 10)
--create-user-password string optional password for a new MySQL user
--defaults-file string path to my.cnf
--disable-binlogstats disable binlog statistics
--disable-processlist disable process state metrics
--disable-tablestats disable table statistics
--disable-tablestats-limit uint16 number of tables after which table stats are disabled automatically (default 1000)
--disable-userstats disable user statistics
--force force to create/update MySQL user
--host string MySQL host
--password string MySQL password
--port string MySQL port
--query-source string source of SQL queries: auto, slowlog, perfschema (default "auto")
--socket string MySQL socket
--user string MySQL username
Global Flags:
-c, --config-file string PMM config file (default "/usr/local/percona/pmm-client/pmm.yml")
--service-port uint16 service port
#增加本地mysql实例
[root@master ~]# pmm-admin add mysql --user root --password root
[linux:metrics] OK, now monitoring this system.
[mysql:metrics] OK, now monitoring MySQL metrics using DSN root:***@unix(/var/lib/mysql/mysql.sock)
[mysql:queries] OK, now monitoring MySQL queries from slowlog using DSN root:***@unix(/var/lib/mysql/mysql.sock)
安装完成后的访问地址列表:其实在 landing page包含了下面三个功能的页面
| 各个组件 | 功能访问地址 |
|---|---|
| PMM landing page | http://192.168.100.1 |
| Query Analytics (QAN web app) | http://192.168.100.1/qan/ |
| Metrics Monitor (Grafana) |
http://192.168.100.1/graph/ User name: admin Password: admin |
| Orchestrator | http://192.168.100.1/orchestrator |
##
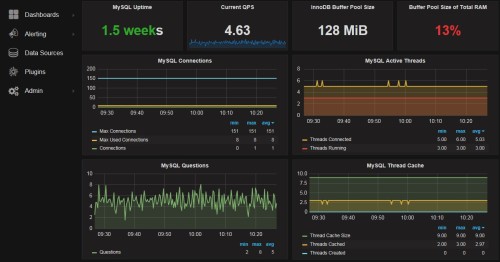
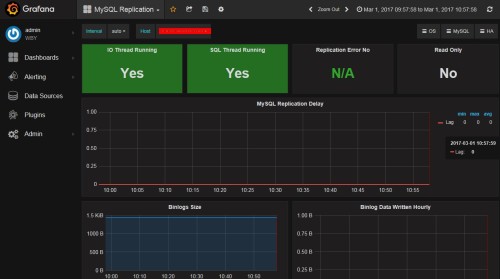
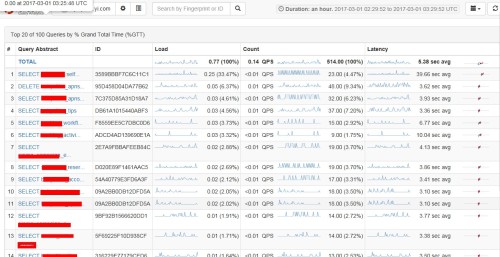
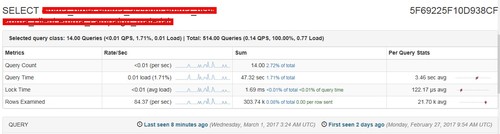
下面是一些截图界面
转载于:https://blog.51cto.com/andylhz2009/1902272
MySQL-MongoDB开源监控利器之PMM相关推荐
- mysql pt监控_技术分享 | MySQL 监控利器之 Pt-Stalk
作者:xuty 本文来源:原创投稿 *爱可生开源社区出品,原创内容未经授权不得随意使用,转载请联系小编并注明来源. 一.概述 之前在社区发了一篇[有效解决 MySQL 行锁等待超时问题]文档,主要介绍 ...
- pt5 mysql预处理_技术分享 | MySQL 监控利器之 Pt-Stalk
一.概述 之前在社区发了一篇[有效解决 MySQL 行锁等待超时问题]文档,主要介绍了下行锁超时的监控方法,下方评论中有人提到了 pt-stalk 工具也可以监控行锁超时,因为个人没怎么用过这个工具, ...
- 监控利器之 Prometheus
作者:xizhibei 编辑:moon 原文:https://github.com/xizhibei/blog/issues/54 一直以来,我们会在项目中,使用 APM 去监控应用的状况,分析性能等 ...
- 使用Prometheus+Grafana 监控MySQL/MONGODB
使用Prometheus+Grafana 监控MySQL/MONGODB 之前就久仰 Prometheus 大名,因为有用zabbix 进行监控,就没去安装它.现在正好用上监控MONGO+MYSQL. ...
- php图形开发工具,dba 开源工具:面向开发的MySQL图形可视化监控
工具研发者介绍 贺春旸,凡普金科DBA团队负责人,<MySQL管理之道:性能调优.高可用与监控>第一.二版作者,曾任职于中国移动飞信.安卓机锋网.致力于MariaDB.MongoDB等开源 ...
- python利器怎么编程-Python任务调度利器之APScheduler详解
任务调度应用场景 所谓的任务调度是指安排任务的执行计划,即何时执行,怎么执行等.在现实项目中经常出现它们的身影:特别是数据类项目,比如实时统计每5分钟网站的访问量,就需要每5分钟定时从日志数据分析访问 ...
- 系统重构数据同步利器之Canal实战篇
一.背景 二话不说,先上图 上图来自于官网(https://github.com/alibaba/canal),基本上涵盖了目前生产环境使用场景了,众所周知,Canal做数据同步已经是行业内标杆了.我 ...
- 小米的开源监控系统open-falcon架构设计,看完明白如何设计一个好的系统
小米的开源监控系统open-falcon架构设计,看完明白如何设计一个好的系统 小米的http://book.open-falcon.org/zh/intro/ 早期,一直在用zabbix,不过随着业 ...
- 主流开源监控系统汇总
监控做为自动化运维的重要组成部分,承担着反馈的作用. 以往,在缺少告警机制的情况下,企业无法第一时间洞悉到系统发生故障,只能通过用户的反馈来获取,系统运维人员往往也只是充当了一个"救火&qu ...
最新文章
- this. $ refs: undefined 的解决办法
- 用twisted为未来安排任务(Scheduling tasks for the future
- Explain:解决MUI 软键盘弹起挤压页面问题
- 何佳文(帮别人名字作诗)
- JetBrains 开发者调查 - 编程语言趋势
- strust2自定义拦截器
- t3 深入Tornado
- 《C++ Primer 4th》读书笔记 第7章-函数
- tp获取referer里的域名_thinkPHP的redirect跳转和referer使用的问题
- python socket读取数据不能解析_通过实例解析return运行原理,除了quot;生孩子quot;python真是无所不能啊...
- 批量关停azure vm_如何从Azure VM数据库运行本地SQL报表
- 搭载自研芯片马里亚纳 MariSilicon X,OPPO Find X5系列正式发布
- UE4项目的命名规则
- Java: 将中文名转换为指定格式拼音
- Java使用iTextPDF生成PDF文件
- ant下载与本地配置
- 面试官:说说你对 options 请求的理解
- mqtt 传文件断开连接的原因_MQTT系列 | MQTT的连接和断开
- leetcode刷题技巧
- python之父:一个合格的python程序员,应该从这三本书入手!