hdf5文件和csv的区别_使用HDF5文件并创建CSV文件
hdf5文件和csv的区别
In my last article, I discussed the steps to download NASA data from GES DISC. The data files downloaded are in the HDF5 format. HDF5 is a file format, a technology, that enables the management of very large data collections. Thus, it is quite popular for storing information. For getting NASA’s data, please check the below article first:
在上一篇文章中,我讨论了从GES DISC下载NASA数据的步骤。 下载的数据文件为HDF5格式。 HDF5是一种文件格式,一种技术,可以管理非常大的数据集。 因此,在存储信息方面非常流行。 要获取NASA的数据,请先查看以下文章:
Whenever I work with datasets, I’m most comfortable with CSV files. Thus, once I got the HDF5 files, I decided to look for ways to change them to CSV files. I found the package h5py in Python, which enables the reading in of HDF5 files. Thus, this article articulates the steps to use h5py and convert HDF5 to CSV. You can follow along by referring to the complete notebook at the link below.
每当我使用数据集时,我对CSV文件都很满意。 因此,一旦获得HDF5文件,我便决定寻找将其更改为CSV文件的方法。 我在Python中找到了h5py软件包,该软件包可以读取HDF5文件。 因此,本文阐述了使用h5py并将HDF5转换为CSV的步骤。 您可以通过以下链接参考完整的笔记本。
导入库 (Import libraries)
For this work, we’ll require two libraries. The first library is h5py which has the option to read and work with HDF5 files (documentation). The second package we need is numpy to work with arrays. Finally, we will import pandas so we can create a dataframe and later save it as a CSV file.
对于这项工作,我们将需要两个库。 第一个库是h5py ,它具有读取和使用HDF5文件( 文档 )的选项。 我们需要的第二个包是使用numpy来处理数组。 最后,我们将导入pandas以便我们可以创建一个数据框,然后将其另存为CSV文件。
import h5py
import numpy as np
import pandas as pd
加载数据集 (Load dataset)
The next step is to load in the HDF5 file. Note that for this example, I’m working with GPM data collected from GES DISC for January, 2020 for the whole world. It’s located inside the data folder in the GitHub repo (downloaded from GES DISC website).
下一步是加载HDF5文件。 请注意,在此示例中,我正在使用从GES DISC收集的2020年1月全世界的GPM数据。 它位于GitHub存储库中的data文件夹内(可从GES DISC网站下载)。
I’ll use the File method from the h5py library to read the HDF5 file and save it to the variable called dataset. I specify the name of the file along with the full path as the first argument and set the second argument as r indicating that I’m working with this file in the read only mode.
我将使用h5py库中的File方法读取HDF5文件并将其保存到名为dataset的变量中。 我将文件名以及完整路径指定为第一个参数,并将第二个参数设置为r指示我正在以只读模式使用此文件。
dataset = h5py.File('data/gpm_jan_2020.HDF5', 'r')探索数据集 (Explore dataset)
Now that the file is all loaded in, we can get started with exploring the dataset. The elements of this file are similar to a Python dictionary. Thus, it comprises of key-value pairs. So, I started by looking at the various keys in this file.
现在文件已全部加载完毕,我们可以开始探索数据集了。 该文件的元素类似于Python字典。 因此,它包含键值对。 因此,我首先查看了此文件中的各种键。
dataset.keys()## Output
# <KeysViewHDF5 ['Grid']>
As we see in the result above, there is just one key called Grid. As we do not see any data, the data might be inside the value of this key; so that’s what I do, I read its value using dataset[’Grid’] into grid and look at its keys.
正如我们在上面的结果中看到的,只有一个名为Grid键。 由于我们看不到任何数据,因此该数据可能在此键的值之内; 这就是我的工作,我使用dataset['Grid']将其值读取到grid并查看其键。
grid = dataset['Grid']
grid.keys()## Output
# <KeysViewHDF5 ['nv', 'lonv', 'latv', 'time', 'lon', 'lat', 'time_bnds', 'lon_bnds', 'lat_bnds',
# 'precipitation', 'randomError', 'gaugeRelativeWeighting', 'probabilityLiquidPrecipitation',
# 'precipitationQualityIndex']>
Finally, we see the data. We have several features that we can use. All of these represent keys and they will have their corresponding values, which is what we’re looking for. For this work, I’m only interested in latitude, longitude and the precipitation at that latitude-longitude combination.
最后,我们看到了数据。 我们有几个可以使用的功能。 所有这些都代表键,并且它们将具有它们对应的值,这就是我们想要的。 对于这项工作,我只对纬度,经度和该纬度-经度组合处的降水感兴趣。
Let’s take a look at each of these features one by one.
让我们一一看一下这些功能。
经度 (Longitude)
I print the longitude key and its attributes. We find that there are 3600 values for longitude. In the attributes, the units and standard_name are the two things I would like to use.
我打印经度键及其属性。 我们发现经度有3600个值。 在属性中, units和standard_name是我要使用的两件事。
print("Longitude data: {}".format(grid['lon']))
print("Longitude data attributes: {}".format(list(grid['lon'].attrs)))## Output
# Longitude data: <HDF5 dataset "lon": shape (3600,), type "<f4">
# Longitude data attributes: ['DimensionNames', 'Units', 'units',
# 'standard_name', 'LongName', 'bounds', 'axis', 'CLASS', 'REFERENCE_LIST']print("Name: {}".format(grid['lon'].attrs['standard_name'].decode()))
print("Unit: {}".format(grid['lon'].attrs['units'].decode()))## Output
# Name: longitude
# Unit: degrees_east
纬度 (Latitude)
Similar to longitude, I check the key and its attributes. There are 1800 latitude values and units and standard_name are useful to me.
与经度类似,我检查键及其属性。 有1800个纬度值, units和standard_name对我有用。
print("Latitude data: {}".format(grid['lat']))
print("Latitude data attributes: {}".format(list(grid['lat'].attrs)))## Output
# Latitude data: <HDF5 dataset "lat": shape (1800,), type "<f4">
# Latitude data attributes: ['DimensionNames', 'Units', 'units',
# 'standard_name', 'LongName', 'bounds', 'axis', 'CLASS', 'REFERENCE_LIST']print("Name: {}".format(grid['lat'].attrs['standard_name'].decode()))
print("Unit: {}".format(grid['lat'].attrs['units'].decode()))## Output
# Name: latitude
# Unit: degrees_north
沉淀 (Precipitation)
I print the key and attributes for precipitation.
我打印沉淀的键和属性。
print("Precipitation data: {}".format(grid['precipitation']))
print("Precipitation data attributes: {}".format(list(grid['precipitation'].attrs)))## Output
# Precipitation data: <HDF5 dataset "precipitation": shape (1, 3600, 1800), type "<f4">
# Precipitation data attributes: ['DimensionNames', 'Units', 'units', 'coordinates',
# '_FillValue', 'CodeMissingValue', 'DIMENSION_LIST']print("Unit: {}".format(grid['precipitation'].attrs['units'].decode()))## Output
# Unit: mm/hr
The precipitation data is a 3-dimensional array with the precipitation values stored as a 2-d matrix. It has the shape (3600, 1800) meaning it has precipitation values across all combinations of longitude and latitude. Further, the units of precipitation are found in the units attribute as mm/hr.
降水量数据是一个3维数组,其中降水量值存储为2-d矩阵。 它的形状为(3600,1800),表示在所有经度和纬度组合中都具有降水值。 此外,在units属性中以mm/hr为units找到降水的units 。
创建数据框 (Create dataframe)
As we now know all the things we want to capture in the final CSV file, we’ll directly proceed with capturing that.
现在我们知道了要在最终CSV文件中捕获的所有内容,我们将直接进行捕获。
Our dataset will have 6,480,000 rows (3600x1800). Each of these rows has a unique combination of longitude and latitude. Thus, for each longitude, we have a latitude and the corresponding precipitation value.
我们的数据集将有6,480,000行(3600x1800)。 这些行中的每行都有经度和纬度的唯一组合。 因此,对于每个经度,我们都有一个纬度和相应的降水值。
To create the list of longitude values for all precipitation values, we need to repeat each value of the longitude list 1800 times. This is saved as longitude_values with a total length of 6,480,000 values (3600 longitude values, each repreated 1800 times) using np.repeat().
要为所有降水值创建经度值列表,我们需要将经度列表的每个值重复1800次。 使用np.repeat()将其保存为longitude_values值,总长度为6,480,000个值(3600个经度值,每个值被np.repeat() 1800次np.repeat() 。
For each longitude value, we need all latitude values. So, to create the final latitude_values list, we multiply the complete list by 3600, creating a 6,480,000 long list with latitude list repeated over and over again 3600 times.
对于每个经度值,我们需要所有纬度值。 因此,要创建最终的latitude_values列表,我们将整个列表乘以3600,创建一个6,480,000长的列表,并将纬度列表重复3600次。
Finally, to convert the matrix of precipitation values, I used the flatten() function to convert it into a long list.
最后,为了转换降水值矩阵,我使用了flatten()函数将其转换为一个长列表。
longitude_values = np.repeat(list(grid['lon']), 1800)
latitude_values = list(grid['lat'])*3600
precipitation_values = np.array(list(grid['precipitation'])).flatten()dataset = pd.DataFrame({"lon": longitude_values, "lat": latitude_values, "precipitation": precipitation_values})
dataset.columns = [grid['lon'].attrs['standard_name'].decode() + " (" + grid['lon'].attrs['units'].decode() + ")",grid['lat'].attrs['standard_name'].decode() + " (" + grid['lat'].attrs['units'].decode() + ")","Precipitation (" + grid['precipitation'].attrs['units'].decode() + ")",]
dataset.head()
I then saved these lists as columns of the dataset dataframe with labels lon, lat and precipitation. I rename the columns with the labels and the units we extracted above. Note that the strings are saved with a b due to byte encoding, so I append these attributes with decode() to get the string values.
然后,我将这些列表另存为dataset数据框的列,标签为lon , lat和precipitation 。 我使用上面提取的标签和单位对列进行重命名。 请注意,由于字节编码的原因,字符串使用b进行保存,因此我将这些属性附加到decode()以获取字符串值。
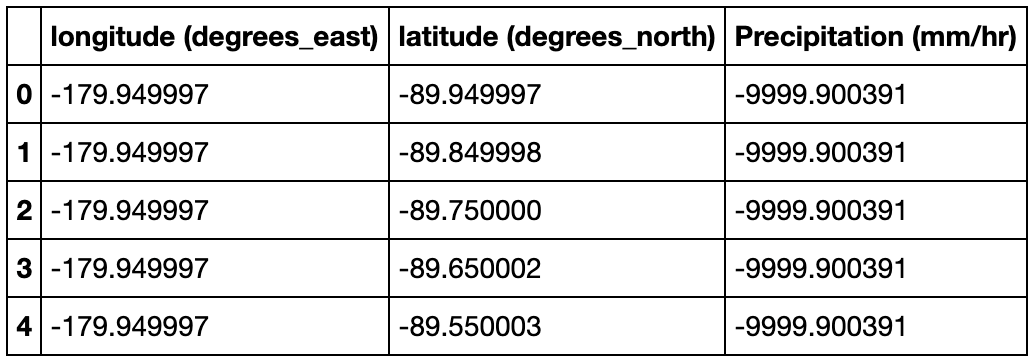
Some precipitation values are not captured or are missing and are denoted by -9999.900391 in the dataset, so I mask them with a value 0.
一些降水量值未捕获或丢失,在数据集中用-9999.900391表示,因此我将其掩码为0 。
dataset['Precipitation (mm/hr)'] = dataset['Precipitation (mm/hr)'].mask(dataset['Precipitation (mm/hr)'] == -9999.900391, 0)As the last step, I saved the dataframe as a CSV file precipitation_jan_2020.csv inside the data folder.
作为最后一步,我保存的数据帧为CSV文件precipitation_jan_2020.csv 数据文件夹内。
dataset.to_csv("data/precipitation_jan_2020.csv", index = False)And that’s it! We have our CSV file.
就是这样! 我们有CSV文件。
结论 (Conclusion)
In this article, I described the steps to load a HDF5 file in Python, read its elements and finally create a dataframe that can be saved as a CSV file. The same steps can be replicated for any other HDF5 file as well.
在本文中,我描述了在Python中加载HDF5文件,读取其元素并最终创建可保存为CSV文件的数据框的步骤。 相同的步骤也可以复制到任何其他HDF5文件。
Hope you liked this article. If you have any questions, suggestions or ideas, please mention them in the comments.
希望您喜欢这篇文章。 如果您有任何问题,建议或想法,请在评论中提及。
翻译自: https://towardsdatascience.com/working-with-hdf5-files-and-creating-csv-files-1a7d212d970f
hdf5文件和csv的区别
http://www.taodudu.cc/news/show-997509.html
相关文章:
- 机器学习常用模型:决策树_fairmodels:让我们与有偏见的机器学习模型作斗争
- 100米队伍,从队伍后到前_我们的队伍
- mongodb数据可视化_使用MongoDB实时可视化开放数据
- Python:在Pandas数据框中查找缺失值
- Tableau Desktop认证:为什么要关心以及如何通过
- js值的拷贝和值的引用_到达P值的底部:直观的解释
- struts实现分页_在TensorFlow中实现点Struts
- 钉钉设置jira机器人_这是当您机器学习JIRA票证时发生的事情
- 小程序点击地图气泡获取气泡_气泡上的气泡
- PopTheBubble —测量媒体偏差的产品创意
- 面向Tableau开发人员的Python简要介绍(第3部分)
- pymc3使用_使用PyMC3了解飞机事故趋势
- 吴恩达神经网络1-2-2_图神经网络进行药物发现-第2部分
- 数据图表可视化_数据可视化十大最有用的图表
- 接facebook广告_Facebook广告分析
- eda可视化_5用于探索性数据分析(EDA)的高级可视化
- css跑道_如何不超出跑道:计划种子的简单方法
- 熊猫数据集_为数据科学拆箱熊猫
- matplotlib可视化_使用Matplotlib改善可视化设计的5个魔术技巧
- 感知器 机器学习_机器学习感知器实现
- 快速排序简便记_建立和测试股票交易策略的快速简便方法
- 美剧迷失_迷失(机器)翻译
- 我如何预测10场英超联赛的确切结果
- 深度学习数据自动编码器_如何学习数据科学编码
- 图深度学习-第1部分
- 项目经济规模的估算方法_估算英国退欧的经济影响
- 机器学习 量子_量子机器学习:神经网络学习
- 爬虫神经网络_股市筛选和分析:在投资中使用网络爬虫,神经网络和回归分析...
- 双城记s001_双城记! (使用数据讲故事)
- rfm模型分析与客户细分_如何使用基于RFM的细分来确定最佳客户
hdf5文件和csv的区别_使用HDF5文件并创建CSV文件相关推荐
- win10文件夹加密_在Windows10中轻松创建隐形文件夹,为数据安全加把锁
对于许多人来说,他们的个人计算机或笔记本电脑通常不是他们个人专用的,往往他们的朋友和家人比他们自己使用的更多.对于他们来说,文件的安全性和隐私往往就无法得到保证,很多内容不想让别人看到,这该怎么办呢? ...
- python统计csv行数_对Python 多线程统计所有csv文件的行数方法详解
如下所示: #统计某文件夹下的所有csv文件的行数(多线程) import threading import csv import os class MyThreadLine(threading.Th ...
- python文件都是脚本吗_脚本语言系列之Python | Python文件IO
Python是做自动化工作首选的一门语言,与更复杂的语言相比,Python 非常便于快速学习.语法很少,具有良好的 可读性,即使测试工程师们没有丰富的编码经验,也能快速学会:Python 的极简风格对 ...
- c盘python27文件夹可以删除嘛_告诉你C盘里的文件夹哪个能删
1 Documents and Settings是什么文件?答案: 是系统用户设置文件夹,包括各个用户的文档.收藏夹.上网浏览信息.配置文件等. 补:这里面的东西不要随便删除,这保存着所有用户的文档和 ...
- createfile调用失败_汇编语言CreateFile函数:创建新文件或者打开已有文件
函数 CreateFile 可以创建一个新文件或者打开一个已有文件.如果调用成功,函数返回打开文件的句柄:否则,返回特殊常数 INVALID_HANDLE_VALUEO 原型如下: CreateFil ...
- linux创建交换分区设置_如何在Linux上创建交换文件
linux创建交换分区设置 zentilia/Shutterstock.com zentilia / Shutterstock.com Add swap space to a Linux comput ...
- 服务器所属文件变成nobody,NFS(expirtfs命令,NFS客户端创建新文件所属组和所属主都为nobody)(示例代码)...
一.exportfs命令 nfs进程不能随便从新启动,如果不得已要重启,必须把客户端的挂载目录卸载,然后在从新启动. 这时候就可以用exportfs命令 -a 全部挂载或者全部 ...
- matlab怎么新建文件运行不了,如何使用MathWorks的MATLAB程序创建脚本文件
描述 步骤1:打开程序 首先,应打开并使用所使用的计算机.在桌面上,单击左下角的Windows按钮(Windows版本Vista,7和8,先前版本的开始按钮),然后搜索程序MATLAB.双击文本&qu ...
- python读取csv某些行_【Python】Python 读取csv的某行或某列数据
站长用Python写了一个可以提取csv任一列的代码,欢迎使用. Github链接 csv是Comma-Separated Values的缩写,是用文本文件形式储存的表格数据,比如如下的表格: 就可以 ...
最新文章
- CYQ.Data 轻量数据层之路 使用篇三曲 MAction 取值赋值(十四)
- 开启Apache mod_rewrite模块(解决404 Not Found)
- NumPy 矩阵库(Matrix)
- linux exchange邮件客户端,Linux中使用Hiri邮件客户端访问Exchange帐户
- 揭秘了!小米透明电视所用处理器为联发科定制
- Intellij IDEA 通过数据库表逆向生成带注释的实体类文件超级详细步骤,附详细解决方案
- Boost C++ 智能指针
- 小甲鱼python官网-小甲鱼零基础入门学习Python
- APM监控--(六)Dapper,大规模分布式系统的跟踪系统
- 遇害的中国留美博士生,被追授博士学位!导师帮他完成了学业!
- 2022全球「高被引科学家」榜单出炉!中国内地1169人入选,继续紧追美国
- 关于计算机的英语单词及例句,小学生必背英语单词及例句(四年级).doc
- PLSQL入门与精通(第72章:LOGOFF触发器)
- 关于ubuntu浏览器模糊不清的解决方法
- IDEA创建Maven工程Servlet
- 大学JavaWeb课程设计——图书管理系统(应付作业及毕设)
- 现代密码学之数字签名
- [os]os vmware 手机连接
- openssl 的 tls 命令和相关使用心得
- 人工智能中的Web端编程