t–sql pl–sql_SQL Server处理器性能指标–第4部分–处理器指标有助于更深入的调查和故障排除
t–sql pl–sql
In the previous part of this series, we presented the processor metrics that indicate hardware component problems that can affect SQL Server performance
In this part, we will present processor metrics that are not necessary in every performance monitoring scenario, but are useful for deeper investigation and troubleshooting
在本系列的前一部分中,我们介绍了处理器指标,这些指标指示可能会影响SQL Server性能的硬件组件问题。
在这一部分中,我们将介绍处理器指标,这些指标并非在每个性能监视方案中都必需,但对于更深入的调查和故障排除很有用。
系统:通话/秒 (System: Calls/sec)
“This counter is a measure of the number of calls made to the system components, Kernel mode services. This is a measure of how busy the system is taking care of applications and services—software stuff. When compared to the Interrupts/Sec it will give you an indication of whether processor issues are hardware or software related” [1]
“此计数器衡量对系统组件(内核模式服务)的调用次数。 这是系统忙于处理应用程序和服务(软件方面)的度量。 与Interrupts / Sec进行比较时,它将指示处理器问题与硬件还是软件有关” [1]
In other words System: Calls/sec metric shows the number of software calls to the operating system service routines per second. As the Processor: Interrupts/Sec shows the number of hardware calls to the processor, these two metrics can determine the source of the performance problems
换句话说,“ 系统:呼叫/秒”度量标准显示每秒对操作系统服务例程的软件调用次数。 当处理器:中断/秒显示了对处理器的硬件调用次数时,这两个指标可以确定性能问题的根源
The normal values for System: Calls/sec are under 20,000. Higher values might indicate excessive operating system activity caused by software applications. In this case, check the Context Switches/sec value (explained later) to identify the process responsible for excessive software calls
系统:呼叫/秒的正常值在20,000以下。 较高的值可能表示由软件应用程序引起的过多的操作系统活动。 在这种情况下,请检查“ 上下文切换数/秒”值(稍后说明),以确定造成过多软件调用的进程
It’s expected that the System: Calls/sec values are higher than Processor: Interrupts/sec. However, if the latter is higher, it’s a clear indication of a hardware problem
预期System:Calls / sec值高于Processor:Interrupts / sec 。 但是,如果后者更高,则表明存在硬件问题
线程对象:优先级基础 (Thread Object: Priority Base)
“The thread gets a base priority from the Process that created it. The priority of the thread can be adjusted by the system or through a program. This priority is used to judge when the thread is going to have access to the process and how many other threads it may jump ahead of in the processor queue of ready threads.” [1]
“线程从创建它的进程中获得基本优先级。 线程的优先级可以由系统或程序调整。 该优先级用于判断线程何时将有权访问该进程,以及它在就绪线程的处理器队列中可能会提前多少个其他线程。” [1]
The idle thread has the lowest priority among all processor threads. Useful processor threads can have the following priority classes: low, below normal, normal, above normal, high, and real time
空闲线程在所有处理器线程中的优先级最低。 有用的处理器线程可以具有以下优先级类别:低,低于正常,正常,高于正常,高和实时
Monitoring the Thread Object: Priority Base metric will help you determine whether there are threads with higher priority than optimal. We have already recommended using a dedicated machine for SQL Server. Having additional applications, especially resource-intensive ones, can use resources needed by SQL Server and degrade its performance. Assigning these processes higher priority than normal will affect execution and performance of other threads and processes, and even block them. SQL Server will have to wait for the processor to handle other applications first and its performance will suffer
监视线程对象:“优先级基础”度量标准将帮助您确定是否存在优先级比最佳优先级高的线程。 我们已经建议对SQL Server使用专用计算机。 拥有其他应用程序,尤其是资源密集型应用程序,可能会使用SQL Server所需的资源并降低其性能。 为这些进程分配比正常更高的优先级将影响其他线程和进程的执行和性能,甚至会阻止它们。 SQL Server将不得不等待处理器首先处理其他应用程序,并且其性能将受到影响
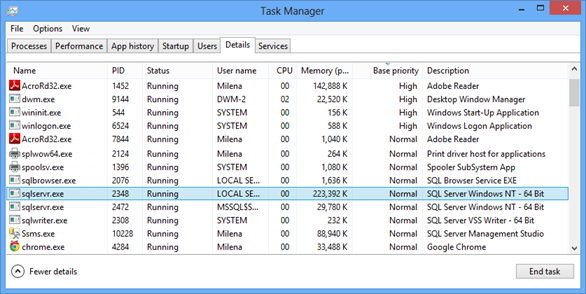
To see the base priority of the thread, you can use the Windows Task Manager
若要查看线程的基本优先级,可以使用Windows任务管理器
- Open Windows Task Manager (press Ctrl+ Alt + Delete)打开Windows任务管理器(按Ctrl + Alt +删除)
- Details tab详细信息选项卡
- Show columns显示列”
- Base priority. Now the Base priority column is shown in the grid, so you can order the records descending by their priority基本优先级 。 现在,“基本优先级”列显示在网格中,因此您可以按其优先级对记录进行排序
To change the thread priority:
更改线程优先级:
- Right-click a process右键单击一个进程
- Select Set priority and select one of the options offered选择设置优先级,然后选择提供的选项之一
All processes have the normal priority by default, except some system processes
默认情况下,除某些系统进程外,所有进程均具有正常优先级
Now, check the priority of the SQL Server process – sqlservr.exe. By default, it should be normal. If there are some non-system and non-essential applications, processes, or services running with priority higher than normal, they can jeopardize the performance of your SQL Server. If there are no obvious or logical reasons for this, reduce their priority to normal and allow SQL Server to use as much processor time it can get
现在,检查SQL Server进程的优先级– sqlservr.exe。 默认情况下,它应该是正常的。 如果有一些非系统和非必要的应用程序,进程或服务运行的优先级高于正常水平,则它们可能会损害SQL Server的性能。 如果没有明显或逻辑上的原因,则将其优先级降低至正常水平,并允许SQL Server使用可以获得的尽可能多的处理器时间。
The same metric, but in different presentation is shown in Windows Performance Monitor
Windows Performance Monitor中显示相同的度量标准,但表示形式不同
- Windows Performance Monitor – open Windows Performance Monitor –打开“ Control Panel, Administrative Tools, Performance Monitor控制面板”,“管理工具”,“ Performance Monitor”
- Performance Monitor性能监视器”
- Right-click the graph on the right右键单击右侧的图
- Add counters添加计数器
- Thread and then 线程” ,然后选择“ Priority Base优先级基础”
- In the lower list, select the processes you want to monitor在下方列表中,选择要监视的进程
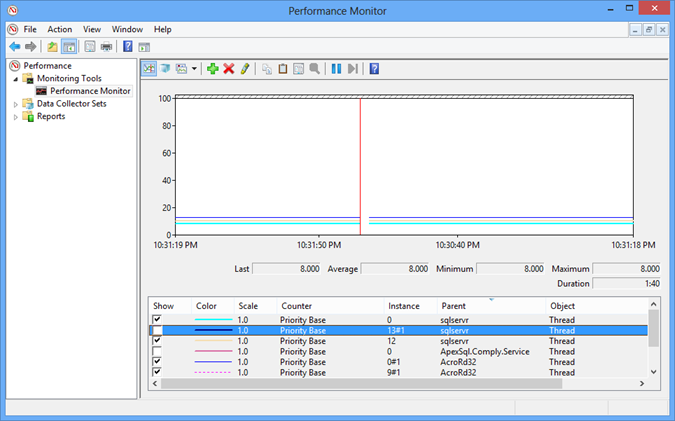
The values shown in the Performance Monitor graph are not descriptive like in Windows Task Manager, but numerical:
性能监视器图中显示的值不是Windows Task Manager中的描述性值,而是数字:
| Numerical value | Priority |
| 4 | Low |
| 6 | Below normal |
| 8 | Normal |
| 10 | Above normal |
| 13 | High |
| 24 | Real time |
| 数值 | 优先 |
| 4 | 低 |
| 6 | 低于一般 |
| 8 | 正常 |
| 10 | 超出正常水平 |
| 13 | 高 |
| 24 | 即时的 |
上下文切换/秒 (Context Switches/sec)
The Context Switches/sec metric is used to obtain more in-depth information about processor issues
上下文切换/秒度量标准用于获取有关处理器问题的更深入的信息
“A context switch occurs when the kernel switches the processor from one thread to another—for example, when a thread with a higher priority than the running thread becomes ready.” [2]
“上下文切换是在内核将处理器从一个线程切换到另一个线程时发生的,例如,当优先级高于运行线程的线程准备就绪时。” [2]
A thread can be replaced by a thread of a higher-priority, or a thread executed in the user mode can be replaced by a kernel mode thread
可以用更高优先级的线程替换线程,或者可以用内核模式线程替换在用户模式下执行的线程
It’s important to monitor context switching as it can indicate performance issues. If a specific process is using the processor more than others, not allowing other processes to be processed, the rate of context switching will be low. A high rate of context switching indicates that many processes are using and competing for the processor time, and it is switching from one thread to another frequently. Too frequent switching, the same as too rare, indicates problems
监视上下文切换非常重要,因为它可以指示性能问题。 如果特定进程比其他进程更多地使用处理器,而不允许处理其他进程,则上下文切换的速率将很低。 高上下文切换率表明许多进程正在使用并争夺处理器时间,并且它正在频繁地从一个线程切换到另一个线程。 切换太频繁(与切换太少一样)表明存在问题
The Context Switches/sec counter shows a rate at which the processor switches from one thread to another. This is a total rate for all processors on the machine, i. e. the sum of the Thread:Context Switches/sec metric for all threads on all processors on the machine
上下文切换/秒计数器显示处理器从一个线程切换到另一个线程的速率。 这是计算机上所有处理器的总费率,即计算机上所有处理器上所有线程的Thread:Context Switches / sec指标之和
The average Context Switches/sec value should be below 2,000 per processor. Some DBAs consider this limit to be 5,000 per processor. Higher values can be caused by excessive page faults caused by insufficient memory. Also, if hyper-threading is turned on, turn it off and test the performance. It can significantly reduce the threading and solve performance problems
每个处理器的平均上下文切换/秒值应低于2,000。 一些DBA认为此限制为每个处理器5,000。 较高的值可能是由内存不足导致的过多页面错误引起的。 另外,如果打开了超线程,请将其关闭并测试性能。 它可以大大减少线程并解决性能问题
High Context Switches/sec values are more frequent on the machines that besides the database system host other resource-intensive applications. They can also occur on a system with several SQL Server instances
除了数据库系统托管其他资源密集型应用程序之外,计算机上的高上下文切换/秒值更加频繁。 它们也可能在具有多个SQL Server实例的系统上发生
Constantly high values of Context Switches/sec and Processor: % Processor Time are a clear indication of processor bottlenecks. The ultimate solution is changing the processor to a more powerful one, or adding an additional one
上下文切换/秒和处理器:处理器时间百分比的值始终很高,这清楚地表明了处理器瓶颈。 最终的解决方案是将处理器更改为功能更强大的处理器,或添加一个附加的处理器。
线程对象:ID线程 (Thread Object: ID Thread)
Every thread running on the operating system is uniquely identified by its ID. If the same thread is executed again, it will be assigned a new ID
操作系统上运行的每个线程均由其ID唯一标识。 如果再次执行同一线程,则会为其分配一个新的ID
The Thread Object: ID Thread metric shows an ID of the process thread, necessary to differentiate a specific thread among others. This metric is useful if you’re monitoring other metrics that provide details based on the thread ID
线程对象:ID线程度量标准显示进程线程的ID,这是区分特定线程所必需的。 如果您要监视其他基于线程ID提供详细信息的度量,则此度量很有用
流程:流程ID (Process: Process ID)
Every process running on the operating system is uniquely identified by its ID. If the same process is executed again, it will be assigned a new ID
操作系统上运行的每个进程均由其ID唯一标识。 如果再次执行相同的过程,则会为其分配新的ID
The same as Thread Object: ID Thread, the Process: Process ID metric is usually used for determining the right process when process details are based on the Process ID
当进程详细信息基于进程ID时,通常与“ 线程对象:ID线程 ”相同,使用“ 进程:进程ID”度量标准来确定正确的进程。
The performance of SQL Server can be affected by other applications or by other SQL Server instances hosted on the same machine. Monitor the System: Calls/sec value to identify resource-intensive applications, check Thread Object: Priority Base to find out if any application has been given higher priority and thus eating processor time needed by SQL Server, watch Context Switches/sec to see whether all applications can get the processor time they need
SQL Server的性能可能会受到其他应用程序或同一台计算机上承载的其他SQL Server实例的影响。 监视系统:调用/秒值以识别资源密集型应用程序,检查线程对象:优先级基础以发现是否有任何应用程序被赋予更高的优先级,从而吃掉SQL Server所需的处理器时间,观看上下文切换/秒以查看是否所有应用程序都能获得所需的处理器时间
翻译自: https://www.sqlshack.com/sql-server-processor-performance-metrics-part-4-processor-metrics-useful-deeper-investigation-troubleshooting/
t–sql pl–sql
t–sql pl–sql_SQL Server处理器性能指标–第4部分–处理器指标有助于更深入的调查和故障排除相关推荐
- t–sql pl–sql_SQL Server处理器性能指标–第1部分–最重要的CPU指标
t–sql pl–sql Starting with this article, we will present the most important CPU metrics, describe th ...
- t–sql pl–sql_SQL Server处理器性能指标–第3部分–指示硬件组件问题的指标
t–sql pl–sql Part 1 and 第1部分和Part 2 of the SQL Server processor performance metrics series, we descr ...
- t–sql pl–sql_SQL Server性能疑难解答的DBA指南–第1部分–问题和性能指标
t–sql pl–sql It doesn't mean that every SQL Server slowdown is a performance problem. Some specific ...
- t–sql pl–sql_SQL Server性能疑难解答的DBA指南–第2部分–监视实用程序
t–sql pl–sql SQL Server探查器 (SQL Server Profiler ) SQL Server Profiler is a monitoring tool that you ...
- t–sql pl–sql_SQL Server –在T-SQL中使用最低的度量单位
t–sql pl–sql A client recently discovered a discrepancy on one of our reports that showed an improve ...
- c统计多线程总时间_SQL Server处理器性能指标–第2部分–处理器:%用户时间,处理器:%特权时间,总时间和线程指标
c统计多线程总时间 In SQL server processor performance metrics – Part 1 – The most important cpu metrics, we ...
- t–sql pl–sql_SQL View –完整的介绍和演练
t–sql pl–sql In relational databases, data is structured using various database objects like tables, ...
- t–sql pl–sql_SQL串联正确完成–第1部分–可疑做法
t–sql pl–sql This article is a part of three articles series to explore SQL Concatenation techniques ...
- t–sql pl–sql_SQL日期时间–您应该知道的15个重要功能!
t–sql pl–sql Hey, folks! Hope you all are doing well. Today, in this article, we will be highlightin ...
最新文章
- 魔改Attention大集合
- 使用IntelliJ IDEA 15和Maven创建Java Web项目
- Lamport Logical Clock 学习
- 基于Nexys4 DDR的温度数码管实时显示
- DreamweaverCS4搭建配置php本地站点(图文教程)- 教程篇
- Java虚拟机(十二)——StringTable
- MySQL学习记录 (四) ----- SQL数据管理语句(DML)
- day2-python工具的选择使用
- 【BootStrap笔记】BootStrap+css写旅游网页面
- php验证手机号码 函数,PHP 匹配电话,手机,400号码 函数 及正则。很管用。
- cad2004教程_CAD插件自动编号软件安装包+安装教程
- SAS笔记#通过TABULATE过程制作汇总报表
- 启发式算法 Heuristic Algorithm
- 数字调制解调技术:第7章-COSATAS环载波频率参数设计问题
- vivox21支持html,vivo X21支持快充吗_vivo X21支持无线充电吗-太平洋IT百科
- 数据库范式5nf_第五范式(5NF)| 数据库管理系统
- 年后第一天上班就提辞职是不是“不厚道”???
- 爬虫——解析图书排行榜图书信息
- (转载)【笨木头Lua专栏】基础补充02:函数的几个特别之处
- Problems Series 1
热门文章
- python入门教材论坛_GitHub - aisuhua/codeparkshare: Python初学者(零基础学习Python、Python入门)书籍、视频、资料、社区推荐...
- rss spring 接口_spring mvc: rss(xml)输出
- opencv 人脸识别_python基于openCV人脸识别18行代码实现
- idea重写接口没有@override_接口和抽象有什么区别?
- HTTPS协议详解:TLS/SSL握手过程
- 这是一篇很好的文章,学verilog的可以好好看看
- 简单scrapy爬虫实例
- jQuery--基本选择器
- 二数 (埃森哲杯第十六届上海大学程序设计联赛春季赛暨上海高校金马五校赛)...
- C语言异常处理之 setjmp()和longjmp()