客户细分模型_Avarto金融解决方案的客户细分和监督学习模型
客户细分模型
Lets assume that you are a CEO of a company which have some X amount of customers in a city with 1000 *X population. Analyzing the trends/features of your customer and segmenting the population of the city to land new potential customers would be a very important step for any company.
假设您是一家公司的CEO,该公司在人口为1000 * X的城市中有大约X个客户。 对于任何公司来说,分析客户的趋势/特征并划分城市人口以吸引新的潜在客户都是非常重要的一步。
This is very interesting work for an aspiring Data Scientist like me who would love to work with such real world datasets. The following article is a similar work on data provide by Avarto Financial Solutions for Udacity Nano-Degree Capstone Project.
对于像我这样有抱负的数据科学家来说,这是一件非常有趣的工作,他们愿意使用这样的现实世界数据集。 以下文章是Avarto Financial Solutions为Udacity Nano-Degree Capstone项目提供的数据的类似工作。
This project can we divided into three parts:
这个项目我们可以分为三个部分:
Customer Segmentation using unsupervised techniques
使用无监督技术进行客户细分
Supervised Learning Model
监督学习模型
Kaggle Competition
Kaggle比赛
Data Overview:
数据概述:
The following the files which are given by Avarto Financial Services:
Avarto Financial Services提供的以下文件:
- Azdias.csv : Demographics data for the general population of Germany 891,211 persons (rows) x 366 features (columns)Azdias.csv:德国总人口的人口统计数据891,211人(行)x 366个特征(列)
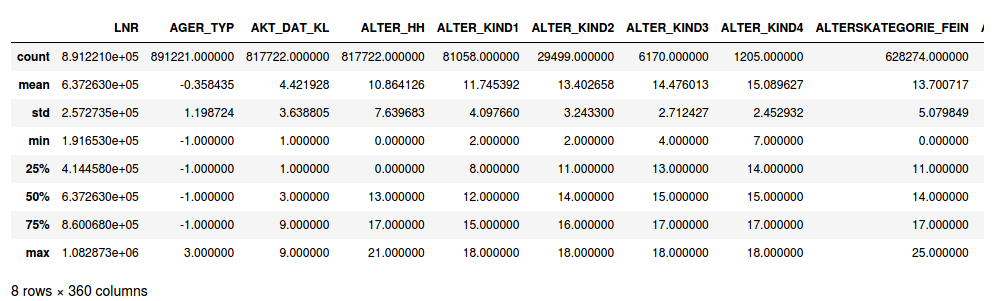
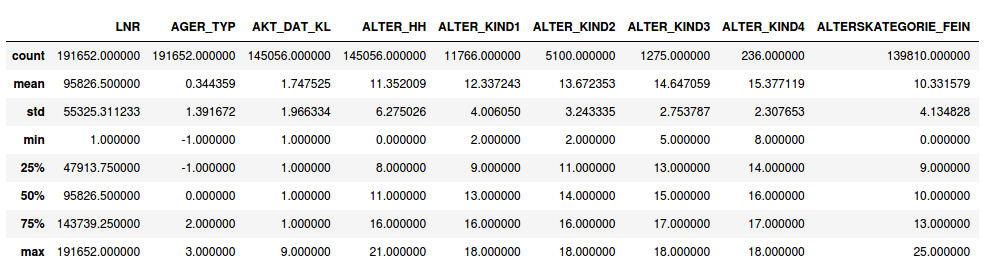
2. Customers.csv: Demographics data for customers in a mail-order company 191652 persons (rows) x 369 features (columns)
2. Customers.csv:邮购公司中客户的人口统计数据191652人(行)x 369个特征(列)
3. Train.csv: Demographics data for individuals who were targets of a marketing campaign (train) — 42,982 persons (rows) x 367 (columns)
3. Train.csv:作为营销活动目标的个人的人口统计数据(火车)-42,982人(行)x 367(列)
4. Test.csv: Demographics data for individuals who were targets of a marketing campaign (test) — 42,833 persons (rows) x 366 (columns)
4. Test.csv:作为营销活动目标的个人的人口统计数据(测试)-42,833人(行)x 366(列)
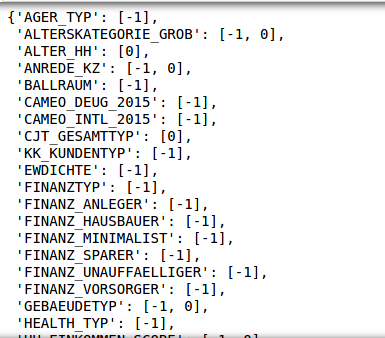
An excel for describing all the features and the explanations of each of their values was given in a seperate file. This excel was read and a dictionary was made out it for mapping all these values to NaNs.
在单独的文件中提供了一个用于描述所有功能以及每个值的解释的excel。 读取了此excel,并制作了字典以将所有这些值映射到NaN。
Pre-processing Data:
预处理数据:
Initially, the number of NaNs in the Azdias dataset were less. After mapping, the unknown values of each column increased. The following figures shows the top 15 columns which had maximum number of null values after mapping of the unknown values.
最初,Azdias数据集中的NaN数量较少。 映射后,每列的未知值增加。 下图显示了映射未知值后具有最大空值数量的前15列。
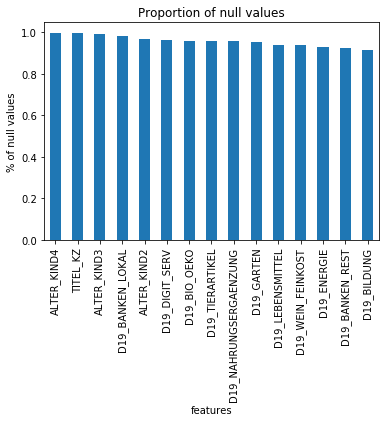
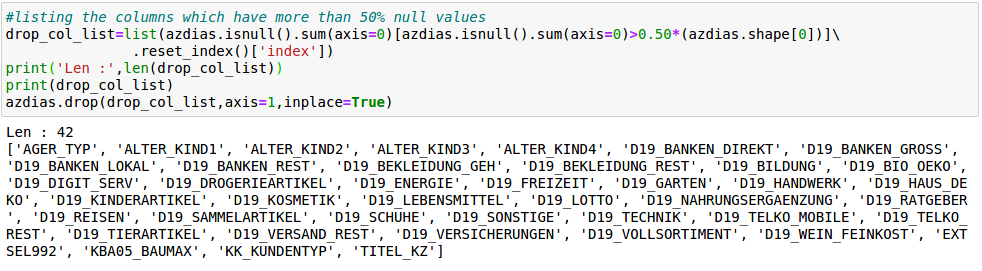
On checking the proportion of null values, there were 42 columns which had more than 50% of their values as NaNs. These columns were subsequently dropped from the dataset. One thing to note here is to store these column names which can be applied later to the customers dataset.
在检查空值的比例时,有42列的NaN占其值的50%以上。 这些列随后从数据集中删除。 这里要注意的一件事是存储这些列名,这些列名以后可以应用于客户数据集。
There 6 features which were categorical in nature. Features such as ‘EINGEFUEGT_AM’ , ’D19_LETZTER_KAUF_BRANCHE’ were dropped because these were too detailed. Dummies were created for column ‘CAMEO_DEU_2015’ for all its individual values.
本质上有6个特征是分类的。 删除了诸如“ EINGEFUEGT_AM”,“ D19_LETZTER_KAUF_BRANCHE”之类的功能,因为这些功能过于详细。 为“ CAMEO_DEU_2015”列创建了所有虚拟值的虚拟变量。
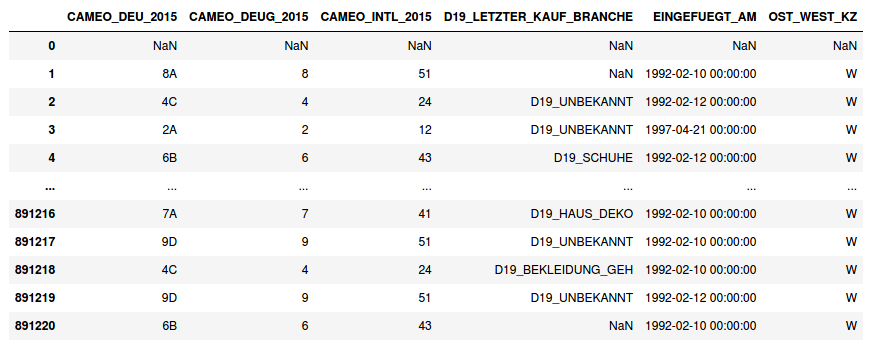
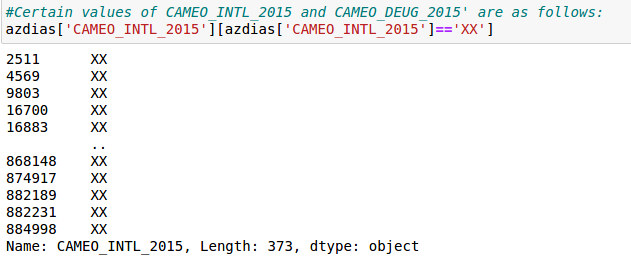
The columns ‘CAMEO_INTL_2015’ and ‘CAMEO_DEUG_2015’ had arbitrary values such as ‘XX’ and ‘X’ which needed to be replaced by NaN. These values also present in ‘CAMEO_DEU_2015’ feature and was subsequently dropped after creating dummies.
列“ CAMEO_INTL_2015”和“ CAMEO_DEUG_2015”具有任意值,例如“ XX”和“ X”,需要用NaN替换。 这些值也出现在“ CAMEO_DEU_2015”功能中,并在创建虚拟变量后被删除。
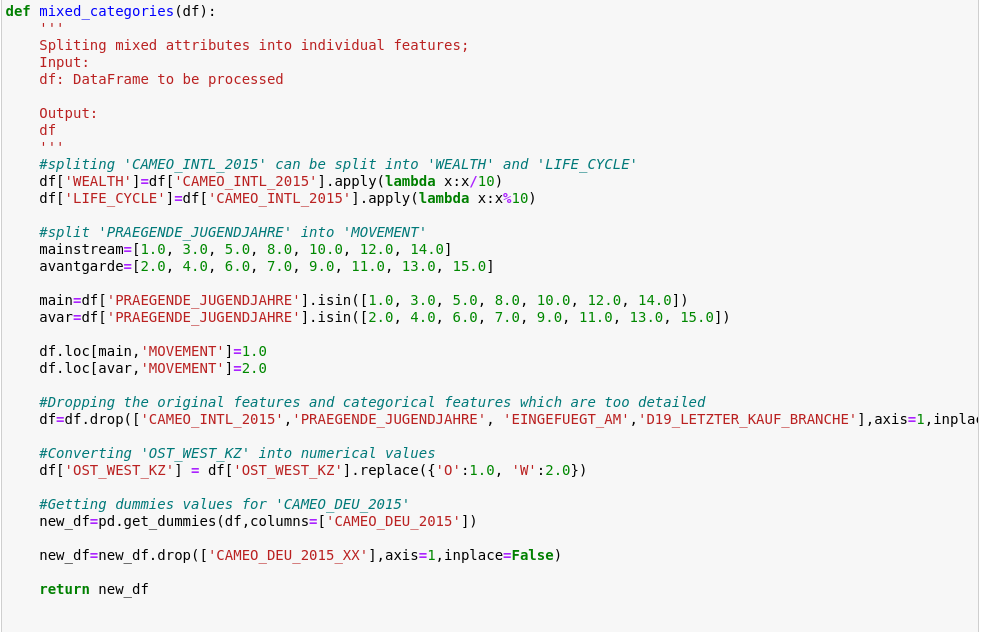
Pre-processing on three particular columns involved manipulation of data.
在三个特定列上的预处理涉及数据处理。
- ‘CAMEO_INTL_2015’ : column for international topology. This column had two internal features such as ‘WEALTH’ and ‘LIFE_CYCLE’ combined in the dataset. Thus, two independent columns were generated from this column.'CAMEO_INTL_2015':国际拓扑列。 该列在数据集中具有两个内部功能,例如“ WEALTH”和“ LIFE_CYCLE”。 因此,从该列中生成了两个独立的列。
- ‘PRAEGENDE_JUGENDJAHRE’: column for dominating movement in the person’s youth (avantgarde or mainstream). This column was dropped and another column named ‘MOVEMENT’ was generated from this column with two values. {1:mainstream,2:avantgarde}'PRAEGENDE_JUGENDJAHRE':专栏,用于支配青年(前卫或主流)青年的运动。 删除该列,并从该列中生成另一个名为“ MOVEMENT”的列,其中包含两个值。 {1:主流,2:前卫}
- The ‘OST_WEST_KZ’ is converted into integer values by mapping ‘o’ to 1 and ‘w’ to 2.通过将'o'映射为1并将'w'映射为2,将'OST_WEST_KZ'转换为整数值。
Using the sklearn library, the SimpleImputer and StandardScaler for every column was used. Similar, process of pre-processing, imputation and standardization was applied to the customers data as well.
使用sklearn库,每列都使用SimpleImputer和StandardScaler。 同样,预处理,插补和标准化过程也应用于客户数据。
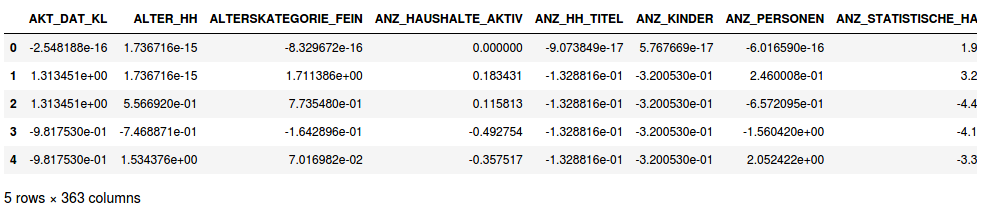
Before jumping into the 1st part of the project, the number of features were reduced to 363 columns. All the columns represented float values and the data was ready to be utilize further for the customer segmentation.
在进入项目的第一部分之前,要素数量已减少到363列。 所有列均表示浮点值,数据已准备好进一步用于客户细分。
Part 1: Customer Segment
第1部分:客户群
Principal Component Analysis:
主成分分析:
It is not feasible to work with 363 features. Each feature would represent some amount of variance. Thus, PCA was applied to reduce the dimensionality of the data. After applying PCA for many different n_components, I decided to finalize 181 features which is exactly the half number of features of clean data.
使用363个功能不可行。 每个特征将代表一定数量的方差。 因此,应用PCA来减少数据的维数。 在将PCA应用于许多不同的n_components之后,我决定完成181个特征,这些特征恰好是干净数据特征的一半。
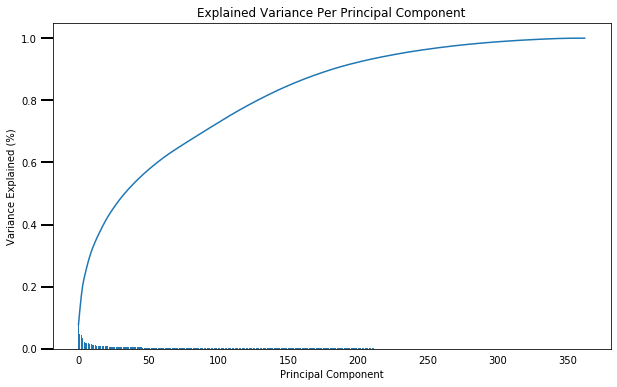
As it can be seen, 181 features roughly can give 90% of the information of the entire data. The principal components were studied in detail regarding the features which were most important.
可以看出,大约181个要素可以提供全部数据的90%的信息。 对主要组成部分进行了详细的最重要的功能研究。
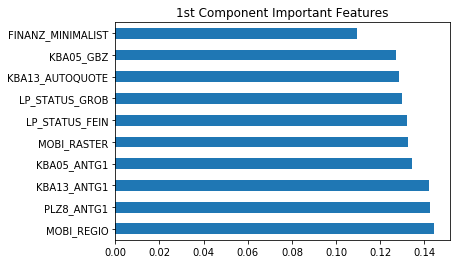
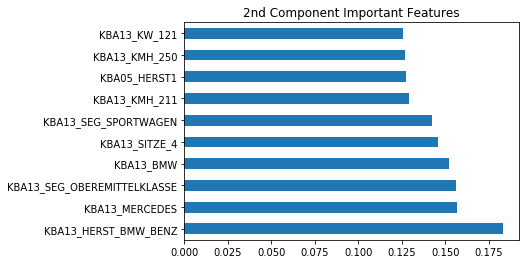
Following figures can give a rough estimation about the feature importance for the first three principal components.
下图可以粗略地估计出前三个主要组件的功能重要性。

For cluster segmentation, initially the Elbow method was implemented to identify the ideal number of clusters for k-means clustering. The sum of squared errors was calculated for each number of cluster using the MiniBatchKmeans.
对于聚类分割,最初采用Elbow方法来确定k均值聚类的理想聚类数。 使用MiniBatchKmeans为每个簇数计算平方误差总和。
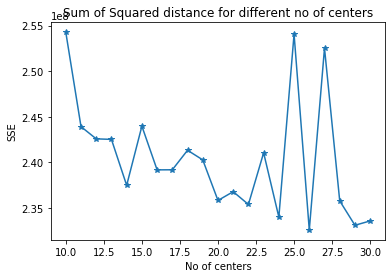
Using the same pipeline, the customers data set was transformed. The number of clusters used was 30. Although, number of clusters=26 would also suffice the needs. The Kmeans algorithm with number of clusters as 30 was used to fit_predict the PCA fitted azdias data. The same model was used to transform the PCA transformed customers data. The below plot shows the similarity of both the datasets for the 30 clusters.
使用相同的管道,转换了客户数据集。 使用的群集数为30。尽管,群集数= 26也可以满足需求。 使用簇数为30的Kmeans算法来fit_预测PCA拟合的azdias数据。 使用相同的模型来转换PCA转换的客户数据。 下图显示了30个聚类的两个数据集的相似性。
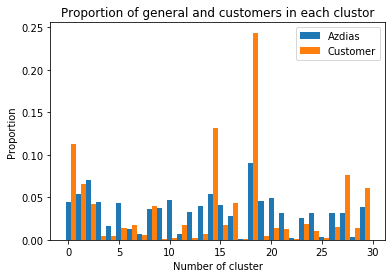
From the above figure, it would be ideal to plot the differences between the proportion of customers and azdias. This difference in proportion would be useful to predict the group of general population which can be considered as potential future customers.
根据上图,绘制客户和azdias比例之间的差异是理想的。 这种比例上的差异将有助于预测可被视为潜在未来客户的普通人群。
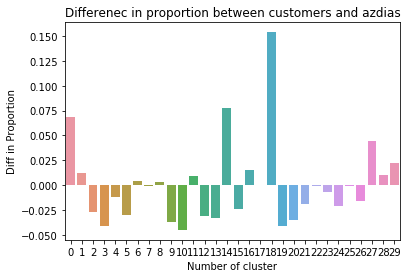
It can be clearly found out that, general audience in the clusters of #18, #14, and #0 would be an ideal choice or have a potential to become future customers. The azdias data points of people in groups #10,#9,#19, and #3 would be considered as non target audience for the mail order company.
可以清楚地发现,在#18,#14和#0集群中的一般受众将是理想的选择,或者具有成为未来客户的潜力。 #10,#9,#19和#3组中人员的azdias数据点将被视为邮购公司的非目标受众。
Part 2: Supervised Learning Model
第2部分:监督学习模型
In order to predict whether a person would be a target or non_target for the mail_order company, it would be ideal to model a supervised model. The training data provides the demographic data for such individuals which can be classified as target and non target. The labels for these data points are given to train the supervised model.
为了预测某个人是邮购公司的目标还是非目标,对受监管模型进行建模是理想的。 训练数据为此类个人提供了人口统计数据,可以将其分类为目标和非目标。 这些数据点的标签用于训练监督模型。
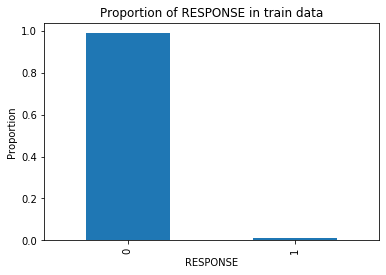
Taking a look at the responses, it can be found that the training data is imbalanced in terms its responses.Only 12% of the total responses are 1 (i.e. targets) while others are non-targets. Thus, the data is subjected to predicting non targets more often the targets.
看一下响应,可以发现训练数据的响应是不平衡的。总响应中只有12%是1(即目标),而其他不是目标。 因此,更经常地对数据进行非目标预测。
In order to tackle this problem, two steps were taken.
为了解决这个问题,采取了两个步骤。
- Using the Stratified Cross Fold Validation : This type of cross validation technique was used because Stratified Kfold maintains the proportion of each class in every fold. In other words, for two fold Stratified cross fold validation, each fold would get 0.06% of target data points and 0.44% of non target data points.使用分层交叉折叠验证:之所以使用这种类型的交叉验证技术,是因为分层Kfold保持每个折叠中每个类别的比例。 换句话说,对于两次分层交叉折叠验证,每一次折叠将获得0.06%的目标数据点和0.44%的非目标数据点。
Using advanced bagging/boosting techniques: Ensemble learning is method of building a model on top of other models. Adaboost Regressor, Gradient Boosting Regressor, and XGBoost Regressor in Scikit-learn are all ensemble classifiers built on top of Decision tree model (by default).
使用高级装袋/增强技术:集成学习是在其他模型之上构建模型的方法。 Scikit-learn中的Adaboost Regressor,Gradient Boosting Regressor和XGBoost Regressor都是基于决策树模型(默认情况下)构建的集成分类器。
These ensemble models work great both for classification and for regression problems and in general has the following benefits:
这些集成模型对于分类和回归问题均适用,并且通常具有以下优点:
- improves the stability and accuracy of machine learning algorithms;提高机器学习算法的稳定性和准确性;
- reduces variance of a single estimate from one model as they combine several estimates from several models;减少来自一个模型的单个估计的方差,因为它们组合了来自多个模型的多个估计;
- helps to avoid overfitting.有助于避免过度拟合。
The models are initially fitted on the training data which was splitted into training and validation data using the Stratified K-fold technique with n_fold=7.
首先将模型拟合到训练数据上,然后使用n_fold = 7的分层K折技术将其分为训练和验证数据。
Model Evaluation:
模型评估:
ROC_AUC was selected to be the metric. To evaluate the models, the training data was split into training and validation data with test_size=0.3. Then, the training data was split into percentages from 30 to 100 of the training size and the corresponding roc_auc for training and validation were plotted.
选择ROC_AUC作为度量标准。 为了评估模型,将训练数据分为test_size = 0.3的训练和验证数据。 然后,将训练数据分成训练大小的30%到100%的百分比,并绘制相应的roc_auc进行训练和验证。
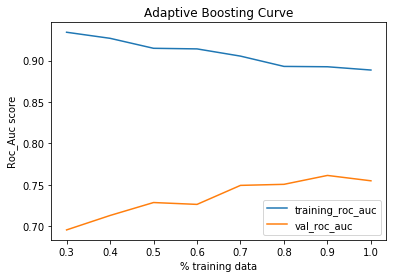
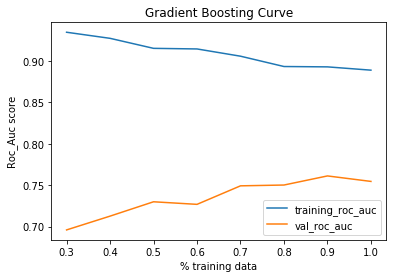
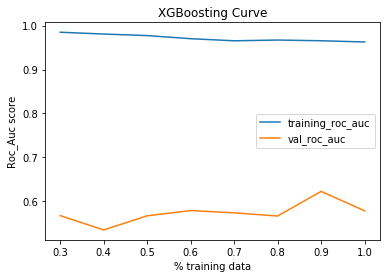
As it can be seen that, the XGBoost Regressor does not perform well with the max val roc_auc of 0.65. The remaining models have similar roc_auc. These models were further fined tuned by hyper-paramater tuning using grid search.
可以看出,在最大val roc_auc为0.65的情况下,XGBoost回归器的性能不佳。 其余模型具有类似的roc_auc。 通过使用网格搜索的超参数调整对这些模型进行了进一步的调整。
Grid Search
网格搜索
The Adaptive Boosting was further fined tuned by tweaking learning_rate and n_estimators. It was found that smaller learning rates and larger n_estimators were giving the best results. Gradient Boosting Regression was also fined similarly and was able to interpret similar trends. However, it takes longer time to run this model. Although, XG Boosting (Extreme Boosting) was not performing well enough, it was fined tuned further by tweaking learning rate and gamma.
通过调整learning_rate和n_estimators进一步调整了自适应提升。 结果发现,较小的学习率和较大的n_estimator给出最佳结果。 梯度提升回归也被类似地罚款,并且能够解释类似的趋势。 但是,运行此模型需要更长的时间。 尽管XG Boosting(Extreme Boosting)的性能不够好,但通过调整学习率和伽玛系数进一步对其进行了微调。
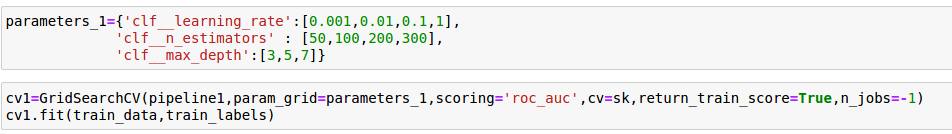
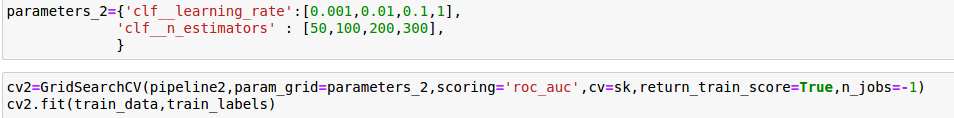

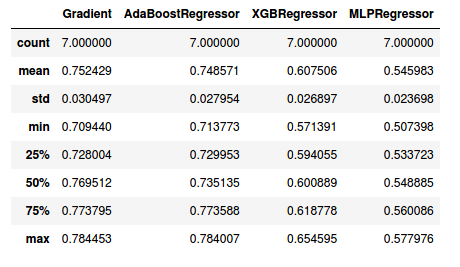
The final models after the grid search and fine tuning the hyper parameters are as follows:
在网格搜索和微调超参数之后的最终模型如下:

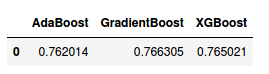
All the three models were able to get 76% accuracy on the training data.
这三个模型在训练数据上都能获得76%的准确性。
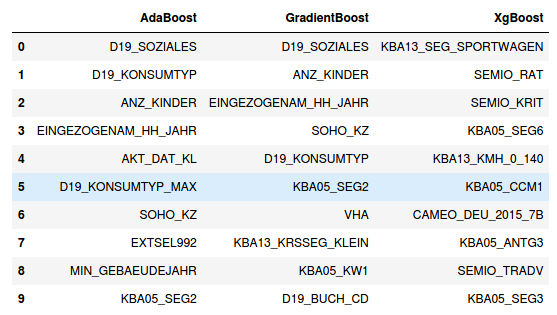
These models were traced back to figure out which feature stands as the most important out of the 363 clean features. It is found out that, the feature ‘D19_SOZIALES’ is the most important feature for two out the three models.
追溯这些模型以找出363个清洁功能中最重要的功能。 结果发现,对于三个模型中的两个,特征“ D19_SOZIALES”是最重要的特征。
Part 3: Kaggle Competition
第3部分:Kaggle比赛
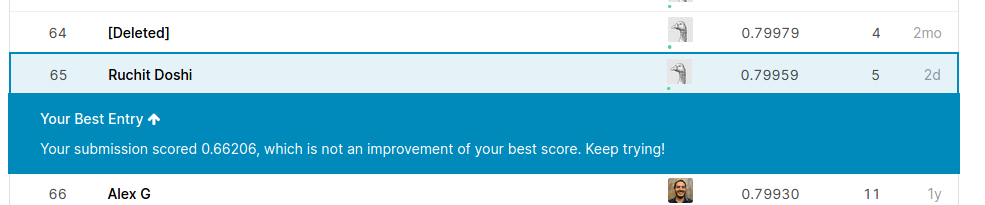
The cleaning data process was applied to the test data as well. The training data was fit on all the three models and predictions on test data for each model was submitted to Kaggle. As we were allowed to submit 5 submissions per, all the three predictions were submitted. The Gradient Boosting submission was the best, getting an accuracy of 79.959 on Kaggle.
清洁数据处理也适用于测试数据。 训练数据适合所有三个模型,并且每个模型的测试数据预测已提交给Kaggle。 由于我们每个人可以提交5份意见书,因此所有三个预测均已提交。 梯度增强提交是最好的,在Kaggle上获得了79.959的准确性。
In order to improve the accuracy, one can refine all the parameters of the models. Other models such as DecisionTreeRegressor can also be tried. One advice would be to try data augmentation technique. Try adding customer dataset points to the training data to handle the imbalance nature.
为了提高精度,可以对模型的所有参数进行细化。 也可以尝试使用其他模型,例如DecisionTreeRegressor。 一种建议是尝试使用数据增强技术。 尝试将客户数据集点添加到训练数据中以处理不平衡性。
Improvements:
改进之处:
- Different cut off for dropping the columns in the datasets can be used. Eg 0.30 null values.可以使用不同的截距来删除数据集中的列。 例如0.30空值。
- Different Imputation techniques can be used like Median, Max etc. The features can also be divided into log attributes which are skewed, into mixed attributes and numerical attributes.可以使用不同的插补技术,例如中位数,最大值等。特征还可以分为偏斜的对数属性,混合属性和数值属性。
- Standardization can also changed like MinMaxScaler etc.标准化也可以更改,例如MinMaxScaler等。
- Different Models like SVR, DecisionTreeClassifier can be test可以测试SVR,DecisionTreeClassifier等不同模型
- Data Augmentation technique can be implemented to handle the imbalance nature of the dataset. Data points from customers data can be added to the training data to increase the positive responses in the training data.可以实施数据增强技术来处理数据集的不平衡性质。 来自客户数据的数据点可以添加到培训数据中,以增加培训数据中的积极响应。
Summary:
摘要:
In this project, provided by Udacity partners at Bertelsmann Arvato Analytics, the real-life demographics data of Germany population and customer segment was analyzed.
在这个由Bertelsmann Arvato Analytics的Udacity合作伙伴提供的项目中,分析了德国人口和客户群的真实人口统计数据。
- In the first part of the project, pre-processing of the data was done. This was the most challenging part of the project. Conversion of mixed attributes and categorical features into numerical attributes consumes most time in this project. Following the data cleaning part was the imputation and standardization of the dataset.在项目的第一部分,对数据进行了预处理。 这是该项目最具挑战性的部分。 在此项目中,将混合属性和分类特征转换为数字属性会花费大量时间。 数据清理部分之后是数据集的插补和标准化。
- For the Unsupervised learning part, PCA was applied to the cleaned dataset containing 363 features. The number of features were reduced to 181 after applying PCA which represents approx 90% of the data. Elbow method was used to determine the number of clusters in the kmeans algorithm. After applying Kmeans to both the datasets, it can be seen that the general population in cluster number #18, #14, and #0 would be an ideal choice or have a potential to become future customers. The azdias data points of people in groups #10,#9,#19, and #3 would be considered as non target audience for the mail order company.对于无监督学习部分,将PCA应用于包含363个特征的清理数据集。 应用PCA后,特征数量减少到181,这代表了大约90%的数据。 kmeans算法中使用肘方法确定聚类数。 将Kmeans应用于这两个数据集后,可以看出群集编号18、14和0的总体人口将是理想选择,或者具有成为未来客户的潜力。 #10,#9,#19和#3组中人员的azdias数据点将被视为邮购公司的非目标受众。
- A supervised learning algorithm was built using advanced regression models like AdaBoost, GradientBoost and XGBoost. Techniques to handle imbalanced data like Stratified cross fold techniques were also learnt. ROC_AUC curves for these models were plotted to evaluate them. These models were further fined tuning using pipelines and gridsearch methods as learnt from the nano degree program.使用高级回归模型(如AdaBoost,GradientBoost和XGBoost)构建了监督学习算法。 还学习了处理不平衡数据的技术,例如分层交叉折叠技术。 绘制了这些模型的ROC_AUC曲线以对其进行评估。 这些模型通过使用管道和网格搜索方法(从纳米程度程序中获悉)进行了进一步的优化调整。
- A Kaggle score of 0.79959 was obtained from fine-tuned GradientBoost Regressor model. These results could be improved more by data augmentation techniques and further fine tuning other parameters of the model.从微调的GradientBoost回归模型获得了0.79959的Kaggle分数。 通过数据增强技术和进一步微调模型的其他参数,可以进一步改善这些结果。
5. Improvements like different imputation, standardization and data augmentation techniques were also discussed which can augment the performance of this project further.
5.还讨论了诸如不同归因,标准化和数据增强技术之类的改进,这些改进可以进一步提高该项目的性能。
This project be very useful as it could be applied to various fields. I would like to thank again Avarto Financial Solutions for providing this real world datasets. A big thanks to all the instructors and team members of Udacity for their constant support during the nano degree journey.
该项目非常有用,因为它可以应用于各个领域。 我还要再次感谢Avarto Financial Solutions提供了这个真实的数据集。 非常感谢Udacity的所有讲师和团队成员在纳米学位之旅中的不断支持。
The project workbooks can be found here.[https://github.com/RuchitDoshi/Avarto_Customer_Segmentation]
项目工作簿可以在这里找到。[ https://github.com/RuchitDoshi/Avarto_Customer_Segmentation]
翻译自: https://medium.com/@ruchitsd/customer-segmentation-and-supervised-learning-model-for-avarto-financial-solutions-374c946c99ac
客户细分模型
http://www.taodudu.cc/news/show-997376.html
相关文章:
- 梯度反传_反事实政策梯度解释
- facebook.com_如何降低电子商务的Facebook CPM
- 西格尔零点猜想_我从埃里克·西格尔学到的东西
- 深度学习算法和机器学习算法_啊哈! 4种流行的机器学习算法的片刻
- 统计信息在数据库中的作用_统计在行业中的作用
- 怎么评价两组数据是否接近_接近组数据(组间)
- power bi 中计算_Power BI中的期间比较
- matplotlib布局_Matplotlib多列,行跨度布局
- 回归分析_回归
- 线性回归算法数学原理_线性回归算法-非数学家的高级数学
- Streamlit —使用数据应用程序更好地测试模型
- lasso回归和岭回归_如何计划新产品和服务机会的回归
- 贝叶斯 定理_贝叶斯定理实际上是一个直观的分数
- 文本数据可视化_如何使用TextHero快速预处理和可视化文本数据
- 真实感人故事_您的数据可以告诉您真实故事吗?
- k均值算法 二分k均值算法_使用K均值对加勒比珊瑚礁进行分类
- 衡量试卷难度信度_我们可以通过数字来衡量语言难度吗?
- 视图可视化 后台_如何在单视图中可视化复杂的多层主题
- python边玩边学_边听边学数据科学
- 边缘计算 ai_在边缘探索AI!
- 如何建立搜索引擎_如何建立搜寻引擎
- github代码_GitHub启动代码空间
- 腾讯哈勃_用Python的黑客统计资料重新审视哈勃定律
- 如何使用Picterra的地理空间平台分析卫星图像
- hopper_如何利用卫星收集的遥感数据轻松对蚱hopper中的站点进行建模
- 华为开源构建工具_为什么我构建了用于大数据测试和质量控制的开源工具
- 数据科学项目_完整的数据科学组合项目
- uni-app清理缓存数据_数据清理-从哪里开始?
- bigquery_如何在BigQuery中进行文本相似性搜索和文档聚类
- vlookup match_INDEX-MATCH — VLOOKUP功能的升级
客户细分模型_Avarto金融解决方案的客户细分和监督学习模型相关推荐
- rfm模型分析与客户细分_如何使用基于RFM的细分来确定最佳客户
rfm模型分析与客户细分 With some free time at hand in the midst of COVID-19 pandemic, I decided to do pro bono ...
- python 估值模型_基于Python的客户价值细分模型(RFM)
RFM模型:是衡量客户价值和客户创利能力的重要工具和手段.在众多的客户关系管理(CRM)的分析模式中,RFM模型是被广泛提到的.该机械模型通过一个客户的近期购买行为(recency).购买的总体频率( ...
- 金融风控-- >客户流失预警模型-- >金融数据分析
从这篇博文开始,我将介绍机器学习,深度学习在金融风控这个行业上的应用.其实机器学习,深度学习在一些相关场景上的应用,其解决方法都是大同小异,差不多都是固定的解决套路,但是需要结合这个场景这个行业领域的 ...
- 客户回访|国产MCU测试解决方案 助力中国“芯”智造
半导体技术持续更新迭代,MCU也在与时俱进,为了更好地迎接市场未来趋势,国产MCU厂商积极布局各系列MCU产品线,开始逐渐在特定细分领域实现突破.随着应用场景的进化升级,MCU 中包含越来越多的功能模 ...
- 新里程碑!TDSQL金融核心系统客户数国内领先
腾讯云TDSQL创造了国产数据库一项新的里程碑,这个里程碑,值得国内每一位技术人为之振奋. 9月30日,腾讯云正式对外宣布企业级分布式数据库TDSQL金融核心系统客户已经超过20家,尤其在银行传统核心 ...
- 如何使用人工智能进行目标受众细分和个性化营销:提高客户转化率和忠诚度
作者:禅与计算机程序设计艺术 <87. 如何使用人工智能进行目标受众细分和个性化营销:提高客户转化率和忠诚度> 引言 1.1. 背景介绍 随着互联网的快速发展,大量互联网用户逐渐习惯于使用 ...
- vue项目中动态创建模块以满足客户定制化需求的解决方案
前端项目中很多时候会遇到这样的业务需求: 所有的客户都有共同的一些业务需求,即基础需求 基础需求需要根据业务发展进行升级 在共同需求的基础上,每个客户又有不同的需求(客制化) 如果只是一两个客户还好, ...
- 【数据结构Python描述】优先级队列描述“银行VIP客户插队办理业务”及“被插队客户愤而离去”的模型实现
文章目录 一.支持插队模型的优先级队列 队列ADT扩充 队列记录描述 方法理论步骤 `update(item, key, value)` `remove(item)` 二.支持插队模型的优先级队列实现 ...
- rfm模型的matlab实现,基于客户价值的客户分类模型.docx
基于客户价值的客户分类模型 华中科技大学博士学位论文基于客户价值的客户分类模型研究姓名:刘朝华申请学位级别:博士专业:管理科学与工程指导教师:蔡淑中科技大学博士学位论文摘要随着经济全球化以及网络技术的 ...
最新文章
- centos7 网络服务(二)Unbound实现dns高速缓存
- Linux shell字符串运算
- mysql的root用户密码_MySQL的root用户密码忘了 , 该怎么办?
- python中if有几种使用方式_python 中if-else的多种简洁的写法
- C++程序设计语言(特别版) -- 一个桌面计算器
- CSS Transform让百分比宽高布局元素水平垂直居中
- java中面向对象_java中的面向对象
- 同济大学计算机学院陈震,顾榕-电子与信息工程学院
- solr java api_Solr7.4.0的API(Solrj)操作
- java 程序包jar_把Java程序打包成jar文件包并执行
- 2T比特每秒!瞻博推出业界最快防火墙
- 北大青鸟汉字注释机内码_汉字与机内码相互转换程序
- 怎么阻止计算机安装游戏软件,华硕win8系统怎么禁止电脑自动安装其他软件和游戏?...
- XP系统定时关机命令
- nuxt整合vue-pdf插件和使用createLoadingTask方法进行分页
- 使用PHP的http请求客户端guzzle如何添加请求头
- PyCharm 快速批量注释及取消注释
- seo需要精通php吗?,SEO专职,我们不需要什么都精通吗?
- 想了3年,实现只用了3个月
- 第四天,同系的大佬都已经开始研究算法了,我还在系统徘徊,是我小吴认怂了,我这进度属实有点慢啊!!