python 可视化监控平台_python可视化篇之流式数据监控的实现
preface
流式数据的监控,以下主要是从算法的呈现出发,提供一种python的实现思路
其中:
1.python是2.X版本
2.提供两种实现思路,一是基于matplotlib的animation,一是基于matplotlib的ion
话不多说,先了解大概的效果,如下:
一、一点构思
在做此流数据输出可视化前,一直在捣鼓nupic框架,其内部HTM算法主要是一种智能的异常检测算法,是目前AI框架中垂直领域下的一股清流,但由于其实现的例子对应的流数据展示并非我想要的,故此借鉴后自己重新写了一个,主要是达到三个目的,一是展示真实数据的波动,二是展示各波动的异常得分,三是罗列异常的点。
上述的输出结构并非重点,重点是其实时更新的机制,了解后即可自行定义。另,js对于这种流数据展示应该不难,所以本文主要立足的是算法的呈现角度以及python的实现。
二、matplotlib animation实现思路
(一)、骨架与实时更新
animation翻译过来就是动画,其动画展示核心主要有三个:1是动画的骨架先搭好,就是图像的边边框框这些,2是更新的过程,即传入实时数据时图形的变化方法,3是FuncAnimation方法结尾。
下面以一个小例子做进一步说明:
1.对于动画的骨架:
# initial the figure.
x = []
y = []
fig = plt.figure(figsize=(18, 8), facecolor="white")
ax1 = fig.add_subplot(111)
p1, = ax1.plot(x, y, linestyle="dashed", color="red")
以上分别对应初始化空数据,初始化图形大小和背景颜色,插入子图(三个数字分别表示几行几列第几个位置),初始化图形(数据为空)。
import numpy as np
x = np.arange(0, 1000, 1)
y = np.random.normal(100, 10, 1000)
随机生成一些作图数据,下面定义update过程。
2.对于更新过程:
def update(i):
x.append(xs[i])
y.append(ys[i])
ax1.set_xlim(min(x),max(x)+1)
ax1.set_ylim(min(y),max(y)+1)
p1.set_data(x,y)
ax1.figure.canvas.draw()
return p1
上述定义更新函数,参数i为每轮迭代从FuncAnimation方法frames参数传进来的数值,frames参数的指定下文会进一步说,x/y通过相应更新之后,对图形的x/y轴大小做相应的重设,再把数据通过set_data传进图形,注意ax1和p1的区别,最后再把上述的变化通过draw()方法绘制到界面上,返回p1给FuncAnimation方法。
3.对于FuncAnimation方法:
ani = FuncAnimation(fig=fig,func=update,frames=len(xs),interval=1)
plt.show()
FuncAnimation方法主要是与update函数做交互,将frames参数对应的数据逐条传进update函数,再由update函数返回的图形覆盖FuncAnimation原先的图形,fig参数即为一开始对应的参数,interval为每次更新的时间间隔,还有其他一些参数如blit=True控制图形精细,当界面较多子图时,为True可以使得看起来不会太卡,关键是frames参数,下面是官方给出的注释:
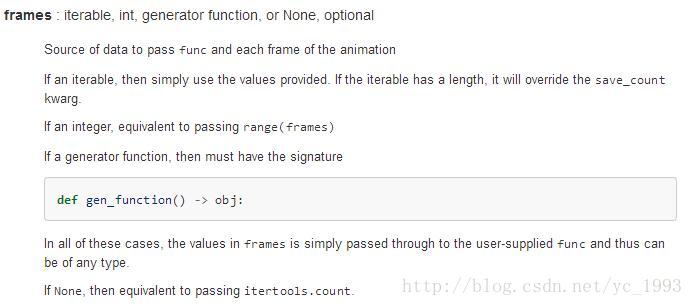
可为迭代数,可为函数,也可为空,上面我指定为数组的长度,其迭代则从0开始到最后该数值停止。
该例子最终呈现的效果如下:

了解大概的实现,细节就不在这里多说了。
(二)、animation的优缺点
animation的绘制的结果相比于下文的ion会更加的细腻,主要体现在FuncAnimation方法的一些参数的控制上。但是缺点也是明显,就是必须先有指定的数据或者指定的数据大小,显然这样对于预先无法知道数据的情况没法处理。所以换一种思路,在matplotlib ion打开的模式下,每次往模板插入数据都会进行相应的更新,具体看第二部分。
三、matplotlib ion实现思路
(一)、实时更新
matplotlib ion的实现也主要是三个核心,1是打开ion,2是实时更新机制,3是呈现在界面上。
1.对于打开ion:
ion全称是 interactive on(交互打开),其意为打开一个图形的交互接口,之后每次绘图都在之前打开的面板上操作,举个例子:
import matplotlib.pyplot as plt
plt.ion()
fig = plt.figure()
ax1 = fig.add_subplot(111)
line, = ax1.plot(t, v, linestyle="-", color="r")
打开交互接口,初始化图形。
2.对于实时更新机制:
import numpy as np
ys = np.random.normal(100, 10, 1000)
def p(a, b):
t.append(a)
v.append(b)
ax1.set_xlim(min(t), max(t) + 1)
ax1.set_ylim(min(v), max(v) + 1)
line.set_data(t, v)
plt.pause(0.001)
ax1.figure.canvas.draw()
for i in xrange(len(ys)):
p(i, ys[i])
随机生成一组数据,定义作图函数p(包含pause表示暂定时延,最好有,防止界面卡死),传入数据实时更新。
3.对于界面最终呈现
plt.ioff()
plt.show()
ioff是关闭交互模式,就像open打开文件产生的句柄,最好也有个close关掉。
最终效果如下:
(二)、ion的优缺点
animation可以在细节上控制比ion更加细腻,这也是ion没有的一点,但是单就无需预先指定数据这一点,ion也无疑是能把流数据做得更加好。
四、最后
贴一下两种方法在最开始那种图的做法,ion我定义成类,这样每次调用只需穿入参数就可以。
animation版本
# _*_ coding:utf-8 _*_
import os
import csv
import datetime
import matplotlib.pyplot as plt
from matplotlib.animation import FuncAnimation
from matplotlib.dates import DateFormatter
import matplotlib.ticker as ticker
# read the file
filePath = os.path.join(os.getcwd(), "data/anomalyDetect_output.csv")
file = open(filePath, "r")
allData = csv.reader(file)
# skip the first three columns
allData.next()
allData.next()
allData.next()
# cache the data
data = [line for line in allData]
# for i in data: print i
# take out the target value
timestamp = [line[0] for line in data]
value = [line[1:] for line in data]
# format the time style 2016-12-01 00:00:00
def timestampFormat(t):
result = datetime.datetime.strptime(t, "%Y-%m-%d %H:%M:%S")
return result
# take out the data
timestamp = map(timestampFormat, timestamp)
value_a = [float(x[0]) for x in value]
predict_a = [float(x[1]) for x in value]
anomalyScore_a = [float(x[2]) for x in value]
# initial the size of the figure
fig = plt.figure(figsize=(18, 8), facecolor="white")
fig.subplots_adjust(left=0.06, right=0.70)
ax1 = fig.add_subplot(2, 1, 1)
ax2 = fig.add_subplot(2, 1, 2)
ax3 = fig.add_axes([0.8, 0.1, 0.2, 0.8], frameon=False)
# initial plot
p1, = ax1.plot_date([], [], fmt="-", color="red", label="actual")
ax1.legend(loc="upper right", frameon=False)
ax1.grid(True)
p2, = ax2.plot_date([], [], fmt="-", color="red", label="anomaly score")
ax2.legend(loc="upper right", frameon=False)
ax2.axhline(0.8, color='black', lw=2)
# add the x/y label
ax2.set_xlabel("date time")
ax2.set_ylabel("anomaly score")
ax1.set_ylabel("value")
# add the table in ax3
col_labels = ["date time", 'actual value', 'predict value', 'anomaly score']
ax3.text(0.05, 0.99, "anomaly value table", size=12)
ax3.set_xticks([])
ax3.set_yticks([])
# axis format
dateFormat = DateFormatter("%m/%d %H:%M")
ax1.xaxis.set_major_formatter(ticker.FuncFormatter(dateFormat))
ax2.xaxis.set_major_formatter(ticker.FuncFormatter(dateFormat))
# define the initial function
def init():
p1.set_data([], [])
p2.set_data([], [])
return p1, p2
# initial data for the update function
x1 = []
x2 = []
x1_2 = []
y1_2 = []
x1_3 = []
y1_3 = []
y1 = []
y2 = []
highlightList = []
turnOn = True
tableValue = [[0, 0, 0, 0]]
# update function
def stream(i):
# update the main graph(contains actual value and predicted value)
# add the data
global turnOn, highlightList, ax3
x1.append(timestamp[i])
y1.append(value_a[i])
# update the axis
minAxis = max(x1) - datetime.timedelta(days=1)
ax1.set_xlim(minAxis, max(x1))
ax1.set_ylim(min(y1), max(y1))
ax1.figure.canvas.draw()
p1.set_data(x1, y1)
# update the anomaly graph(contains anomaly score)
x2.append(timestamp[i])
y2.append(anomalyScore_a[i])
ax2.set_xlim(minAxis, max(x2))
ax2.set_ylim(min(y2), max(y2))
# update the scatter
if anomalyScore_a[i] >= 0.8:
x1_3.append(timestamp[i])
y1_3.append(value_a[i])
ax1.scatter(x1_3, y1_3, s=50, color="black")
# update the high light
if anomalyScore_a[i] >= 0.8:
highlightList.append(i)
turnOn = True
else:
turnOn = False
if len(highlightList) != 0 and turnOn is False:
ax2.axvspan(timestamp[min(highlightList)] - datetime.timedelta(minutes=10),
timestamp[max(highlightList)] + datetime.timedelta(minutes=10),
color='r',
edgecolor=None,
alpha=0.2)
highlightList = []
turnOn = True
p2.set_data(x2, y2)
# add the table in ax3
# update the anomaly tabel
if anomalyScore_a[i] >= 0.8:
ax3.remove()
ax3 = fig.add_axes([0.8, 0.1, 0.2, 0.8], frameon=False)
ax3.text(0.05, 0.99, "anomaly value table", size=12)
ax3.set_xticks([])
ax3.set_yticks([])
tableValue.append([timestamp[i].strftime("%Y-%m-%d %H:%M:%S"), value_a[i], predict_a[i], anomalyScore_a[i]])
if len(tableValue) >= 40: tableValue.pop(0)
ax3.table(cellText=tableValue, colWidths=[0.35] * 4, colLabels=col_labels, loc=1, cellLoc="center")
return p1, p2
# main animated function
anim = FuncAnimation(fig, stream, init_func=init, frames=len(timestamp), interval=0)
plt.show()
file.close()
ion版本
#! /usr/bin/python
import os
import csv
import datetime
import matplotlib.pyplot as plt
from matplotlib.animation import FuncAnimation
from matplotlib.dates import DateFormatter
import matplotlib.ticker as ticker
class streamDetectionPlot(object):
"""
Anomaly plot output.
"""
# initial the figure parameters.
def __init__(self):
# Turn matplotlib interactive mode on.
plt.ion()
# initial the plot variable.
self.timestamp = []
self.actualValue = []
self.predictValue = []
self.anomalyScore = []
self.tableValue = [[0, 0, 0, 0]]
self.highlightList = []
self.highlightListTurnOn = True
self.anomalyScoreRange = [0, 1]
self.actualValueRange = [0, 1]
self.predictValueRange = [0, 1]
self.timestampRange = [0, 1]
self.anomalyScatterX = []
self.anomalyScatterY = []
# initial the figure.
global fig
fig = plt.figure(figsize=(18, 8), facecolor="white")
fig.subplots_adjust(left=0.06, right=0.70)
self.actualPredictValueGraph = fig.add_subplot(2, 1, 1)
self.anomalyScoreGraph = fig.add_subplot(2, 1, 2)
self.anomalyValueTable = fig.add_axes([0.8, 0.1, 0.2, 0.8], frameon=False)
# define the initial plot method.
def initPlot(self):
# initial two lines of the actualPredcitValueGraph.
self.actualLine, = self.actualPredictValueGraph.plot_date(self.timestamp, self.actualValue, fmt="-",
color="red", label="actual value")
self.predictLine, = self.actualPredictValueGraph.plot_date(self.timestamp, self.predictValue, fmt="-",
color="blue", label="predict value")
self.actualPredictValueGraph.legend(loc="upper right", frameon=False)
self.actualPredictValueGraph.grid(True)
# initial two lines of the anomalyScoreGraph.
self.anomalyScoreLine, = self.anomalyScoreGraph.plot_date(self.timestamp, self.anomalyScore, fmt="-",
color="red", label="anomaly score")
self.anomalyScoreGraph.legend(loc="upper right", frameon=False)
self.baseline = self.anomalyScoreGraph.axhline(0.8, color='black', lw=2)
# set the x/y label of the first two graph.
self.anomalyScoreGraph.set_xlabel("datetime")
self.anomalyScoreGraph.set_ylabel("anomaly score")
self.actualPredictValueGraph.set_ylabel("value")
# configure the anomaly value table.
self.anomalyValueTableColumnsName = ["timestamp", "actual value", "expect value", "anomaly score"]
self.anomalyValueTable.text(0.05, 0.99, "Anomaly Value Table", size=12)
self.anomalyValueTable.set_xticks([])
self.anomalyValueTable.set_yticks([])
# axis format.
self.dateFormat = DateFormatter("%m/%d %H:%M")
self.actualPredictValueGraph.xaxis.set_major_formatter(ticker.FuncFormatter(self.dateFormat))
self.anomalyScoreGraph.xaxis.set_major_formatter(ticker.FuncFormatter(self.dateFormat))
# define the output method.
def anomalyDetectionPlot(self, timestamp, actualValue, predictValue, anomalyScore):
# update the plot value of the graph.
self.timestamp.append(timestamp)
self.actualValue.append(actualValue)
self.predictValue.append(predictValue)
self.anomalyScore.append(anomalyScore)
# update the x/y range.
self.timestampRange = [min(self.timestamp), max(self.timestamp)+datetime.timedelta(minutes=10)]
self.actualValueRange = [min(self.actualValue), max(self.actualValue)+1]
self.predictValueRange = [min(self.predictValue), max(self.predictValue)+1]
# update the x/y axis limits
self.actualPredictValueGraph.set_ylim(
min(self.actualValueRange[0], self.predictValueRange[0]),
max(self.actualValueRange[1], self.predictValueRange[1])
)
self.actualPredictValueGraph.set_xlim(
self.timestampRange[1] - datetime.timedelta(days=1),
self.timestampRange[1]
)
self.anomalyScoreGraph.set_xlim(
self.timestampRange[1]- datetime.timedelta(days=1),
self.timestampRange[1]
)
self.anomalyScoreGraph.set_ylim(
self.anomalyScoreRange[0],
self.anomalyScoreRange[1]
)
# update the two lines of the actualPredictValueGraph.
self.actualLine.set_xdata(self.timestamp)
self.actualLine.set_ydata(self.actualValue)
self.predictLine.set_xdata(self.timestamp)
self.predictLine.set_ydata(self.predictValue)
# update the line of the anomalyScoreGraph.
self.anomalyScoreLine.set_xdata(self.timestamp)
self.anomalyScoreLine.set_ydata(self.anomalyScore)
# update the scatter.
if anomalyScore >= 0.8:
self.anomalyScatterX.append(timestamp)
self.anomalyScatterY.append(actualValue)
self.actualPredictValueGraph.scatter(
self.anomalyScatterX,
self.anomalyScatterY,
s=50,
color="black"
)
# update the highlight of the anomalyScoreGraph.
if anomalyScore >= 0.8:
self.highlightList.append(timestamp)
self.highlightListTurnOn = True
else:
self.highlightListTurnOn = False
if len(self.highlightList) != 0 and self.highlightListTurnOn is False:
self.anomalyScoreGraph.axvspan(
self.highlightList[0] - datetime.timedelta(minutes=10),
self.highlightList[-1] + datetime.timedelta(minutes=10),
color="r",
edgecolor=None,
alpha=0.2
)
self.highlightList = []
self.highlightListTurnOn = True
# update the anomaly value table.
if anomalyScore >= 0.8:
# remove the table and then replot it
self.anomalyValueTable.remove()
self.anomalyValueTable = fig.add_axes([0.8, 0.1, 0.2, 0.8], frameon=False)
self.anomalyValueTableColumnsName = ["timestamp", "actual value", "expect value", "anomaly score"]
self.anomalyValueTable.text(0.05, 0.99, "Anomaly Value Table", size=12)
self.anomalyValueTable.set_xticks([])
self.anomalyValueTable.set_yticks([])
self.tableValue.append([
timestamp.strftime("%Y-%m-%d %H:%M:%S"),
actualValue,
predictValue,
anomalyScore
])
if len(self.tableValue) >= 40: self.tableValue.pop(0)
self.anomalyValueTable.table(cellText=self.tableValue,
colWidths=[0.35] * 4,
colLabels=self.anomalyValueTableColumnsName,
loc=1,
cellLoc="center"
)
# plot pause 0.0001 second and then plot the next one.
plt.pause(0.0001)
plt.draw()
def close(self):
plt.ioff()
plt.show()
下面是ion版本的调用:
graph = stream_detection_plot.streamDetectionPlot()
graph.initPlot()
for i in xrange(len(timestamp)):
graph.anomalyDetectionPlot(timestamp[i],value_a[i],predict_a[i],anomalyScore_a[i])
graph.close()
具体为实例化类,初始化图形,传入数据作图,关掉。
以上就是本文的全部内容,希望对大家的学习有所帮助,也希望大家多多支持脚本之家。
python 可视化监控平台_python可视化篇之流式数据监控的实现相关推荐
- 小白学习Flink系列--第二篇-01(流式数据概念)
导读 要想彻底理解Flink,就要了解流数据的前世今生,流数据的语义.特点,以及如何处理,以下文章就能很好的解释流数据的概念和模型,对了解Flink有很大的帮助 前言 今天流式数据处理在大数据领域是一 ...
- 基于Python的直播平台数据分析可视化系统
温馨提示:文末有 CSDN 平台官方提供的学长 Wechat / QQ 名片 :) 1. 项目简介 随着移动互联网和5G的快速发展,视频直播行业呈现出丰富多元的内容形态,覆盖更多的场景和受众,视频成为 ...
- 性能监控与调优篇之【3. JVM 监控及诊断工具-GUI 篇】
文章目录 3. JVM 监控及诊断工具-GUI 篇 3.1. 工具概述 3.2. JConsole 3.3. Visual VM 3.4. Eclipse MAT 3.5. JProfiler 3.6 ...
- 大数据Hadoop之——新一代流式数据湖平台 Apache Hudi
文章目录 一.概述 二.Hudi 架构 三.Hudi的表格式 1)Copy on Write(写时复制) 2)Merge On Read(读时合并) 3)COW vs MOR 四.元数据表(Metad ...
- Apache Griffin+Flink+Kafka实现流式数据质量监控实战
点击上方蓝色字体,选择"设为星标" 回复"面试"获取更多惊喜 八股文教给我,你们专心刷题和面试 Hi,我是王知无,一个大数据领域的原创作者. 放心关注我,获取更 ...
- python 可视化分析平台_python 数据分析数据可视化工具matplotlib
说明: 数据可视化中的数据集下载地址:(数据来源:从零开始学python数据分析和挖掘) 链接:https://pan.baidu.com/s/1zrNpzSNVHd8v1rGFRzKipQ 提取码: ...
- python歌词图表分析_Python可视化图分析毛不易的《入海》,看看听歌的人都在想些什么...
前言 本文的文字及图片来源于网络,仅供学习.交流使用,不具有任何商业用途,版权归原作者所有,如有问题请及时联系我们以作处理. 欢迎关注小编,除了分享技术文章之外还有很多福利,私信学习资料可以领取包括不 ...
- python数据可视化是什么_python可视化数据分析
简介: 想在1天内快速搞定实时业务数据大屏吗?想用最短路径逆袭成为数据可视化大神吗?想在除了PRD外什么都没有的情况下,体验职场真人版绝境求生吗? 概念:LADV是 以上例子中,生成的可视化图表,均可 ...
- 运维大数据可视化分析平台来了,枯燥运维数据也可以生动起来
数字时代监控运维系统数据量暴增,指标.日志.代码堆栈.网络数据包等等时间序列数据从每天几百兆采集量膨胀到每天上百GB,上TB.由于故障总是偶发,而监控数据在故障发生回朔时才更有价值. 如何利用这些低价 ...
最新文章
- 使用Python,EoN模拟网络中的疾病扩散模型,并结合matplotlib绘图
- 中文速读微生物组(宏基因组)前沿文献——这个可以有
- 索引中丢失 IN 或 OUT 参数:: 103,解决办法
- html引入php文件中的函数,在b2core框架和simple_html_dom.php文件里面都有一个load()函数...
- Codeforces Round #168 (Div. 2)D. Zero Tree(DP,中等难度)
- 深入Spring Boot:快速集成Dubbo + Hystrix
- dosbox 伪指令dd为什么会报错_什么是SQL函数?为什么使用SQL函数可能会带来问题?...
- 虚拟化精华问答 | 怎样使虚拟机能够达到比较高的IO性能?
- 移动端html搜索怎么写,移动端实现搜索功能
- 什么时候用removeUnusedSpriteFrames和removeUnusedTextures
- 嵌入式Linux内核开发工程师必须掌握的三十道题
- php 设置跨域axios,vue2.0中proxyTable用axios进行跨域请求的设置方法
- error : cannot open source file SDKDDKVer.h
- Django下载Excel文件
- 人脸识别数据集的建立(dlib+opencv)及人脸识别
- 双网卡同时上内外网设置教程
- Python语言在人工智能(AI)中的优势
- 与大佬沟通,聊到四层代理和七层代理分别指的是什么这个问题时?会擦出什么火花呢
- 集成电路(IC)摩尔定律
- 多态应用-主人与宠物玩耍案例