用于CPU性能SQL Server监视工具
CPU压力降低了服务器速度 (CPU pressure slowing down the server)
This article is the sequel in a series about SQL Server monitoring tools and common performance issues. Before reading this piece, it advisable to read the previous two articles about monitoring tools for disk I/O and memory performance:
本文是有关SQL Server监视工具和常见性能问题的系列文章的续篇。 在阅读本文之前,建议先阅读有关磁盘I / O和内存性能监视工具的前两篇文章:
- SQL Server monitoring tools for disk I/O performance 用于磁盘I / O性能SQL Server监视工具
- SQL Server monitoring tools for memory performance SQL Server内存性能监视工具
However, if you are just interested in CPU pressure that’s okay. This piece can be also read independently. I only advise reading the whole sequel because everything is somehow connected. To kick-off, I always like to mention some symptoms as indicating a condition of CPU issues:
但是,如果您只是对CPU压力感兴趣,那没关系。 这部分也可以独立阅读。 我只建议阅读整个续集,因为一切都以某种方式联系在一起。 首先,我总是喜欢提到一些症状来指示CPU问题的状况:
- Repetitively high CPU utilization – high CPU utilization can be seen in Windows Task Manager. This is an obvious one when you see that the CPU is pegged that’s a good sign that something is going on 重复出现很高的CPU使用率 –在Windows Task Manager中可以看到很高的CPU使用率。 当您看到CPU固定住时,这是一个明显的信号,这表明发生了某些事情
- I/O increase – CPU issues can be manifested from I/O and memory problems. So, I/O should also be checked when troubleshooting CPU issues I / O增加 – CPU问题可以从I / O和内存问题中体现出来。 因此,在对CPU问题进行故障排除时也应检查I / O
- High recompiles – many recompiles can add some cycles to the CPU 高重新编译 –许多重新编译可能会增加CPU的周期
- Expensive queries – even more so than the previous one
- 昂贵的查询 –比上一个查询更为昂贵
性能监控工具 (Tools for performance monitoring)
动态管理视图 (Dynamic management views)
First of all, we have a great DMV called sys.dm_exec_query_stats that returns aggregate performance statistics for cached query plans in SQL Server. This DMV can be used in various ways. For example, it can be used for both finding a high number of recompiles and expensive queries.
首先,我们有一个名为sys.dm_exec_query_stats的出色DMV,它可以为SQL Server中的缓存查询计划返回汇总性能统计信息。 该DMV可以多种方式使用。 例如,它可以用于查找大量重新编译和昂贵的查询。
So, let’s look at different ways this query stats is used as SQL Server monitoring tool. Paste the code from below and execute it:
因此,让我们看一下此查询统计信息用作SQL Server监视工具的不同方式。 从下面粘贴代码并执行:
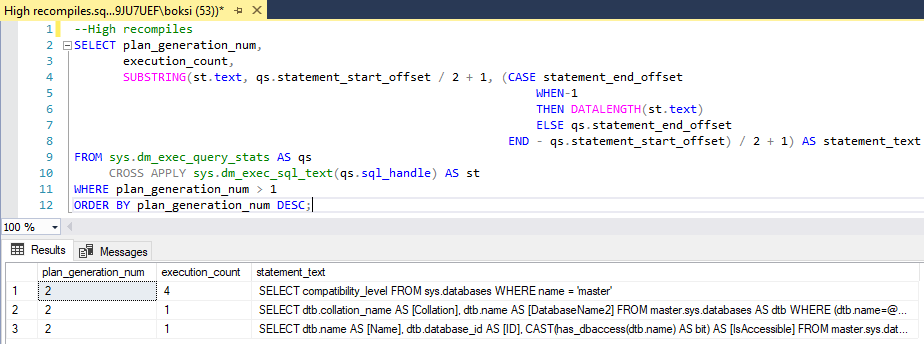
--High recompiles
SELECT plan_generation_num, execution_count, SUBSTRING(st.text, qs.statement_start_offset / 2 + 1, (CASE statement_end_offsetWHEN-1THEN DATALENGTH(st.text)ELSE qs.statement_end_offsetEND - qs.statement_start_offset) / 2 + 1) AS statement_text
FROM sys.dm_exec_query_stats AS qsCROSS APPLY sys.dm_exec_sql_text(qs.sql_handle) AS st
WHERE plan_generation_num > 1
ORDER BY plan_generation_num DESC;
Here you can see a selection from query stats where plan generation is greater than one. That’s just an indicator that a query has done more than one recompile. If it’s done more than one, there’s a good chance that it will continue to do so. Here’s my result:
在这里,您可以查看查询统计中的选择,其中计划生成大于一个。 这只是一个查询已完成多次重新编译的指示。 如果完成了多个操作,则很有可能会继续这样做。 这是我的结果:
In a production environment, you’ll most likely get a larger set of data.
在生产环境中,您很可能会获得更大的数据集。
Another way to use query stats is shown in the code below. This time, we’re finding the TOP 10 expensive queries. Paste the code in query editor and execute it:
下面的代码显示了使用查询统计信息的另一种方法。 这次,我们发现前10个昂贵的查询。 将代码粘贴到查询编辑器中并执行:
--Expensive queries
SELECT TOP 10 creation_time, last_execution_time, total_worker_time, total_elapsed_time, SUBSTRING(st.text, qs.statement_start_offset / 2 + 1, (CASE statement_end_offsetWHEN-1THEN DATALENGTH(st.text)ELSE qs.statement_end_offsetEND - qs.statement_start_offset) / 2 + 1) AS statement_text
FROM sys.dm_exec_query_stats AS qsCROSS APPLY sys.dm_exec_sql_text(qs.sql_handle) AS st
ORDER BY total_worker_time DESC;
Feel free to edit the TOP part and enter any desired number of queries that you want to be returned:
随时编辑TOP部分并输入要返回的查询数量:
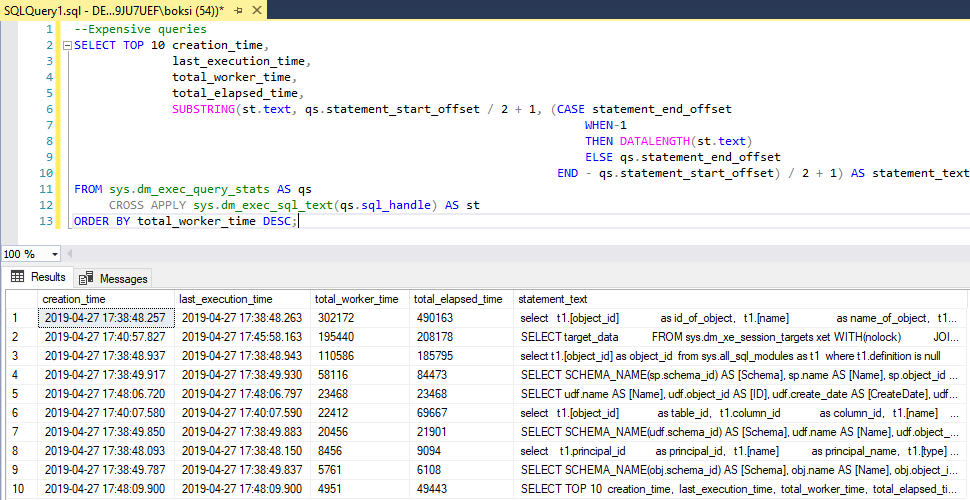
You’ll notice that both queries are identical except for what we’re selecting and in the second one we’re ordering by total worker time which essentially will return information about the TOP N queries ranked by processor time.
您会注意到,除了我们选择的查询以外,这两个查询都是相同的;在第二个查询中,我们将按总工作时间排序,这实际上将返回有关按处理器时间排序的TOP N个查询的信息。
性能监控器 (Performance Monitor)
The Performance Monitor side, we have a few SQL Server monitoring tools AKA counters that can be used when troubleshooting CPU performance. The following counters are simple and easy to use:
在性能监视器方面,我们有一些SQL Server监视工具AKA计数器,可在对CPU性能进行故障排除时使用。 以下计数器简单易用:
- Processor % Processor Time == < 80% 处理器百分比处理器时间== <80%
- Processor % User Time == < 80% 处理器百分比用户时间== <80%
- Processor % Privileged time) == < 30% 处理器%特权时间)== <30%
Understanding processor time is not so difficult. Overall, this value should be less than 80 percent. The same rule applies for user time, and lastly, privileged time should be less than 30 percent. If any of these are above, it’s a good sign that we’re stressing out the CPU. Bear in mind that when troubleshooting CPU issues using any SQL Server monitoring tool, you should always take into consideration external factors as well not only the CPU that are causing extra cycles.
了解处理器时间并不是那么困难。 总体而言,该值应小于80%。 相同的规则适用于用户时间,最后,特权时间应少于30%。 如果以上任何一项,都表明我们正在对CPU施加压力。 请记住,在使用任何SQL Server监视工具对CPU问题进行故障排除时,您应始终考虑外部因素,而不仅仅是引起额外循环的CPU。
If we head over to Performance Monitor, we can quickly create another data collector set and add the above performance counters. I kept it running for about 10 minutes just to create data logs of counters we previously included. This time, I did not run the stress tool in the background because it would clearly create heat on my local machine and that’s not the point. The goal here is to identify if the CPU is under the pressure under normal circumstances. Here’re my results:
如果转到Performance Monitor,我们可以快速创建另一个数据收集器集并添加上述性能计数器。 我将其运行了大约10分钟,只是为了创建我们之前包含的计数器的数据日志。 这次,我没有在后台运行压力工具,因为它显然会在我的本地计算机上产生热量,这不是重点。 此处的目标是确定在正常情况下CPU是否处于压力下。 这是我的结果:
By looking at this report, we can see that privileged time is pretty good, the same goes for both processor and user time. All of them are in good shape. But then again, this in my local machine. The results on e.g. production server can be radically different. Look out for these counters not to exceed the numbers specified above.
通过查看此报告,我们可以看到特权时间相当不错,处理器时间和用户时间也是如此。 他们都身体状况良好。 但是再说一次,这在我的本地机器上。 例如生产服务器上的结果可能完全不同。 请注意这些计数器不要超过上面指定的数量。
Rather than writing another article in series about SQL Server monitoring tools, I want to briefly cover concurrency that I mentioned in the 1st article under the list of common performance issues. Concurrency is pretty much the easy one to troubleshoot. This is contractionary to what I wrote in the initial article when I said that it’s a tough nut to crack. Both statements are somewhat true. It all depends on how the concurrency manifests itself.
而不是写在有关SQL Server监视工具系列另一篇文章中,我想简要地盖并发,我第1 篇文章中提到的常见性能问题的列表下。 并发几乎是很容易解决的问题。 这与我在第一篇文章中写的那句话是紧缩的,这是我很难破解的。 两种说法都是正确的。 这完全取决于并发如何表现出来。
Some good symptoms of concurrency will be:
并发的一些良好症状是:
- Slow throughput 吞吐速度慢
- Blocking events 封锁事件
- CPU/Memory/IO utilization is normal but… CPU /内存/ IO利用率正常,但是…
The last one is tricky because CPU, memory, and I/O can be in order, but people could still complain about performance issues which is a good indicator that we most likely have an issue with concurrency. Furthermore, this issue is probably coming from locking or blocking.
最后一个比较棘手,因为CPU,内存和I / O可以按顺序排列,但是人们仍然可以抱怨性能问题,这很好地表明了我们很可能存在并发问题。 此外,此问题可能来自锁定或阻塞。
We got two DVMs to discover locks:
我们有两个DVM来发现锁:
- sys_dm_os_waiting_tasks sys_dm_os_waiting_tasks
- sys_dm_tran_locks sys_dm_tran_locks
Performance Monitor side, we also got two counters:
在性能监视器方面,我们还有两个计数器:
- SQLServer:Locks\Lock Waits/sec == 0 SQLServer:Locks \ Lock Waits / sec == 0
- SQLServer:Locks\Lock Wait Time (ms) == 0 SQLServer:Locks \ Lock等待时间(ms)== 0
These two combined will give a good sign if there’s some locking going on and how severe it is. I’m pretty sure that I don’t have any locking on my local machine, so I won’t even go to Performance Monitor, but the point is that those counters can be used as SQL Server monitoring tool when troubleshooting locking issues.
如果正在进行一些锁定以及锁定的严重程度,那么这两者的结合将是一个好兆头。 我很确定自己在本地计算机上没有任何锁定,所以我什至都不会去性能监视器,但要点是,在对锁定问题进行故障排除时,这些计数器可用作SQL Server监视工具。
故障排除策略 (Troubleshooting strategy)
One last thing I want to mention is a troubleshooting strategy. It always helps when troubleshooting an issue on any level, especially performance problems to have strategy in place. That way, when a critical moment occurs, you’ll be able to approach the problem correctly. Here’s a list of what you should do and in which order:
我要提到的最后一件事是故障排除策略。 在任何级别对问题进行故障排除时,特别是在制定性能策略时,它总是有帮助的。 这样,当关键时刻发生时,您将能够正确解决问题。 以下是您应该执行的操作和顺序的列表:
- Define the problem – this can be hard because it can get as general as “everything is slow” or “the system is unresponsive”. The best case is when the problem is specific, and we can say something like “we have a locking problem on this table”. Anyhow, this should be a starting point. I wouldn’t do anything without describing the problem as detailed as possible定义问题–这可能很难,因为它可能像“一切都很缓慢”或“系统无响应”一样普遍。 最好的情况是问题是特定的,我们可以说“在此表上有锁定问题”之类的话。 无论如何,这应该是一个起点。 如果不尽可能详细地描述问题,我不会做任何事情
- Analyze if internal or external – this is an important step because it can get us halfway through fixing the problem. Especially if there’s other stuff running on SQL Server then that can open a whole new can of worms. So, if internal you’re halfway there. If not, well then, it’s another story but either way, I’d always go through this step分析内部还是外部–这是重要的一步,因为它可以使我们半步解决问题。 尤其是如果SQL Server上还有其他东西正在运行,那可能会打开全新的蠕虫病毒罐。 因此,如果您是内部人员,那么您就在中间。 如果不是,那么那就是另一回事了,无论如何,我总是会经历这一步
- Determine if current or ongoing – if we know that it’s internal (SQL Server is the issue), then we must find out if it’s current or ongoing. Current means it just happened, we are certain that this is the first time a problem occurred. If it’s ongoing it means that maybe it has been a week without even knowing that it’s there. In this case, logs can help. Furthermore, let’s say that it’s the first time you’ve seen it, but you simply don’t know if it has been ongoing or not. Well then you can set up an extended event or/and Performance Monitor or any other SQL Server monitoring tool that you prefer to run for a day or two to find out if something is repeated issue or just a one-time thing确定是当前的还是正在进行的–如果我们知道它是内部的(SQL Server是问题所在),那么我们必须找出它是当前的还是正在进行的。 当前意味着它刚刚发生,我们可以肯定这是第一次出现问题。 如果它正在进行,则意味着可能已经有一个星期了,甚至都不知道它在那里。 在这种情况下,日志可以提供帮助。 此外,假设这是您第一次看到它,但是您根本不知道它是否正在进行。 那么,您可以设置一个扩展事件或/和性能监视器,或者您希望运行一两天的其他任何SQL Server监视工具,以发现重复出现的问题还是一次性的事情
- Identify and resolve – this is an obvious one that needs no explanation. With a bit of luck and following the previous three steps, you’ll get here rapidly识别并解决-这是显而易见的,无需解释。 运气好的话,按照前面的三个步骤,您会很快到达这里
I want to wrap things up with this 3rd chapter on SQL Server monitoring tools.
我想用有关SQL Server监视工具的第3章来总结一下。
Hopefully, this series has been informative for you and I thank you for reading it.
希望本系列对您有所帮助,感谢您阅读本系列。
目录 (Table of contents)
| SQL Server monitoring tools for disk I/O performance |
| SQL Server monitoring tools for memory performance |
| SQL Server monitoring tool for CPU performance |
| 用于磁盘I / O性能SQL Server监视工具 |
| SQL Server内存性能监视工具 |
| 用于CPU性能SQL Server监视工具 |
翻译自: https://www.sqlshack.com/sql-server-monitoring-tool-for-cpu-performance/
用于CPU性能SQL Server监视工具相关推荐
- 用于磁盘I / O性能SQL Server监视工具
The goal of this article is to get familiar with SQL Server monitoring tools and identify what some ...
- ssdt_用于商业智能开发SQL Server数据工具(SSDT)的演变
ssdt By all accounts, the introduction of SQL Server Data Tools (SSDT) in SQL Server 2012 was a wate ...
- SQL Server Profiler工具
SQL Server Profiler工具 原文:SQL Server Profiler工具 一.SQL Profiler工具简介 SQL Profiler是一个图形界面和一组系统存储过程,其作用如下 ...
- 官方正版 Devart dbForge Studio for SQL Server 数据库管理工具 - 正版软件商城 - 软购商城
dbForge Studio for SQL Server 是一个功能强大的 IDE,可用于 Microsoft SQL Server 管理,管理,开发,数据报告,分析等等. SQL 开发人员和执行复 ...
- sql server 监视_监视SQL Server报告服务
sql server 监视 介绍 ( Introduction ) In our last get together I mentioned that oft times SQL Server rep ...
- sql server 监视_使用动态管理对象监视SQL Server –请求
sql server 监视 In my last post, Monitoring SQL Server with dynamic management objects – Sessions and ...
- sql server 监视_使用动态管理对象监视SQL Server –会话和连接
sql server 监视 A fundamental task of Database Administrators is monitoring SQL Server performance. Wh ...
- SQL Server商业智能功能– SQL Server数据工具–商业智能
介绍 (Introduction) 在上一篇有关introduction to SQL Server business intelligence we covered the general stru ...
- 使用SQL Server数据工具进行SQL单元测试
This article on SQL Unit Testing is the second part on the series about SSDT and database developmen ...
最新文章
- 单片机节日彩灯实训报告_单片机课程设计(节日彩灯控制)
- oracle数据库exp命令导入导出dmp文件演示,oracle数据库备份还原功能
- 让Dapper在一个项目中支持多种库
- scp会覆盖同名文件吗_你会Hypermesh一键式完成几何文件到求解文件的输出吗?
- NETCF运行平台检测
- lsqnonlin函数_matlab非线性最小二乘函数
- linux系统及服务安全(持续更新中)
- 在Linux上录制终端的操作
- opencv图像及视频感兴趣区域设置
- 最大最小距离聚类算法c语言,聚类算法-最大最小距离算法(实例+代码)
- 在latex中使用GB/T 7714—2015参考文献著录规则
- 山科大离散数学期末考试_离散数学期末考试试题及答案
- 2012最新JQuery插件
- 节点name在graph中无法展示_小节点 · 大奥秘│这正是你想学习的精妙休闲观景空间!(内含视频讲解)...
- 2021-01-15
- matlab截取rect,MATLAB 标注 图像上截取Rect区域图像
- docker run 命令的 -i -t -d选项的作用
- 印度黑客号称世界第一,结果第二天被中国黑客干掉了
- SCI Translate 11安装教程
- 打印机修复工具_打印机常见故障排除及修复方法
热门文章
- newifimini出厂固件_新路由mini固件|newifi新路由mini OS固件V3.2.1.1100 抢先版 - 极光下载站...
- 学习Spring Boot前需要了解的Spring基础知识
- 在Recyclerview使用GlideAPP加载大量图片导致内存溢出(oom)
- PostgreSql之在group by查询下拼接列字符串
- 解决Qt-至少需要一个有效且已启用的储存库 问题
- Core Animation 文档翻译 (第二篇)—核心动画基础要素
- 高性能JavaScript(您值得一看)
- MySQL redo lock 死锁问题排查 解决过程
- 《C++标准程序库》学习笔记(一)C++相关特性
- Delphi版 IsNumeric 函数