用于磁盘I / O性能SQL Server监视工具
The goal of this article is to get familiar with SQL Server monitoring tools and identify what some of the most common SQL Server performance problems are.
本文的目的是熟悉SQL Server监视工具,并确定哪些是最常见SQL Server性能问题。
Dealing with performance problems is not an easy task but it all comes down to I/O, CPU, memory, or concurrency related stuff. SQL Server monitoring tools can help us paint the big picture. It’s all about identifying which one of these is causing the problem. A lot of times it can be a combination of two or more, or it could look like one but it’s actually other.
处理性能问题并不是一件容易的事,但这全归结于I / O,CPU,内存或并发相关的内容。 SQL Server监视工具可以帮助我们大致了解。 这完全是要确定其中哪一个导致了问题。 很多时候,它可以是两个或多个的组合,或者看起来像一个,但实际上是另一个。
Let’s start by mentioning some of the common performance issues:
让我们从提及一些常见的性能问题开始:
- High I/O during peak or maintenance times 高峰或维护时间内的高I / O
- Memory pressure slowing down queries 内存压力使查询变慢
- CPU pressure slowing down database server CPU压力降低了数据库服务器的速度
- Concurrency issue from locking/blocking 锁定/阻止引起的并发问题
High input/output represents disk subsystems doing too much work. Particularly during peak or maintenance times. Input/output bottlenecks can be the hardest to troubleshoot because they are usually manifested from memory or CPU issues. Furthermore, they can be also manifested from poorly written queries and not having a good indexing strategy.
高输入/输出表示磁盘子系统做了太多的工作。 特别是在高峰或维护时间。 输入/输出瓶颈可能最难解决,因为它们通常从内存或CPU问题中体现出来。 此外,它们还可以通过书写不佳的查询以及没有好的索引策略来体现。
How that we’ve mentioned indexing strategy, this is a big piece of the puzzle that cannot be achieved easily. But here’s an article that you will hopefully find informative and useful: SQL index maintenance
我们如何提到索引策略,这是一个不容易实现的难题。 但是,本文希望您能从中找到有用的信息: SQL索引维护
Bear in mind that proper indexing and query tuning can have a significant impact on all areas of SQL Server performance.
请记住,正确的索引编制和查询调整可能会对SQL Server性能的所有方面产生重大影响。
All these factors are a good reason why it’s a good idea to look at I/O last, even though it first in the list, just to rule out any other things that can cause I/O problems.
所有这些因素都是一个很好的理由,尽管在列表中排在第一位,但最好还是先看一下I / O,以便排除可能导致I / O问题的所有其他因素。
Memory pressure can simply become an issue when the system doesn’t have enough RAM of SQL Server cannot allocate enough memory or more commonly poor database and query design. Lack of memory can also be caused by high I/O. Yeah right, it goes both ways. This is, again, why it can get tricky when troubleshooting SQL Server performance.
当系统没有足够SQL Server RAM不能分配足够的内存,或更常见的是数据库和查询设计较差时,内存压力可能只是一个问题。 高I / O也可能导致内存不足。 是的,这是双向的。 同样,这就是为什么在对SQL Server性能进行故障排除时会变得棘手的原因。
The general rule of thumb between these two is that memory pressure happens randomly for example when a raw query is pulling out all the data in a table and sucks up all the SQL Server memory. High I/O is happening at specific times. You can usually tell for example if every day at 3 PM the SQL Server comes to its knees, then you most likely have an I/O issue rather than a memory issue.
这两者之间的一般经验法则是,内存压力随机发生,例如当原始查询提取表中的所有数据并占用所有SQL Server内存时。 高I / O在特定时间发生。 例如,通常可以说出,如果每天下午3点SQL Server瘫痪,那么很可能是I / O问题而不是内存问题。
CPU pressure can come from a variety of things but generally, it’s come from expensive queries or external factors. First, you should deal with external stuff. This can be an application running on the database server that is sucking up all resources. But, as before, CPU pressures can also cause high I/O.
CPU压力可能来自多种因素,但总的来说,它来自昂贵的查询或外部因素。 首先,您应该处理外部事物。 这可能是在数据库服务器上运行的应用程序正在消耗所有资源。 但是,像以前一样,CPU压力也会导致高I / O。
Last but not least, concurrency can cause performance issues but this is a tough nut to crack. Because even if the I/O, memory, and CPU levels are normal, you can still have people complaining about waiting and slowdowns in an application, then it’s probably coming from locking and blocking issue.
最后但并非最不重要的一点是,并发会导致性能问题,但这是一个难以克服的难题。 因为即使I / O,内存和CPU级别正常,您仍然可以让人们抱怨应用程序中的等待和速度降低,所以它可能来自锁定和阻止问题。
Bottom line is to get the big picture, we need to take all the above factors into account when troubleshooting performance issues. To achieve this, we got a lot of SQL Server monitoring tools.
最重要的是要了解全局,在对性能问题进行故障排除时,我们需要考虑上述所有因素。 为此,我们获得了许多SQL Server监视工具。
Some of the common tools for performance monitoring are:
用于性能监视的一些常用工具是:
- Dynamic Management Views 动态管理视图
- Performance monitor 性能监控器
- Extended events 扩展事件
- Execution plans 执行计划
- Data collector 资料收集器
- Resource governor 资源调控器
We got a lot of DMVs as part of SQL Server monitoring tools for troubleshooting all common performance issues and we will be looking into some of them later in this article. We will also look at Performance monitor and the most popular counters used for identifying common I/O performance issues. Extended events profile is used for logging all the information within SQL Server. Execution plans are also very imported along with the database engine tuning advisor to help us out with query optimization and fine-tuning. The data collector can be used to monitor performance and SQL Server has its own data collector as well that compiles performance statistics. Lastly, we got a Resource governor which is good for controlling resources at the SQL Server level.
作为SQL Server监视工具的一部分,我们提供了许多DMV,用于对所有常见的性能问题进行故障排除,我们将在本文的后面部分研究它们。 我们还将介绍性能监视器和用于识别常见I / O性能问题的最受欢迎的计数器。 扩展事件配置文件用于记录SQL Server中的所有信息。 执行计划也与数据库引擎调整顾问一起非常重要地导入,以帮助我们进行查询优化和微调。 数据收集器可用于监视性能,SQL Server具有自己的数据收集器,该数据收集器还可以编译性能统计信息。 最后,我们获得了一个资源调控器,它非常适合在SQL Server级别上控制资源。
For more information about Query optimization, see the SQL Query Optimization — How to Determine When and If It’s Needed article
有关查询优化的更多信息,请参见“ SQL查询优化-如何确定何时以及是否需要”一文。
A lot of the times when troubleshooting performance problems, we can’t just use one of the SQL Server monitoring tools. Those tools represent an ecosystem and we’re going to need many tools combined to paint the big picture. Understanding how each of the tools work will go a long way when it comes to solving performance issues.
很多时候,在对性能问题进行故障排除时,我们不能仅仅使用一种SQL Server监视工具。 这些工具代表了一个生态系统,我们将需要许多工具组合以描绘全局。 在解决性能问题时,了解每种工具的工作原理将大有帮助。
Let’s head over to SSMS and see how we can identify common I/O performance problems by using some of the stuff mentioned above.
让我们转到SSMS,看看如何通过使用上面提到的一些内容来识别常见的I / O性能问题。
To kick off, we are going to see how we can simulate writes/reads and use the most common DVMs to pull out some useful information from SQL Server. But before we continue, one other very important thing when troubleshooting almost anything is to have baselines. This will provide you with a minimum or starting point used for comparisons. In other words, having a baseline will give us an insight into what’s normal. To obtain this, we’d have to break out multiple SQL Server monitoring tools like performance monitor, extended events, etc. Gather data, for example, on a slow day and that’s how you’ll know what normal is. Ultimately, this will make it a lot easier to find out what abnormal is.
首先,我们将看到如何模拟写入/读取并使用最常见的DVM从SQL Server中提取一些有用的信息。 但是在继续之前,对几乎所有内容进行故障排除时,另一非常重要的事情是要具有基准。 这将为您提供用于比较的最低或起点。 换句话说,有了基线将使我们对正常现象有所了解。 为此,我们必须推出多个SQL Server监视工具,例如性能监视器,扩展事件等。例如,在天气缓慢的时候收集数据,这样您就会知道什么是正常的。 最终,这将使发现异常情况变得容易得多。
Moving on, some of the symptoms of the problem with I/O are:
继续,I / O问题的一些症状是:
- High amount of I/O wait types 大量的I / O等待类型
- Performance decrease during specific times 特定时间的效果下降
- Excessive disk latency 磁盘延迟过长
- I/O warning is SQL Server error logs I / O警告是SQL Server错误日志
Useful DMVs in cases above that can help us identify bottlenecks with I/O are:
在上述情况下,可以帮助我们识别I / O瓶颈的有用DMV为:
- sys.dm_os_wait_stats sys.dm_os_wait_stats
- sys.dm_os_waiting_tasks sys.dm_os_waiting_tasks
- sys.dm_io_virtual_file_stats sys.dm_io_virtual_file_stats
There are many wait stats in SQL Server and there is some great documentation online, but a list of most commonly encountered types and steps that should be taken for more serious troubleshooting can be found here: SQL Server wait types
SQL Server中有许多等待统计信息,并且在线上有一些不错的文档,但是可以在此处找到最常见的类型和应采取的步骤以进行更严重的故障排除的列表: SQL Server等待类型
Every time a thread executes and waits on e.g. disk, CPU, query, etc. it all gets stored inside these statistics. Furthermore, we have the waiting tasks that return information about the wait queue of tasks in real-time of anything currently waiting. Finally, we got virtual file stats that returns I/O statistics for data and log files. So, let’s fire up SSMS and see view overall stats by executing the query from below:
每次线程执行并在磁盘,CPU,查询等上等待时,所有线程都存储在这些统计信息中。 此外,我们拥有等待任务,这些任务可以实时返回当前正在等待的任何事物的有关任务等待队列的信息。 最后,我们获得了虚拟文件统计信息,该统计信息返回数据和日志文件的I / O统计信息。 因此,让我们启动SSMS并通过执行以下查询来查看总体统计信息:
SELECT *
FROM sys.dm_os_wait_stats dows
ORDER BY dows.wait_time_ms DESC;
The result of this query will be a running total of any time a thread waited on something:
该查询的结果将是线程在等待任何东西时的总运行时间:
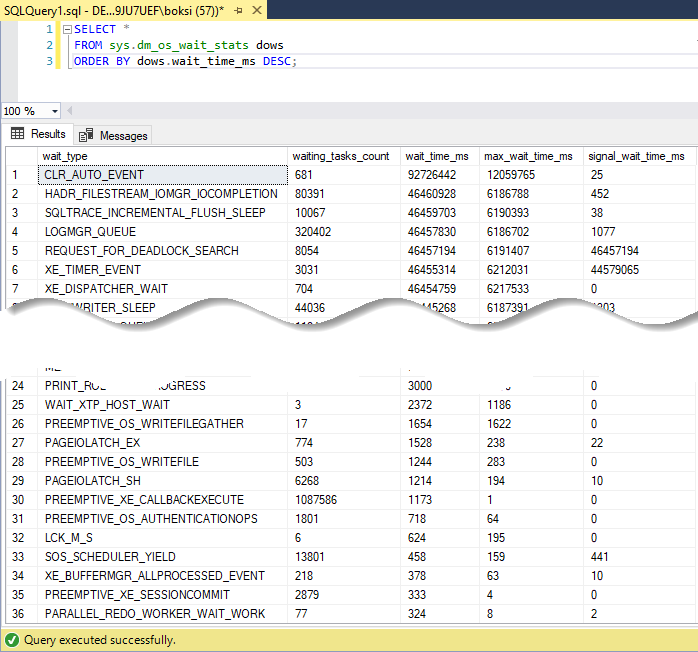
Note in the status bar, that 875 rows are returned. This means that there are so many different categories AKA wait types in SQL Server. The total number may vary depending on the SQL Server version:
请注意,在状态栏中,将返回875行。 这意味着SQL Server中的AKA等待类型种类繁多。 总数可能因SQL Server版本而异:
Essentially, what you should look for among these wait types when troubleshooting I/O is anything that starts with PAGEIOLATCH. Anything with this in front simply means that there is a delay when writing to the physical database files.
本质上,对I / O进行故障排除时,您应该在这些等待类型中寻找的是从PAGEIOLATCH开始的内容。 前面的所有内容仅表示在写入物理数据库文件时会有延迟。
Next, we can execute another query to see the current task waits:
接下来,我们可以执行另一个查询以查看当前任务正在等待:
SELECT *
FROM sys.dm_os_waiting_tasks dowt
WHERE dowt.wait_type LIKE 'PAGEIOLATCH%';
This query returns the current task that currently have a specific wait type. The example above will return something when a task is waiting on a latch for a buffer that is in an I/O request. Mine returned nothing.
该查询返回当前具有特定等待类型的当前任务。 当任务在闩锁上等待I / O请求中的缓冲区时,以上示例将返回某些内容。 我的东西什么也没退。
To view I/O latency stats by database/files execute the following query:
要按数据库/文件查看I / O延迟统计信息,请执行以下查询:
SELECT *
FROM sys.dm_io_virtual_file_stats(DB_ID('AdventureWorks2014'), NULL) divfs
ORDER BY divfs.io_stall DESC;
To return latency statistics for all databases, feel free to pass null instead of the database name. But ultimately, the query returns I/O statistics for data and log files:
要返回所有数据库的延迟统计信息,请随时传递null而不是数据库名称。 但最终,查询返回数据和日志文件的I / O统计信息:
Those latencies statistics will be broken down by file and you’ll notice that the result is ordered by a column called “io_stall”. This is a great column because it tells us how long a user waited for the data to be written to that file in milliseconds. So, this could be a good indication if we previously set our baselines here and we notice that some stalls are higher than usual, then this could be an indication that a disk has too much activity on it or maybe it needs to be upgraded.
这些延迟统计信息将按文件进行细分,您会注意到结果是按“ io_stall”列排序的。 这是一本很棒的专栏,因为它告诉我们用户等待数据以毫秒为单位的时间。 因此,这可能是一个很好的指示,如果我们之前在此处设置了基准,并且发现有些停顿情况比平时高,那么这可能表明磁盘上的活动过多或可能需要升级。
Moving on, let’s look at some of the performance counters that we can use to troubleshoot I/O. When you use any SQL Server monitoring tool like for example Performance Monitor, you’ll probably see stuff like Logical/Physical Disk Avg. Disk sec/read/write/transfer counters. Logical and physical are separate categories and both need to be tracked. Physical refers to an actual physical HDD or SSD (or array in a hardware RAID setup), whereas logical refers to a volume that has been created on that disk. Read, write, and transfer counters measure the time needed in milliseconds for an I/O request to be serviced by either logical or physical request. Preferably, this value should be less than 10ms, between 10 and 15 is acceptable and more than 15 should be troubleshoot. Furthermore, if the idle time is constantly less than 50% meaning that our disks are always busy then we may have to look at that as well.
继续,让我们看一些可以用来对I / O进行故障排除的性能计数器。 当您使用任何SQL Server监视工具(例如性能监视器)时,您可能会看到诸如逻辑/物理磁盘平均数之类的东西。 磁盘秒/读/写/传输计数器。 逻辑和物理是分开的类别,都需要跟踪。 物理是指实际的物理HDD或SSD(或硬件RAID设置中的阵列),而逻辑是指已在该磁盘上创建的卷。 读取,写入和传输计数器测量以逻辑或物理请求服务的I / O请求所需的时间(以毫秒为单位)。 最好,该值应小于10毫秒,可接受的范围是10到15,大于15则应排除故障。 此外,如果空闲时间始终小于50%,这意味着我们的磁盘总是很忙,那么我们可能还必须考虑一下。
We have two useful SQL Server monitoring tools or metrics that are simple counters we can use in this category and those are full scans and index searches. Those will give us insight into how much extra I/O is occurring because of the lack of indexes or poor indexing strategy. In practice, if full scans per second are high then we should troubleshoot using the Database Engine Tuning Advisor to get some index suggestions. On the other side, if index searches are low then we should troubleshoot again because it’s an indication that the indexing strategy is not working out.
我们有两个有用SQL Server监视工具或指标,它们是可以在此类别中使用的简单计数器,它们是完整扫描和索引搜索。 这些将使我们了解由于缺少索引或索引策略不佳而产生了多少额外的I / O。 实际上,如果每秒完整扫描的速度很高,那么我们应该使用数据库引擎优化顾问进行故障排除,以获取一些索引建议。 另一方面,如果索引搜索量较低,那么我们应该再次进行故障排除,因为这表明索引策略没有奏效。
If your SQL Server is suddenly slower than you remember, one of the best SQL Server monitoring tools is actually the Performance Monitor on Windows that can be used to get to the bottom of the issue. Let’s fire up this bad boy and see how we can work with some of the counters mentioned before. Use the Windows key + R keyboard shortcut to open the Run command, type “perfmon”, and click OK to open:
如果您SQL Server突然比您想起的慢,那么最好SQL Server监视工具之一实际上就是Windows上的性能监视器,可用于深入探究问题。 让我们解雇这个坏男孩,看看我们如何使用前面提到的一些计数器。 使用Windows键+ R键盘快捷键打开“运行”命令,键入“ perfmon”,然后单击“ 确定”打开:
When you first open this SQL Server monitoring tool, it’ll open in the main page with a classic overview where we can watch counters. What I like to do is to create a custom Data Collector Set which is how we can create custom sets holding performance counters and alerts based on specific criteria. Let’s quickly create a custom Data Collector Set just to walk you through all the steps in the wizard and to see how to collect specific performance information.
首次打开此SQL Server监视工具时,它将在主页上打开,其中包含经典的概述,我们可以在其中监视计数器。 我想做的是创建一个自定义的数据收集器集,这是我们可以根据特定条件创建包含性能计数器和警报的自定义集的方法。 让我们快速创建一个自定义的数据收集器集,以带您逐步完成向导中的所有步骤,并了解如何收集特定的性能信息。
Expand Data Collector Sets, right-click User Defined, select New, and then click Data Collector Set:
展开“ 数据收集器集” ,右键单击“ 用户定义” ,选择“ 新建” ,然后单击“ 数据收集器集” :
Give this new data collector a name, we don’t want to create it from a template, so change to option to Create manually (Advanced) and click Next:
给这个新的数据收集器起个名字,我们不想从一个模板创建它,所以将选项更改为“ 手动创建(高级)” ,然后单击“ 下一步” :
As for the data type, we want to track performance counters so check the Performance counter option and click Next:
至于数据类型,我们要跟踪性能计数器,因此请选中“ 性能计数器”选项,然后单击“ 下一步” :
Next, the wizard will ask you which performance counters you would like to log. Counters can be added by simply clicking the Add… option and locating them in the list. For example, we can locate SQLServer:Access Methods, expand it to find Full Scans/sec and Index Searches/sec counters. You can select multiple counters by holding the Shift key and then just click the Add >> button to add them. Also, if you need additional info about any specific counter, just check the Show description option and it will give you additional description which is useful. Once everything is done, click the OK to close the dialog:
接下来,向导将询问您要记录哪些性能计数器。 只需单击“ 添加...”选项并在列表中找到它们,即可添加计数器。 例如,我们可以找到SQLServer:Access Methods ,将其展开以查找每秒完整扫描和每秒 索引搜索计数器。 您可以通过按住Shift键来选择多个计数器,然后单击“ 添加>>”按钮将其添加。 另外,如果您需要有关任何特定计数器的其他信息,只需选中“ 显示描述”选项,它将为您提供有用的附加描述。 完成所有操作后,单击“ 确定”关闭对话框:
Hit Next two times, then Finish and the wizard will create the custom data collector set:
单击“ 下一步”两次,然后单击“完成” ,向导将创建自定义数据收集器集:
Once you completed all these steps, you can right-click newly created data collector set under User Defined category, and click Start to run it or Stop to shut it down:
完成所有这些步骤后,可以右键单击“ 用户定义”类别下的新创建的数据收集器集,然后单击“ 开始”以运行它或“ 停止”以将其关闭:
I’ve already preconfigured one for monitoring disks I/O activity in real-time. I’ve also started it and let it collect data for a while to collect data. This can be seen under Reports folder, User Defined category:
我已经预先配置了一个用于实时监视磁盘I / O活动的设备。 我也已经启动它,让它收集数据一段时间以收集数据。 这可以在“报告”文件夹的“ 用户定义”类别下看到:
Once the data has been captured for the desired period, stop the data collector set. This will create an instant report and here’s what it looks like:
在所需时间段内捕获数据后,停止数据收集器集。 这将创建一个即时报告,如下所示:
This local system that I’m using daily is configured pretty good. This is not because I’m an expert or anything, it’s simply because even though I have several SQL Server versions installed, there’s not much happening on them except for me testing them occasionally.
我每天使用的这个本地系统配置得很好。 这不是因为我是专家还是其他人,仅仅是因为即使我安装了多个SQL Server版本,除了我偶尔进行测试之外,它们上没有发生太多事情。
To toggle through different graph types, use the change graph type option to the left of the plus sign (+) or press Ctrl+G on your keyboard. It’s easy to consume this and if we look at the report everything is in the ranges where it needs to be:
要在不同的图形类型之间切换,请使用加号(+)左侧的更改图形类型选项或按键盘上的Ctrl + G。 这很容易使用,如果我们查看报表,则所有内容都在所需的范围内:
As we stated before, the idle time is good and if you remember value below 50% is bad anything above is good, over 85% is the expected value. All overall rate of reading/transferring/writing operations on the disk are below 0.010 (10ms) which is also good. This picture is as good as it gets as far as performance goes on a system, but this example is artificial on a local machine where almost nothing is happening. So, I’m going to fire up a simulation utility that can be used to perform reliability and integrity tests on the disk subsystem. This is another great SQL Server monitoring tool that is shipped within SQL Server. It’s called SQLIOSim and it basically simulates read, write, checkpoint, backup, sort, and read-ahead activities for SQL Server.
如前所述,空闲时间是好的,如果您记住低于50%的值是不好的,那么高于该值的任何东西都是好的,那么预期值将超过85%。 磁盘上所有读取/传输/写入操作的总体速率都低于0.010(10ms),这也不错。 这张图片尽其所能地达到了系统的性能,但是此示例是在几乎什么都没有发生的本地计算机上人工制作的。 因此,我将启动一个仿真实用程序,该实用程序可用于在磁盘子系统上执行可靠性和完整性测试。 这是SQL Server附带的另一个出色SQL Server监视工具。 它称为SQLIOSim ,它基本上模拟了SQL Server的读取,写入,检查点,备份,排序和预读活动。
Before I do that, let’s start the I/O data collector set again. As mentioned above, the SQL Server monitoring tool is available right out-of-the-box. So, we just need to locate the SQLIOSIM.EXE program inside the Binn instance folder on SQL Server file system, in my case with SQL Server 2016 it’s:
在执行此操作之前,让我们再次启动I / O数据收集器集。 如上所述,SQL Server监视工具是开箱即用的。 因此,我们只需要在SQL Server文件系统上Binn实例文件夹内找到SQLIOSIM.EXE程序,就我而言使用SQL Server 2016而言,它是:
C:\Program Files\Microsoft SQL Server\MSSQL13.SQLEXPRESS\MSSQL\Binn
C:\ Program Files \ Microsoft SQL Server \ MSSQL13.SQLEXPRESS \ MSSQL \ Binn
Run this tool as administrator just so you don’t encounter any errors due to missing privileges. Once the tool is run, it will pop-up the files and configuration dialog. I’ve already preconfigured this. Basically, there’re two files on which SQL Server will read and write to. The sqliosim.ldx is our log file:
只是以管理员身份运行此工具,这样您才不会因缺少特权而遇到任何错误。 工具运行后,将弹出文件和配置对话框。 我已经对此进行了预配置。 基本上,有两个文件可供SQL Server读取和写入。 sqliosim.ldx是我们的日志文件:
And the sqliosim.mdx file is going to pretend to be our primary database data file:
sqliosim.mdx文件将伪装成我们的主要数据库数据文件:
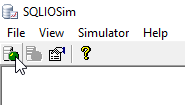
Once again, this is a great SQL Server monitoring tool for discovering what your I/O subsystem can handle. Once the configuration is done, just hit the OK to close the dialog and in the top left you’ll see a small green icon that is a start button:
再次,这是一个很棒SQL Server监视工具,用于发现I / O子系统可以处理的内容。 完成配置后,只需单击“ 确定”以关闭对话框,然后在左上角会看到一个绿色的小图标,它是开始按钮:
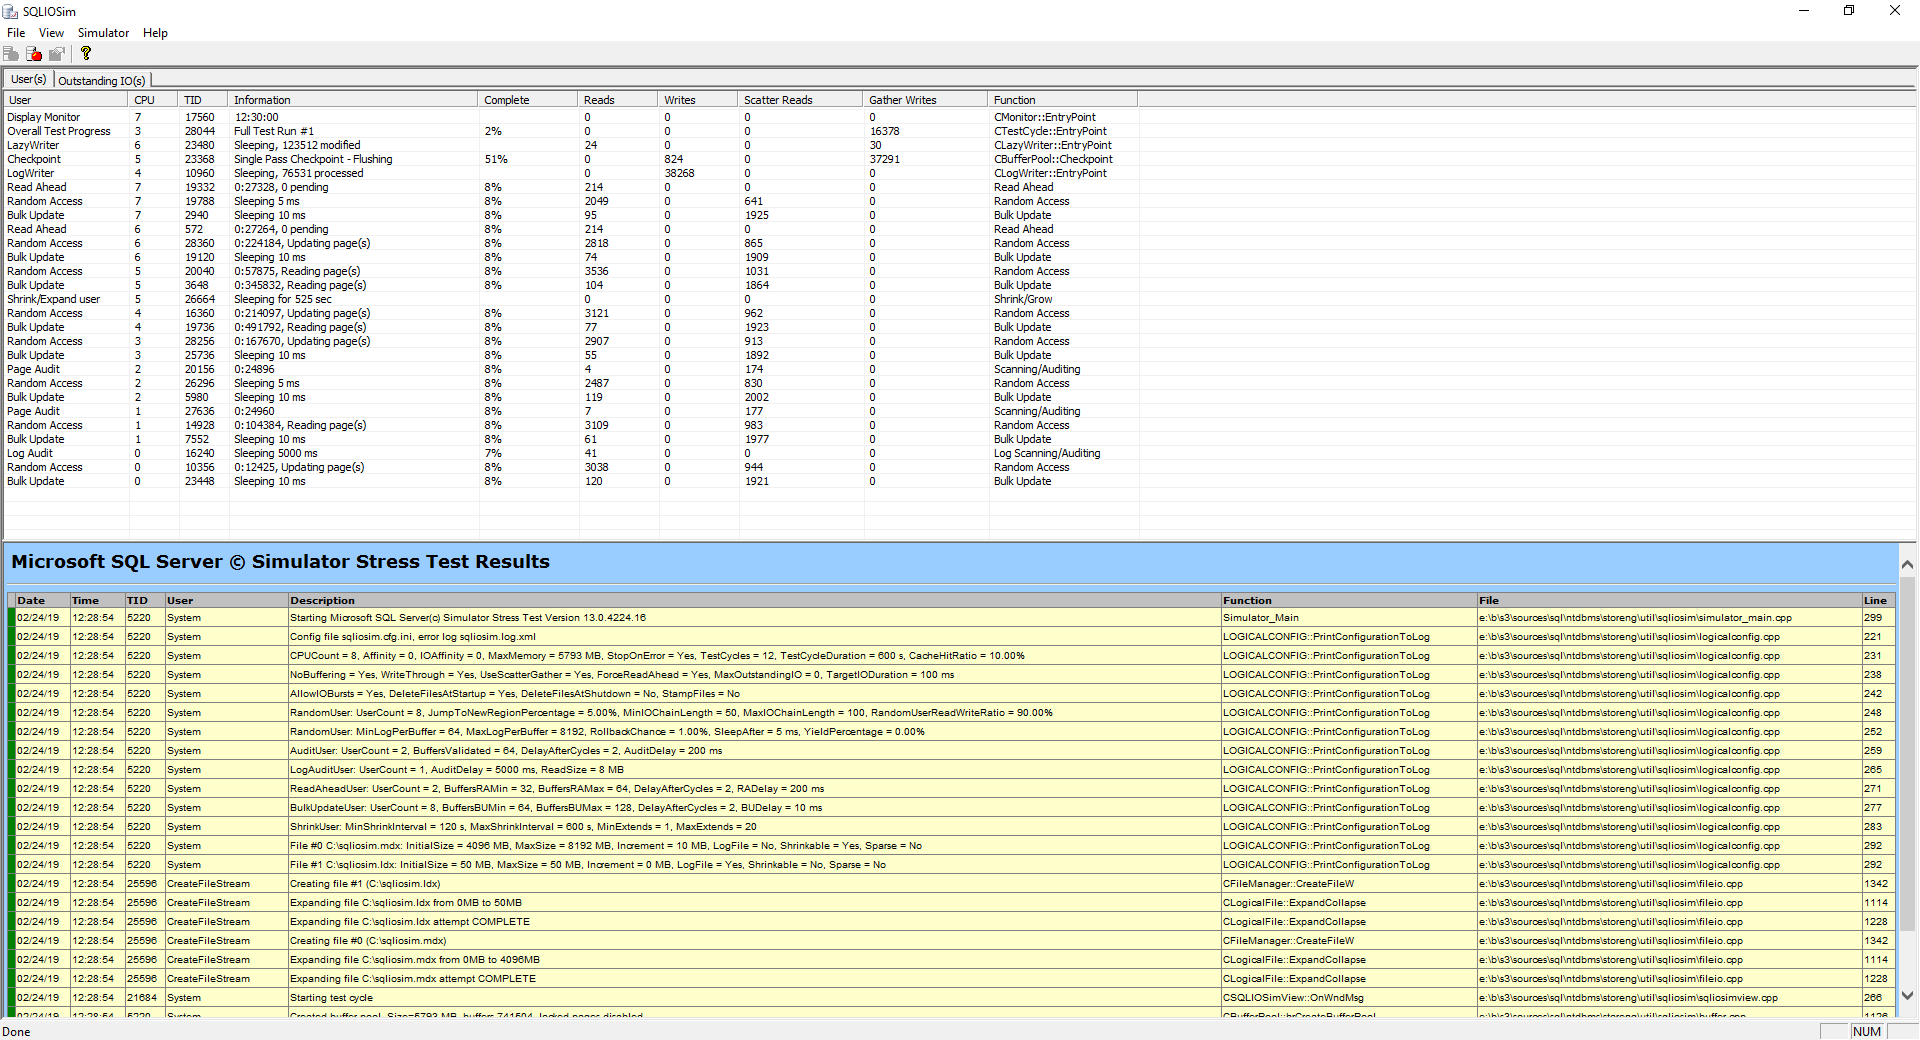
So, while this SQL Server monitoring tool simulates SQL Server activity on a disk subsystem the I/O data collector set will monitor activity in the background:
因此,尽管此SQL Server监视工具在磁盘子系统上模拟SQL Server活动,但I / O数据收集器集将在后台监视活动:
It goes without saying, don’t just run this on your production server because you might get in trouble. However, if things get crazy, you can always stop the stress test by hitting the stop icon:
不用说,不要仅仅在生产服务器上运行它,否则可能会遇到麻烦。 但是,如果事情发疯了,您总是可以通过点击“停止”图标来停止压力测试:
I’ve stopped this after about 5 minutes and here’s how the new report looks like:
大约5分钟后,我已停止了此操作,新报告如下所示:
It’s obvious that the results are much different and if we switch over to report graph type here’s what we get:
显然,结果有很大的不同,如果我们切换到报告图形类型,将得到以下结果:
The idle time is still above 50% which is acceptable. Reads are also okay, but transfers and writes are not. Now obviously the SQLIOSim utility is meant to generate a heavy load but if we are about to run this data collector set on a production environment over a day or two and we get results like this, then this would definitely be a cause for concern.
空闲时间仍高于50%,这是可以接受的。 读取也可以,但不能传输和写入。 现在,很明显,SQLIOSim实用程序旨在产生沉重的负担,但是如果我们要在一两天的时间内在生产环境中运行此数据收集器集,并且得到这样的结果,那么这肯定会引起关注。
The bottom line here is that those counters are great for an indication of how your I/O disk subsystems perform.
最重要的是,这些计数器非常适合指示I / O磁盘子系统的性能。
I highly suggest taking a look at another article written about the most important disk performance metrics as it describes the counters we have been using through this article in details: SQL Server disk performance metrics – Part 1 – the most important disk performance metrics
我强烈建议您看一下另一篇有关最重要的磁盘性能指标的文章,因为它详细描述了我们在本文中一直使用的计数器: SQL Server磁盘性能指标–第1部分–最重要的磁盘性能指标
I haven’t even touched common performance issues other than I/O, and this turned out to be a long article. Therefore, I’m going to draw a line here, and we will continue the SQL Server monitoring tools story in another article in which we will go through the rest of the list and talk about memory pressures.
除了I / O之外,我什至没有触及过常见的性能问题,而且这篇文章篇幅很长。 因此,我将在这里划清界限,我们将在另一篇文章中继续SQL Server监视工具的故事,在该文章中,我们将浏览列表的其余部分并讨论内存压力。
目录 (Table of contents)
| SQL Server monitoring tools for disk I/O performance |
| SQL Server monitoring tools for memory performance |
| SQL Server monitoring tool for CPU performance |
| 用于磁盘I / O性能SQL Server监视工具 |
| SQL Server内存性能监视工具 |
| 用于CPU性能SQL Server监视工具 |
翻译自: https://www.sqlshack.com/sql-server-monitoring-tools-for-disk-i-o-performance/
用于磁盘I / O性能SQL Server监视工具相关推荐
- 用于CPU性能SQL Server监视工具
CPU压力降低了服务器速度 (CPU pressure slowing down the server) This article is the sequel in a series about SQ ...
- 官方正版 Devart dbForge Studio for SQL Server 数据库管理工具 - 正版软件商城 - 软购商城
dbForge Studio for SQL Server 是一个功能强大的 IDE,可用于 Microsoft SQL Server 管理,管理,开发,数据报告,分析等等. SQL 开发人员和执行复 ...
- sql server 监视_使用动态管理对象监视SQL Server –会话和连接
sql server 监视 A fundamental task of Database Administrators is monitoring SQL Server performance. Wh ...
- sql server 监视_如何在SQL Server中监视对象空间增长
sql server 监视 介绍 (Introduction) There are many situations in a DBA's life that lead him or her to mo ...
- sql server 监视_使用动态管理对象监视SQL Server –请求
sql server 监视 In my last post, Monitoring SQL Server with dynamic management objects – Sessions and ...
- sql server 监视_监视SQL Server报告服务
sql server 监视 介绍 ( Introduction ) In our last get together I mentioned that oft times SQL Server rep ...
- sql server 监视_使用SQL Server Reporting Services进行快速,肮脏的服务器监视
sql server 监视 介绍 (Introduction) A few month back, I found myself in a position where the client want ...
- SQL Server自动化运维系列——监控磁盘剩余空间及SQL Server错误日志(Power Shell)...
原文:SQL Server自动化运维系列--监控磁盘剩余空间及SQL Server错误日志(Power Shell) 需求描述 在我们的生产环境中,大部分情况下需要有自己的运维体制,包括自己健康状态的 ...
- ssdt_用于商业智能开发SQL Server数据工具(SSDT)的演变
ssdt By all accounts, the introduction of SQL Server Data Tools (SSDT) in SQL Server 2012 was a wate ...
最新文章
- 前后端分离后的前端时代
- Mysql使用kill命令解决死锁问题(杀死某条正在执行的sql语句)
- 第一章 代码无错就是优吗?(简单工厂模式)
- mysql用户 11_MySQL-快速入门(11)用户管理
- Cesium多屏展示
- 【编译原理笔记12】中间代码生成:简单赋值语句的翻译,数组引用的翻译
- oracle数据库tx锁,oracle数据库有把TX锁,如何定位锁在哪?
- 黑马旅游网完整代码_黑马旅游网(二)注册登陆
- IOS VFL语言(页面布局)
- 基于netty构建http服务器
- turbo编译码c语言,Turbo码的编译码基本原理和常用编译码算法分析及仿真程序
- Linux下压缩mp3文件
- Adobe reader 添加注释后,点击保存,强制要求另存为
- Insyde uefi 隐藏设置_固件级安全,微软安全工具新增UEFI扫描功能
- 帮嫦娥五号登月的AI还能用来玩游戏,20行Python代码带你领略强化学习的风采
- 2017年杭州市大学生自主创业政策
- 科目二考试技巧全总结
- word size计算机,计算机基础结构 - 扣丁书屋 - https://www.codingsky.com
- ***的实践总结经验
- 机顶盒宽带拨号失败服务器未响应,机顶盒详细错误代码.doc