基于prometheus + grafana + mysql + Telegram 监控告警
2019独角兽企业重金招聘Python工程师标准>>> 
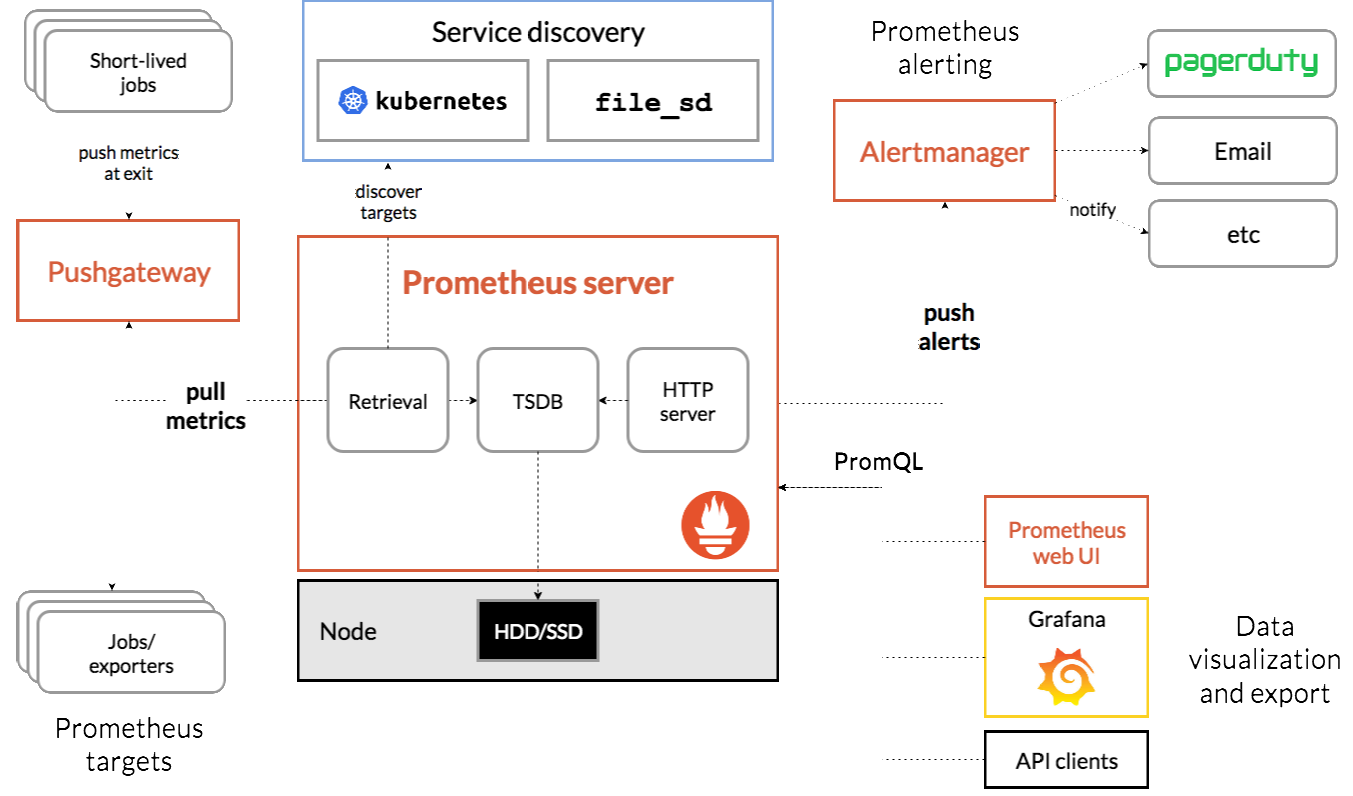
Prometheus是什么
Prometheus(普罗米修斯)非常酷的开源监控系统。它支持多维度的指标数据模型,服务端通过HTTP协议定时拉取数据后,通过灵活的查询语言,实现监控的目的。
客户端记录相关指标数据,对外提供查询接口。Prometheus服务端通过服务器发现机制找到客户端,并定时抓取存储为时间序列数据。最后通过Grafana等图表工具集成展示。
Prometheus可以做什么
在业务层用作埋点系统
Prometheus支持各个主流开发语言(Go,java,python,ruby官方提供客户端,其他语言有第三方开源客户端)。我们可以通过客户端方面的对核心业务进行埋点。如下单流程、添加购物车流程。在应用层用作应用监控系统
一些主流应用可以通过官方或第三方的导出器,来对这些应用做核心指标的收集。如redis,mysql。在系统层用作系统监控
除了常用软件, prometheus也有相关系统层和网络层exporter,用以监控服务器或网络。集成其他的监控
prometheus还可以通过各种exporte,集成其他的监控系统,收集监控数据,如AWS CloudWatch,JMX,Pingdom等等。
开始安装 prometheus
1 下载
https://prometheus.io/download/2 解压安装
tar xf prometheus-2.8.0.linux-amd64.tar.gzmv prometheus-2.8.0.linux-amd64 /usr/local/prometheuscd /usr/local/prometheus./prometheus --version
3 启动
./prometheusnode节点安装agent
1 下载
https://prometheus.io/download/#node_exporter2 安装 agent
tar xf node_exporter-0.17.0.linux-amd64.tar.gz
cd node_exporter-0.17.0.linux-amd64
3 启动agent
./node_exporter向prometheus 注册节点
1 编辑配置文件
cd /usr/local/prometheus# cat prometheus.yml
# my global config
global:scrape_interval:     15s # Set the scrape interval to every 15 seconds. Default is every 1 minute.evaluation_interval: 15s # Evaluate rules every 15 seconds. The default is every 1 minute.# scrape_timeout is set to the global default (10s).# Alertmanager configuration
alerting:alertmanagers:- static_configs:- targets:# - alertmanager:9093# Load rules once and periodically evaluate them according to the global 'evaluation_interval'.
rule_files:# - "first_rules.yml"# - "second_rules.yml"# A scrape configuration containing exactly one endpoint to scrape:
# Here it's Prometheus itself.
scrape_configs:# The job name is added as a label `job=<job_name>` to any timeseries scraped from this config.- job_name: 'prometheus'# metrics_path defaults to '/metrics'# scheme defaults to 'http'.static_configs:- targets: ['localhost:9090']- job_name: 'linux-node'          #添加一个jobstatic_configs:- targets: ['10.10.25.151:9100']     配置被监控的节点IPlabels: instance: node1服务端监听 9090端口  prometheus web页面 http://ServerIP:9090
客户端监听 9100端口
2 重新启动 prometheus
./prometheus3 访问web页面
http://10.10.25.110:9090
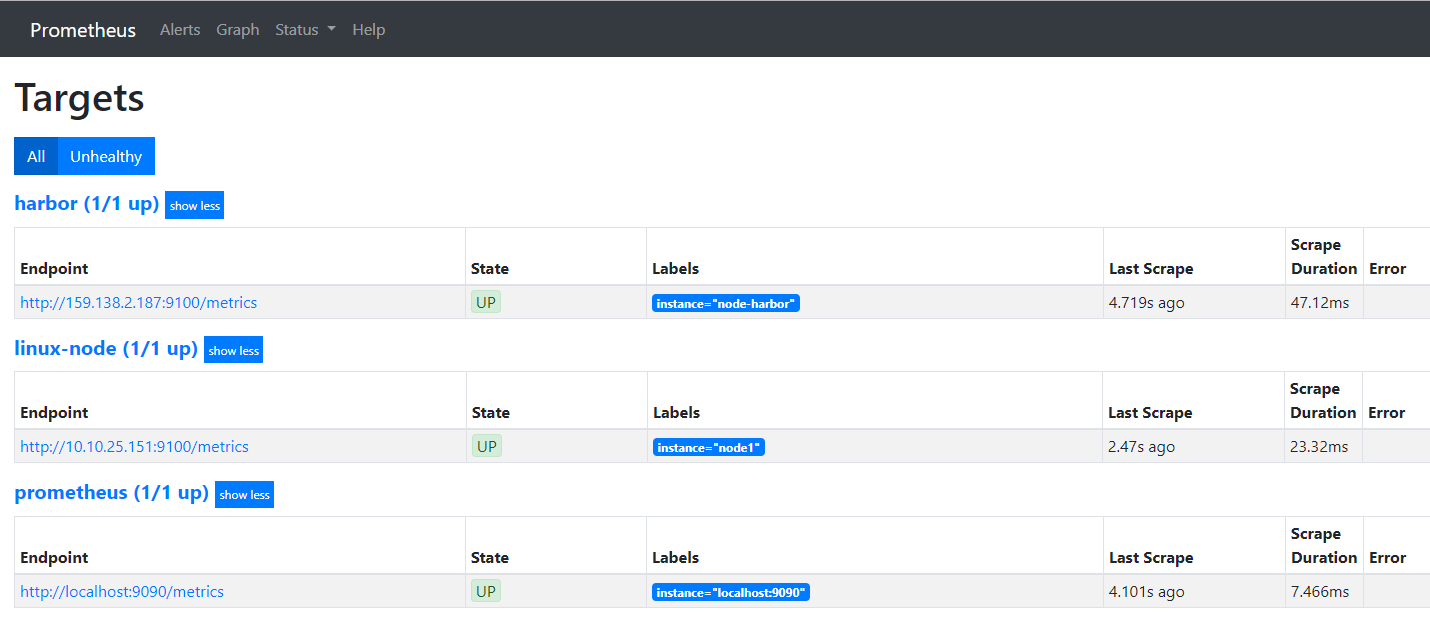
4 查看节点是否注册
选择 Status 里面的 Target可以看到我们已经注册的节点
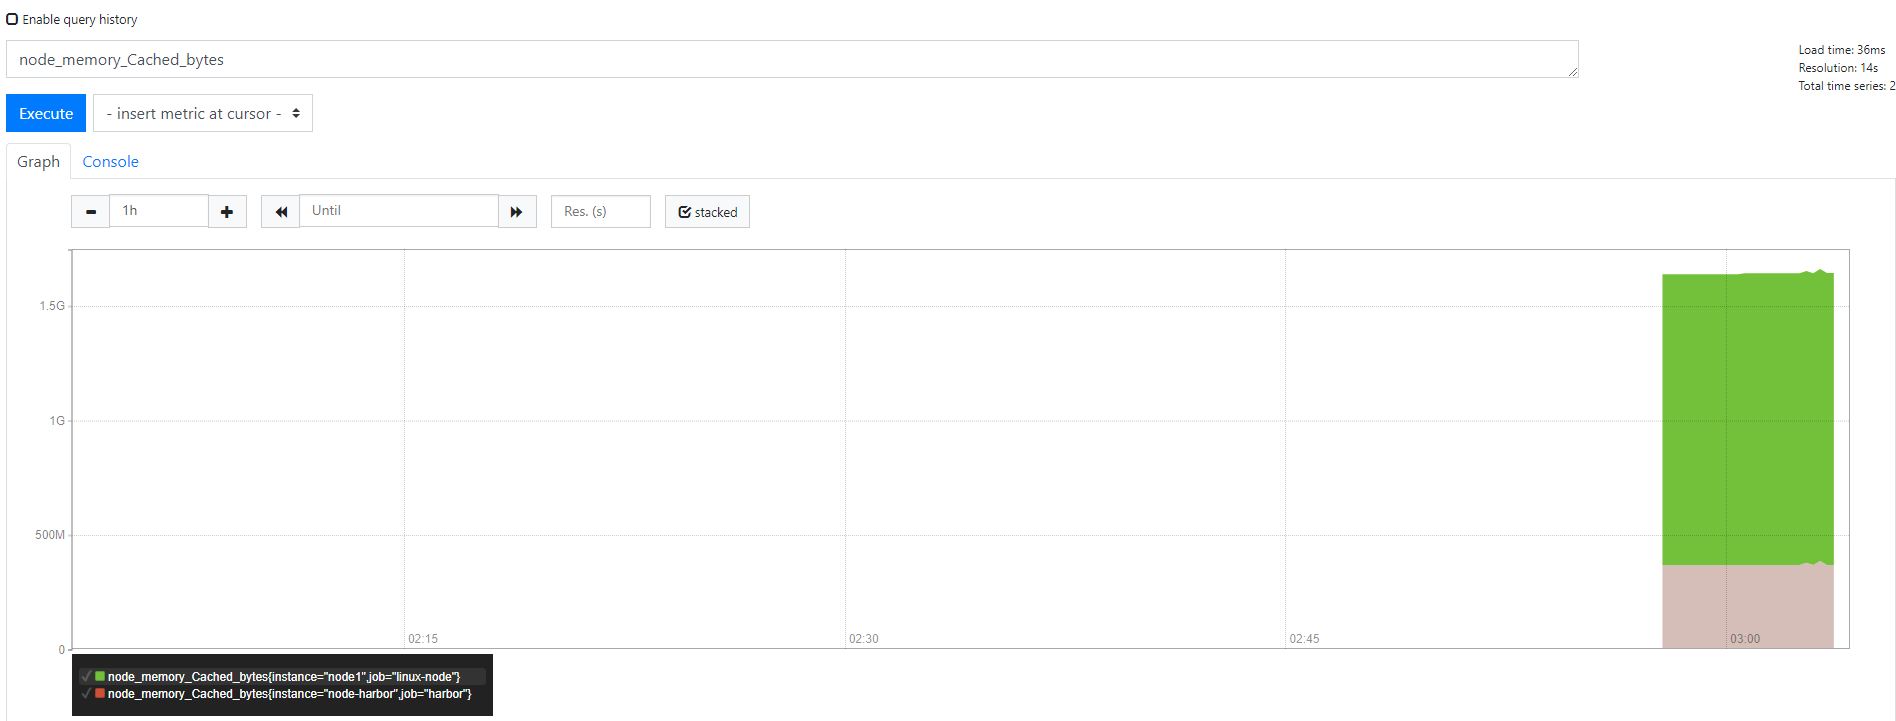
5 简单查看我们的监控指标
以内存剩余量为例在输入框输入 node_memory_Cached_bytes
什么是grafana
grafana 是一个开源的时序性统计和监控平台,支持例如 elasticsearch、graphite、influxdb 等众多的数据源,并以功能强大的界面编辑器著称。
安装grafana
1 下载
wget https://dl.grafana.com/oss/release/grafana-6.0.2-1.x86_64.rpm2 安装
yum install  grafana-6.0.2-1.x86_64.rpm
systemctl start grafana-server
systemctl enable grafana-server
grafana-server -v grafana-server 监听端口为 3000
3 访问 grafana-server
http://ServerIP:3000
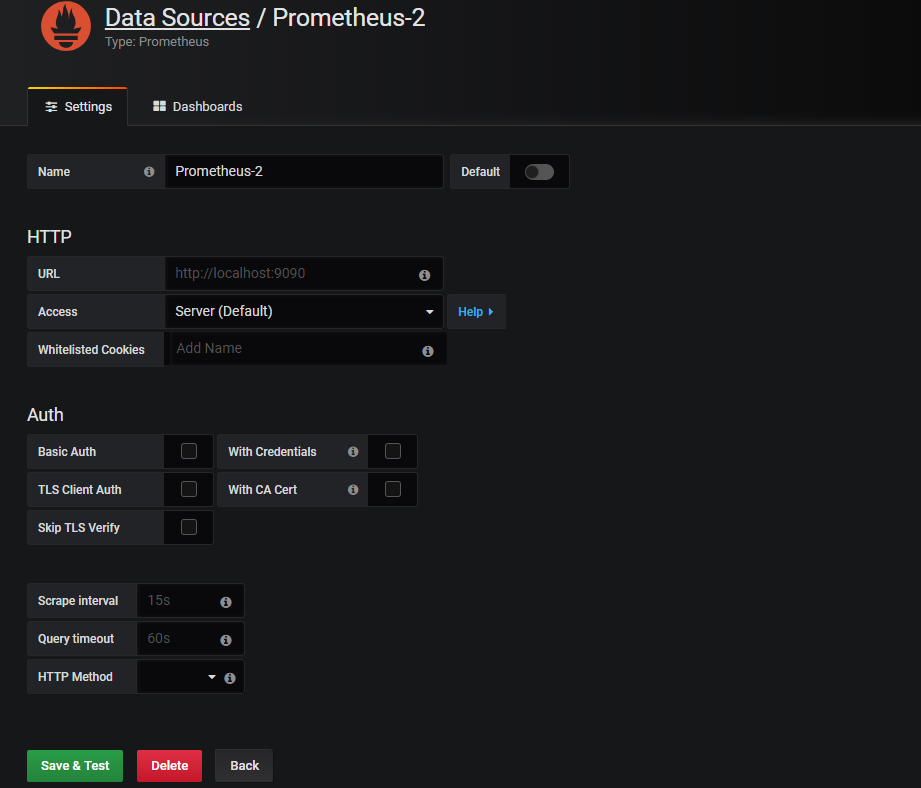
默认用户名密码为: admin admin4 添加数据源选择 Prometheus
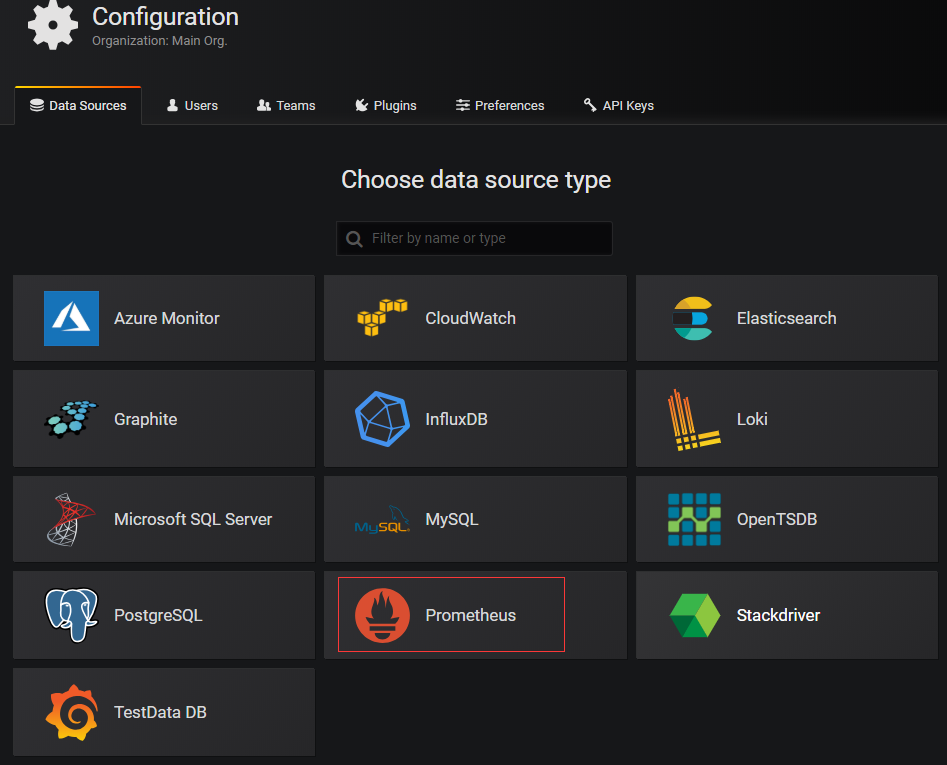
设置数据源的server地址和监听端口并保存推出
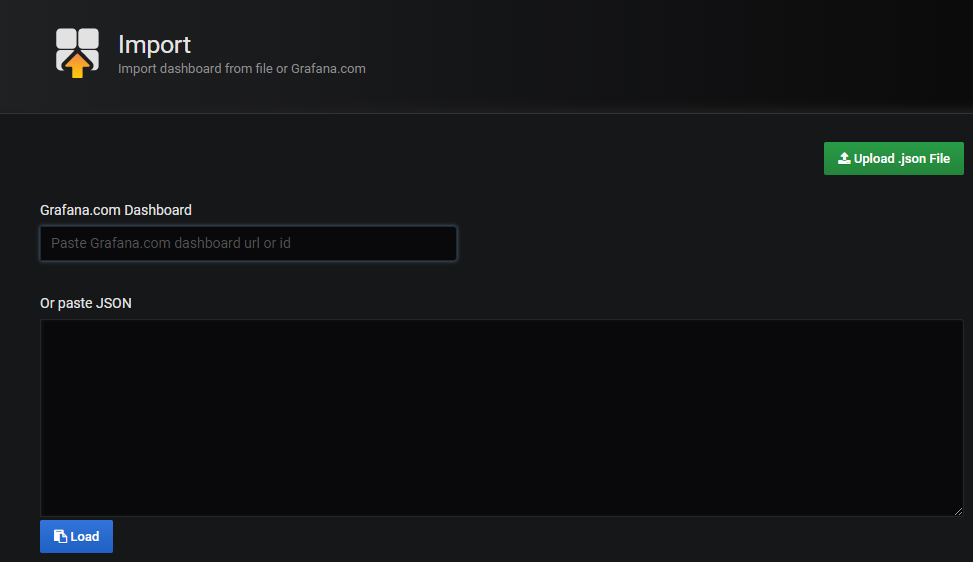
5 添加Dashboard 也就是给节点添加可视化页面
点击‘ + ’ 选择Import 输入模板ID 8919
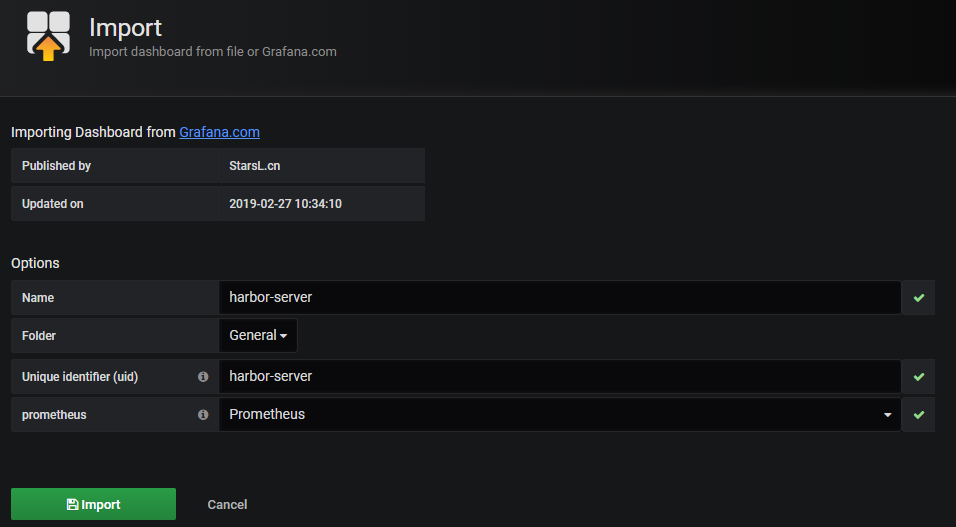
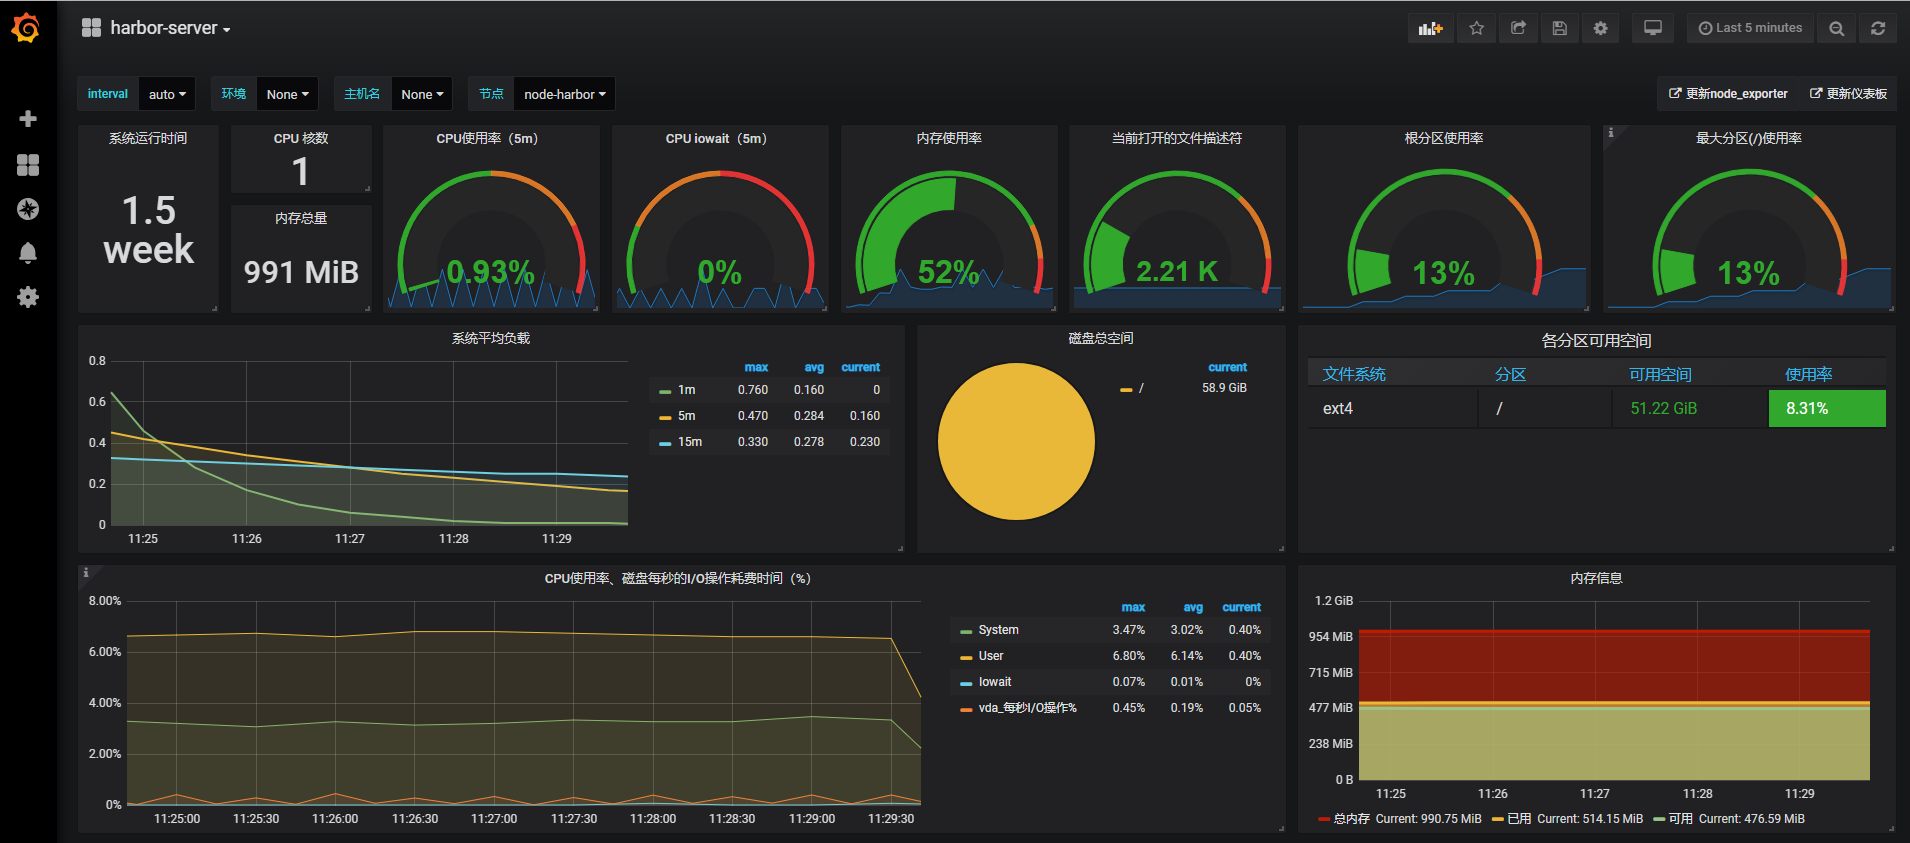
设置模板名称,uid 数据源 保存即可看到监控页面
注意 如果你是新的server会发现饼状图的数据加载不出,这个说明的是饼状图插件没有安装
6 安装饼状图插件
grafana-cli plugins install grafana-piechart-panel
systemctl  restart grafana-server
安装mysql作为grafana 源
1 添加源
rpm -Uvh http://dev.mysql.com/get/mysql-community-release-el7-5.noarch.rpmyum repolist enabled | grep "mysql.*-community.*"2 安装 mysql-5.6
yum -y install mysql-community-server3 启动mysql并简单安全设置
systemctl enable mysqld
systemctl start mysqld
systemctl status mysqldmysql_secure_installation 设置密码一路Y
4 创建grafana 数据库
create database grafana;
create user grafana@'%' IDENTIFIED by 'grafana';
grant all on grafana.* to grafana@'%';
flush privileges;
5 修改配置文件连接mysql
vim /etc/grafana/grafana.ini[database]
type = mysql
host = 127.0.0.1:3306
name = grafana
user = grafana
password =grafana
url = mysql://grafana:grafana@localhost:3306/grafana[session]
provider = mysql
provider_config = `grafana:grafana@tcp(127.0.0.1:3306)/grafana`systemctl restart grafana-server
6 重复grafana安装配置即可
HAproxy指标导出器的安装
1 进入opt目录下载HAproxy节点指标导出器:
wget https://github.com/prometheus/haproxy_exporter/releases/download/v0.9.0/haproxy_exporter-0.9.0.linux-amd64.tar.gz2 解压HAproxy节点指标导出器并删除压缩包:
tar -xvf haproxy_exporter-0.9.0.linux-amd64.tar.gz && rm haproxy_exporter-0.9.0.linux-amd64.tar.gz3 修改文件夹名称
mv haproxy_exporter-0.9.0.linux-amd64/ haproxy_exporter4 追加HAproxy配置文件:
cat << EOF >> /etc/haproxy/haproxy.cfg
listen statsmode httpbind 0.0.0.0:5000stats enablestats hide-versionstats uri /statsstats realm Haproxy\ Statisticsstats auth admin:admin123stats admin if TRUE #启用管理功能
EOF
5 重启HAproxy:
/etc/init.d/haproxy reload6 进入对应文件夹后后台运行导出器程序:
nohup ./haproxy_exporter --haproxy.scrape-uri="http://admin:admin123@localhost:5000/stats;csv" 2>&1 &7 查看9100端口是否正常运行:
netstat -lntpWindows节点指标导出器的安装
1 下载Windows节点指标导出器:
https://github.com/martinlindhe/wmi_exporter/releases/download/v0.5.0/wmi_exporter-0.5.0-amd64.msi2 打开Prowershell执行一下命令,注意程序所在路径是否正确
msiexec /i C:\Users\Administrator\Downloads\wmi_exporter-0.5.0-amd64.msi ENABLED_COLLECTORS=iis,os,cpu,cs,memory,mssql,netframework_clrjit,netframework_clrinterop,netframework_clrexceptions,netframework_clrloading,netframework_clrlocksandthreads,netframework_clrmemory,net,service,system,tcp,textfile LISTEN_PORT=9182配置grafana + Telegram 告警
1.对接Telegram官方接口@BotFather

2.输入/newbot命令创建你自己的机器人
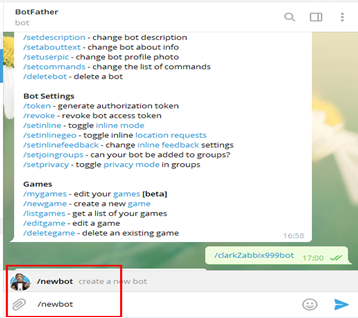
3.然后根据提示输入机器人的名称和用户名,用户名必须以bot结尾
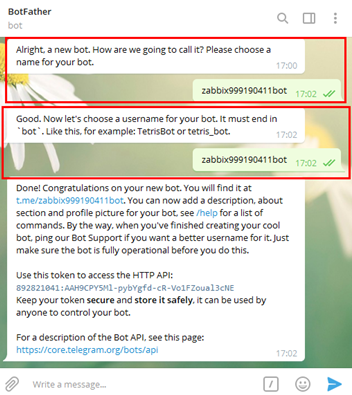
4.这样机器人就创建完成了,返回信息当中的token必须保存好备用
Done! Congratulations on your new bot. You will find it at t.me/zabbix999190411bot. You can now add a description, about section and profile picture for your bot, see /help for a list of commands. By the way, when you've finished creating your cool bot, ping our Bot Support if you want a better username for it. Just make sure the bot is fully operational before you do this.Use this token to access the HTTP API:
892821041:AAH9CPY5Ml-pybYgfd-cR-Vo1FZoual3cNE
Keep your token secure and store it safely, it can be used by anyone to control your bot.For a description of the Bot API, see this page: https://core.telegram.org/bots/api
5.接下来使用API/bottoken/API方法getMe获取自己的id
root@alex prometheus-2.8.1.linux-amd64]# curl https://api.telegram.org/bot892821041:AAH9CPY5Ml-pybYgfd-cR-Vo1FZoual3cNE/getMe
{"ok":true,"result":{"id":892821041,"is_bot":true,"first_name":"zabbix999190411bot","username":"zabbix999190411bot"}}

6.获取群ID
在Telegram新建group,然后添加成员刚创建的机器人,调用API方法getUPdates获取群ID
https://api.telegram.org/bot892821041:AAH9CPY5Ml-pybYgfd-cR-Vo1FZoual3cNE/getUpdates
{"ok":true,"result":[{"update_id":434572998,
"message":{"message_id":5,"from":{"id":787933444,"is_bot":false,"first_name":"Alex","last_name":"Liu","language_code":"zh-hans"},"chat":{"id":-234667255,
"title":"ZABBIX999","type":"group","all_members_are_administrators":true},"date":1554977987,"text":"/getMe","entities":[{"offset":0,"length":6,"type":"bot_command"}]}}]}
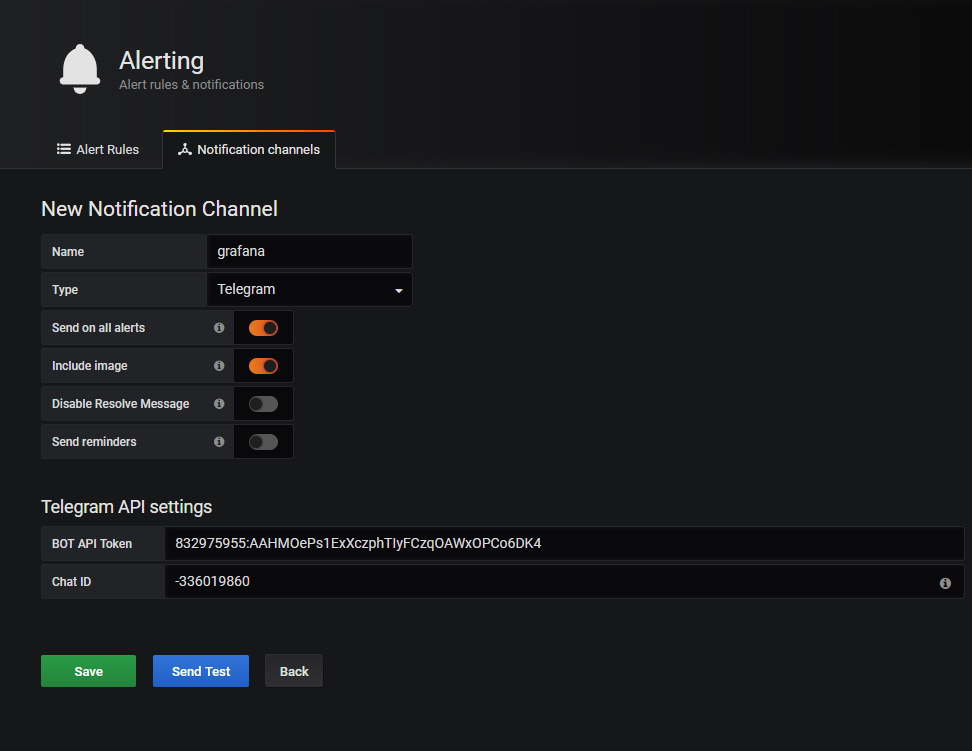
7 配置 grafana Alerting
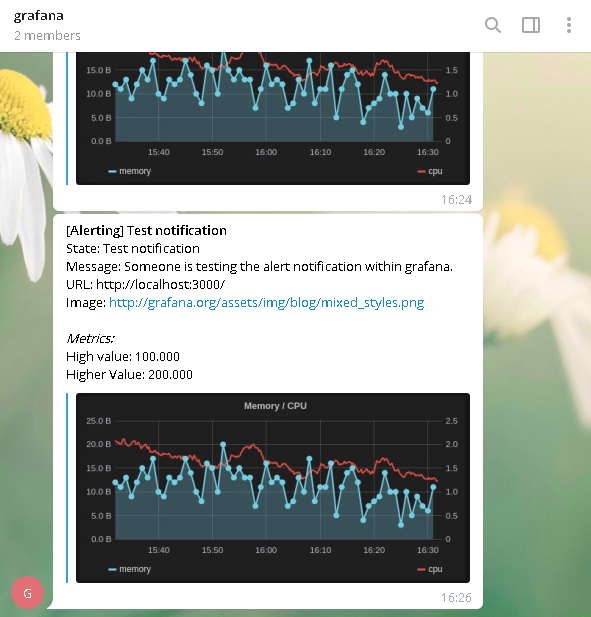
配置完成后 点击send test 测试
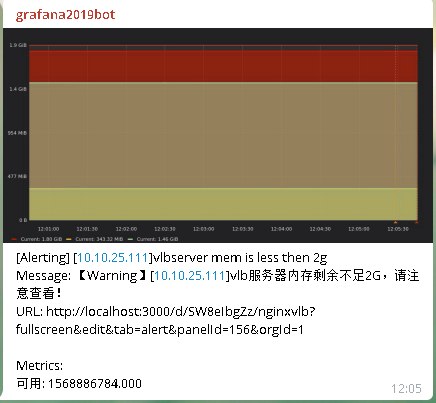
收到的测试告警
如果使用微信配置是相同的,只需要获取企业账号的相关ID即可
8 测试服务器报警
测试服务器告警以真实服务器为例,测试内存数据告警
查看正式服务器内存
[root@lb-1 ~]# free -mtotal        used        free      shared  buff/cache   available
Mem:           1839         176        1382           8         281        1494
Swap:          2047           0        2047
添加魔板 8919 这里的配置不做赘述以上面已经讲过
接下来修改模板添加告警json,打开模板设置修改 json
修改json增加告警需要增加段json 块,必须要注意的是配置wean告警必须要替换里面的变量 $node 为prometheus里面配置文件相应的instance标签的名字否则不能告警.
{"annotations": {"list": [{"builtIn": 1,"datasource": "-- Grafana --","enable": true,"hide": true,"iconColor": "rgba(0, 211, 255, 1)","name": "Annotations & Alerts","type": "dashboard"}]},"description": "使用 Node Exporter v0.16 0.17,精简优化重要指标展示。包含:CPU 内存 磁盘 IO 网络 温度等监控指标。https://github.com/starsliao/Prometheus","editable": true,"gnetId": 8919,"graphTooltip": 0,"id": 11,"iteration": 1555301097807,"links": [{"icon": "external link","tags": [],"targetBlank": true,"title": "更新node_exporter","tooltip": "","type": "link","url": "https://github.com/prometheus/node_exporter/releases"},{"icon": "external link","tags": [],"targetBlank": true,"title": "更新仪表板","tooltip": "","type": "link","url": "https://grafana.com/dashboards/8919"}],"panels": [{"content": "","editable": true,"error": false,"gridPos": {"h": 1,"w": 24,"x": 0,"y": 0},"id": 11,"links": [],"maxPerRow": 6,"mode": "html","repeat": "node","repeatDirection": "h","scopedVars": {"node": {"selected": true,"text": "nginxvlb","value": "nginxvlb"}},"style": {},"title": "nginxvlb","type": "text"},{"cacheTimeout": null,"colorBackground": false,"colorValue": false,"colors": ["rgba(245, 54, 54, 0.9)","rgba(237, 129, 40, 0.89)","rgba(50, 172, 45, 0.97)"],"datasource": "Prometheus","decimals": 1,"description": "","format": "s","gauge": {"maxValue": 100,"minValue": 0,"show": false,"thresholdLabels": false,"thresholdMarkers": true},"gridPos": {"h": 5,"w": 2,"x": 0,"y": 1},"hideTimeOverride": true,"id": 15,"interval": null,"links": [],"mappingType": 1,"mappingTypes": [{"name": "value to text","value": 1},{"name": "range to text","value": 2}],"maxDataPoints": 100,"nullPointMode": "null","nullText": null,"postfix": "","postfixFontSize": "50%","prefix": "","prefixFontSize": "50%","rangeMaps": [{"from": "null","text": "N/A","to": "null"}],"sparkline": {"fillColor": "rgba(31, 118, 189, 0.18)","full": false,"lineColor": "rgb(31, 120, 193)","show": false},"tableColumn": "","targets": [{"expr": "time() - node_boot_time_seconds{instance=~\"nginxvlb\"}","format": "time_series","hide": false,"instant": true,"intervalFactor": 2,"refId": "A","step": 40}],"thresholds": "","title": "系统运行时间","type": "singlestat","valueFontSize": "100%","valueMaps": [{"op": "=","text": "N/A","value": "null"}],"valueName": "current"},{"cacheTimeout": null,"colorBackground": false,"colorValue": false,"colors": ["rgba(245, 54, 54, 0.9)","rgba(237, 129, 40, 0.89)","rgba(50, 172, 45, 0.97)"],"datasource": "Prometheus","description": "","format": "short","gauge": {"maxValue": 100,"minValue": 0,"show": false,"thresholdLabels": false,"thresholdMarkers": true},"gridPos": {"h": 2,"w": 2,"x": 2,"y": 1},"id": 14,"interval": null,"links": [],"mappingType": 1,"mappingTypes": [{"name": "value to text","value": 1},{"name": "range to text","value": 2}],"maxDataPoints": 100,"maxPerRow": 6,"nullPointMode": "null","nullText": null,"postfix": "","postfixFontSize": "50%","prefix": "","prefixFontSize": "50%","rangeMaps": [{"from": "null","text": "N/A","to": "null"}],"sparkline": {"fillColor": "rgba(31, 118, 189, 0.18)","full": false,"lineColor": "rgb(31, 120, 193)","show": false},"tableColumn": "","targets": [{"expr": "count(count(node_cpu_seconds_total{instance=~\"nginxvlb\", mode='system'}) by (cpu))","format": "time_series","instant": true,"intervalFactor": 1,"legendFormat": "","refId": "A","step": 20}],"thresholds": "","title": "CPU 核数","type": "singlestat","valueFontSize": "100%","valueMaps": [{"op": "=","text": "N/A","value": "null"}],"valueName": "current"},{"cacheTimeout": null,"colorBackground": false,"colorValue": true,"colors": ["rgba(50, 172, 45, 0.97)","rgba(237, 129, 40, 0.89)","rgba(245, 54, 54, 0.9)"],"datasource": "Prometheus","decimals": 2,"description": "","format": "percent","gauge": {"maxValue": 100,"minValue": 0,"show": true,"thresholdLabels": false,"thresholdMarkers": true},"gridPos": {"h": 5,"w": 3,"x": 4,"y": 1},"id": 167,"interval": null,"links": [],"mappingType": 1,"mappingTypes": [{"name": "value to text","value": 1},{"name": "range to text","value": 2}],"maxDataPoints": 100,"maxPerRow": 12,"nullPointMode": "null","nullText": null,"postfix": "","postfixFontSize": "50%","prefix": "","prefixFontSize": "50%","rangeMaps": [{"from": "null","text": "N/A","to": "null"}],"sparkline": {"fillColor": "rgba(31, 118, 189, 0.18)","full": false,"lineColor": "rgb(31, 120, 193)","show": true},"tableColumn": "","targets": [{"expr": "100 - (avg(irate(node_cpu_seconds_total{instance=~\"nginxvlb\",mode=\"idle\"}[5m])) * 100)","format": "time_series","hide": false,"interval": "","intervalFactor": 1,"legendFormat": "","refId": "A","step": 20}],"thresholds": "50,80","title": "CPU使用率(5m)","type": "singlestat","valueFontSize": "80%","valueMaps": [{"op": "=","text": "N/A","value": "null"}],"valueName": "current"},{"cacheTimeout": null,"colorBackground": false,"colorValue": true,"colors": ["rgba(50, 172, 45, 0.97)","rgba(237, 129, 40, 0.89)","rgba(245, 54, 54, 0.9)"],"datasource": "Prometheus","decimals": 2,"description": "","format": "percent","gauge": {"maxValue": 100,"minValue": 0,"show": true,"thresholdLabels": false,"thresholdMarkers": true},"gridPos": {"h": 5,"w": 3,"x": 7,"y": 1},"id": 20,"interval": null,"links": [],"mappingType": 1,"mappingTypes": [{"name": "value to text","value": 1},{"name": "range to text","value": 2}],"maxDataPoints": 100,"maxPerRow": 12,"nullPointMode": "null","nullText": null,"postfix": "","postfixFontSize": "50%","prefix": "","prefixFontSize": "50%","rangeMaps": [{"from": "null","text": "N/A","to": "null"}],"sparkline": {"fillColor": "rgba(31, 118, 189, 0.18)","full": false,"lineColor": "rgb(31, 120, 193)","show": true},"tableColumn": "","targets": [{"expr": "avg(irate(node_cpu_seconds_total{instance=~\"nginxvlb\",mode=\"iowait\"}[5m])) * 100","format": "time_series","hide": false,"interval": "","intervalFactor": 1,"legendFormat": "","refId": "A","step": 20}],"thresholds": "20,50","title": "CPU iowait(5m)","type": "singlestat","valueFontSize": "80%","valueMaps": [{"op": "=","text": "N/A","value": "null"}],"valueName": "current"},{"cacheTimeout": null,"colorBackground": false,"colorValue": true,"colors": ["rgba(50, 172, 45, 0.97)","rgba(237, 129, 40, 0.89)","rgba(245, 54, 54, 0.9)"],"datasource": "Prometheus","decimals": 0,"description": "","format": "percent","gauge": {"maxValue": 100,"minValue": 0,"show": true,"thresholdLabels": false,"thresholdMarkers": true},"gridPos": {"h": 5,"w": 3,"x": 10,"y": 1},"hideTimeOverride": false,"id": 172,"interval": null,"links": [],"mappingType": 1,"mappingTypes": [{"name": "value to text","value": 1},{"name": "range to text","value": 2}],"maxDataPoints": 100,"maxPerRow": 6,"nullPointMode": "null","nullText": null,"postfix": "","postfixFontSize": "50%","prefix": "","prefixFontSize": "50%","rangeMaps": [{"from": "null","text": "N/A","to": "null"}],"sparkline": {"fillColor": "rgba(31, 118, 189, 0.18)","full": false,"lineColor": "rgb(31, 120, 193)","show": true},"tableColumn": "","targets": [{"expr": "(1 - (node_memory_MemAvailable_bytes{instance=~\"nginxvlb\"} / (node_memory_MemTotal_bytes{instance=~\"nginxvlb\"})))* 100","format": "time_series","hide": false,"interval": "10s","intervalFactor": 1,"refId": "A","step": 20}],"thresholds": "80,90","title": "内存使用率","type": "singlestat","valueFontSize": "80%","valueMaps": [],"valueName": "current"},{"cacheTimeout": null,"colorBackground": false,"colorPostfix": false,"colorPrefix": false,"colorValue": true,"colors": ["rgba(50, 172, 45, 0.97)","rgba(237, 129, 40, 0.89)","rgba(245, 54, 54, 0.9)"],"datasource": "Prometheus","decimals": 2,"description": "","format": "short","gauge": {"maxValue": 10000,"minValue": null,"show": true,"thresholdLabels": false,"thresholdMarkers": true},"gridPos": {"h": 5,"w": 3,"x": 13,"y": 1},"hideTimeOverride": false,"id": 16,"interval": null,"links": [],"mappingType": 1,"mappingTypes": [{"name": "value to text","value": 1},{"name": "range to text","value": 2}],"maxDataPoints": 100,"maxPerRow": 6,"nullPointMode": "null","nullText": null,"postfix": "","postfixFontSize": "50%","prefix": "","prefixFontSize": "50%","rangeMaps": [{"from": "null","text": "N/A","to": "null"}],"sparkline": {"fillColor": "rgba(31, 118, 189, 0.18)","full": false,"lineColor": "rgb(31, 120, 193)","show": true},"tableColumn": "","targets": [{"expr": "node_filefd_allocated{instance=~\"nginxvlb\"}","format": "time_series","instant": false,"interval": "10s","intervalFactor": 1,"refId": "B"}],"thresholds": "7000,9000","title": "当前打开的文件描述符","type": "singlestat","valueFontSize": "70%","valueMaps": [],"valueName": "current"},{"cacheTimeout": null,"colorBackground": false,"colorValue": true,"colors": ["rgba(50, 172, 45, 0.97)","rgba(237, 129, 40, 0.89)","rgba(245, 54, 54, 0.9)"],"datasource": "Prometheus","decimals": null,"description": "","format": "percent","gauge": {"maxValue": 100,"minValue": 0,"show": true,"thresholdLabels": false,"thresholdMarkers": true},"gridPos": {"h": 5,"w": 4,"x": 16,"y": 1},"id": 166,"interval": null,"links": [],"mappingType": 1,"mappingTypes": [{"name": "value to text","value": 1},{"name": "range to text","value": 2}],"maxDataPoints": 100,"maxPerRow": 6,"nullPointMode": "null","nullText": null,"postfix": "","postfixFontSize": "50%","prefix": "","prefixFontSize": "50%","rangeMaps": [{"from": "null","text": "N/A","to": "null"}],"repeatDirection": "h","sparkline": {"fillColor": "rgba(31, 118, 189, 0.18)","full": false,"lineColor": "rgb(31, 120, 193)","show": true},"tableColumn": "","targets": [{"expr": "100 - ((node_filesystem_avail_bytes{instance=~\"nginxvlb\",mountpoint=\"/\",fstype=~\"ext4|xfs\"} * 100) / node_filesystem_size_bytes {instance=~\"nginxvlb\",mountpoint=\"/\",fstype=~\"ext4|xfs\"})","format": "time_series","interval": "10s","intervalFactor": 1,"refId": "A","step": 20}],"thresholds": "70,90","title": "根分区使用率","type": "singlestat","valueFontSize": "80%","valueMaps": [{"op": "=","text": "N/A","value": "null"}],"valueName": "current"},{"cacheTimeout": null,"colorBackground": false,"colorValue": true,"colors": ["rgba(50, 172, 45, 0.97)","rgba(237, 129, 40, 0.89)","rgba(245, 54, 54, 0.9)"],"datasource": "Prometheus","decimals": null,"description": "通过变量maxmount获取最大的分区。","format": "percent","gauge": {"maxValue": 100,"minValue": 0,"show": true,"thresholdLabels": false,"thresholdMarkers": true},"gridPos": {"h": 5,"w": 4,"x": 20,"y": 1},"id": 154,"interval": null,"links": [],"mappingType": 1,"mappingTypes": [{"name": "value to text","value": 1},{"name": "range to text","value": 2}],"maxDataPoints": 100,"maxPerRow": 6,"nullPointMode": "null","nullText": null,"postfix": "","postfixFontSize": "50%","prefix": "","prefixFontSize": "50%","rangeMaps": [{"from": "null","text": "N/A","to": "null"}],"repeat": null,"repeatDirection": "h","sparkline": {"fillColor": "rgba(31, 118, 189, 0.18)","full": false,"lineColor": "rgb(31, 120, 193)","show": true},"tableColumn": "","targets": [{"expr": "100 - ((node_filesystem_avail_bytes{instance=~\"nginxvlb\",mountpoint=\"$maxmount\",fstype=~\"ext4|xfs\"} * 100) / node_filesystem_size_bytes {instance=~\"nginxvlb\",mountpoint=\"$maxmount\",fstype=~\"ext4|xfs\"})","format": "time_series","interval": "10s","intervalFactor": 1,"refId": "A","step": 20}],"thresholds": "70,90","title": "最大分区($maxmount)使用率","type": "singlestat","valueFontSize": "80%","valueMaps": [{"op": "=","text": "N/A","value": "null"}],"valueName": "current"},{"cacheTimeout": null,"colorBackground": false,"colorValue": false,"colors": ["rgba(245, 54, 54, 0.9)","rgba(237, 129, 40, 0.89)","rgba(50, 172, 45, 0.97)"],"datasource": "Prometheus","decimals": null,"description": "","format": "bytes","gauge": {"maxValue": 100,"minValue": 0,"show": false,"thresholdLabels": false,"thresholdMarkers": true},"gridPos": {"h": 3,"w": 2,"x": 2,"y": 3},"id": 75,"interval": null,"links": [],"mappingType": 1,"mappingTypes": [{"name": "value to text","value": 1},{"name": "range to text","value": 2}],"maxDataPoints": 100,"maxPerRow": 6,"nullPointMode": "null","nullText": null,"postfix": "","postfixFontSize": "70%","prefix": "","prefixFontSize": "50%","rangeMaps": [{"from": "null","text": "N/A","to": "null"}],"sparkline": {"fillColor": "rgba(31, 118, 189, 0.18)","full": false,"lineColor": "rgb(31, 120, 193)","show": false},"tableColumn": "","targets": [{"expr": "node_memory_MemTotal_bytes{instance=~\"nginxvlb\"}","format": "time_series","instant": true,"intervalFactor": 1,"legendFormat": "{{instance}}","refId": "A","step": 20}],"thresholds": "","title": "内存总量","type": "singlestat","valueFontSize": "80%","valueMaps": [{"op": "=","text": "N/A","value": "null"}],"valueName": "current"},{"aliasColors": {"15分钟": "#6ED0E0","1分钟": "#BF1B00","5分钟": "#CCA300"},"bars": false,"dashLength": 10,"dashes": false,"datasource": "Prometheus","editable": true,"error": false,"fill": 1,"grid": {},"gridPos": {"h": 6,"w": 11,"x": 0,"y": 6},"height": "300","id": 13,"legend": {"alignAsTable": true,"avg": true,"current": true,"max": true,"min": false,"rightSide": true,"show": true,"total": false,"values": true},"lines": true,"linewidth": 2,"links": [],"maxPerRow": 6,"nullPointMode": "null as zero","paceLength": 10,"percentage": false,"pointradius": 5,"points": false,"renderer": "flot","repeat": null,"seriesOverrides": [],"spaceLength": 10,"stack": false,"steppedLine": false,"targets": [{"expr": "node_load1{instance=~\"nginxvlb\"}","format": "time_series","instant": false,"interval": "10s","intervalFactor": 2,"legendFormat": "1m","metric": "","refId": "A","step": 20,"target": ""},{"expr": "node_load5{instance=~\"nginxvlb\"}","format": "time_series","instant": false,"interval": "10s","intervalFactor": 2,"legendFormat": "5m","refId": "B","step": 20},{"expr": "node_load15{instance=~\"nginxvlb\"}","format": "time_series","instant": false,"interval": "10s","intervalFactor": 2,"legendFormat": "15m","refId": "C","step": 20}],"thresholds": [],"timeFrom": null,"timeRegions": [],"timeShift": null,"title": "系统平均负载","tooltip": {"msResolution": false,"shared": true,"sort": 0,"value_type": "cumulative"},"type": "graph","xaxis": {"buckets": null,"mode": "time","name": null,"show": true,"values": []},"yaxes": [{"format": "short","logBase": 1,"max": null,"min": null,"show": true},{"format": "short","logBase": 1,"max": null,"min": null,"show": true}],"yaxis": {"align": false,"alignLevel": null}},{"aliasColors": {"/": "#eab839","/boot": "#bf1b00","/data": "#1f78c1"},"breakPoint": "100%","cacheTimeout": null,"combine": {"label": "Others","threshold": ""},"datasource": "Prometheus","decimals": 1,"fontSize": "50%","format": "bytes","gridPos": {"h": 6,"w": 5,"x": 11,"y": 6},"hideTimeOverride": false,"id": 171,"interval": null,"legend": {"header": "","percentage": false,"percentageDecimals": 0,"show": true,"sideWidth": 142,"values": true},"legendType": "Right side","links": [],"maxDataPoints": 3,"nullPointMode": "connected","pieType": "pie","strokeWidth": "2","targets": [{"expr": "node_filesystem_size_bytes {instance=~\"nginxvlb\",fstype=~\"ext4|xfs\"}","format": "time_series","instant": true,"interval": "10s","intervalFactor": 1,"legendFormat": "{{mountpoint}}","refId": "A"}],"title": "磁盘总空间","type": "grafana-piechart-panel","valueName": "current"},{"columns": [],"datasource": "Prometheus","fontSize": "120%","gridPos": {"h": 6,"w": 8,"x": 16,"y": 6},"id": 164,"links": [],"pageSize": null,"scroll": true,"showHeader": true,"sort": {"col": 11,"desc": true},"styles": [{"alias": "Time","dateFormat": "YYYY-MM-DD HH:mm:ss","pattern": "Time","type": "hidden"},{"alias": "分区","colorMode": null,"colors": ["rgba(50, 172, 45, 0.97)","rgba(237, 129, 40, 0.89)","rgba(245, 54, 54, 0.9)"],"dateFormat": "YYYY-MM-DD HH:mm:ss","decimals": 2,"mappingType": 1,"pattern": "mountpoint","thresholds": [""],"type": "string","unit": "bytes"},{"alias": "可用空间","colorMode": "value","colors": ["rgba(245, 54, 54, 0.9)","rgba(237, 129, 40, 0.89)","rgba(50, 172, 45, 0.97)"],"dateFormat": "YYYY-MM-DD HH:mm:ss","decimals": 2,"mappingType": 1,"pattern": "Value #A","thresholds": ["10000000000","20000000000"],"type": "number","unit": "bytes"},{"alias": "使用率","colorMode": "cell","colors": ["rgba(50, 172, 45, 0.97)","rgba(237, 129, 40, 0.89)","rgba(245, 54, 54, 0.9)"],"dateFormat": "YYYY-MM-DD HH:mm:ss","decimals": 2,"mappingType": 1,"pattern": "Value #B","thresholds": ["70","90"],"type": "number","unit": "percentunit"},{"alias": "总空间","colorMode": null,"colors": ["rgba(245, 54, 54, 0.9)","rgba(237, 129, 40, 0.89)","rgba(50, 172, 45, 0.97)"],"dateFormat": "YYYY-MM-DD HH:mm:ss","decimals": 1,"link": false,"mappingType": 1,"pattern": "Value #C","thresholds": [],"type": "number","unit": "bytes"},{"alias": "文件系统","colorMode": null,"colors": ["rgba(245, 54, 54, 0.9)","rgba(237, 129, 40, 0.89)","rgba(50, 172, 45, 0.97)"],"dateFormat": "YYYY-MM-DD HH:mm:ss","decimals": 2,"link": false,"mappingType": 1,"pattern": "fstype","thresholds": [],"type": "number","unit": "short"},{"alias": "","colorMode": null,"colors": ["rgba(245, 54, 54, 0.9)","rgba(237, 129, 40, 0.89)","rgba(50, 172, 45, 0.97)"],"decimals": 2,"pattern": "/.*/","preserveFormat": true,"sanitize": false,"thresholds": [],"type": "hidden","unit": "short"}],"targets": [{"expr": "node_filesystem_size_bytes{instance=~'nginxvlb',fstype=~\"ext4|xfs\"}","format": "table","hide": true,"instant": true,"intervalFactor": 1,"legendFormat": "","refId": "C"},{"expr": "node_filesystem_avail_bytes {instance=~'nginxvlb',fstype=~\"ext4|xfs\"}","format": "table","hide": false,"instant": true,"interval": "10s","intervalFactor": 1,"legendFormat": "","refId": "A"},{"expr": "1-(node_filesystem_free_bytes{instance=~'nginxvlb',fstype=~\"ext4|xfs\"} / node_filesystem_size_bytes{instance=~'nginxvlb',fstype=~\"ext4|xfs\"})","format": "table","hide": false,"instant": true,"intervalFactor": 1,"legendFormat": "","refId": "B"},{"expr": "","format": "table","interval": "10s","intervalFactor": 1,"legendFormat": "","refId": "D"}],"title": "各分区可用空间","transform": "table","type": "table"},{"aliasColors": {"Idle - Waiting for something to happen": "#052B51","guest": "#9AC48A","idle": "#052B51","iowait": "#EAB839","irq": "#BF1B00","nice": "#C15C17","sdb_每秒I/O操作%": "#d683ce","softirq": "#E24D42","steal": "#FCE2DE","system": "#508642","user": "#5195CE","磁盘花费在I/O操作占比": "#ba43a9"},"bars": false,"dashLength": 10,"dashes": false,"datasource": "Prometheus","decimals": 2,"description": "node_disk_io_time_seconds_total:\n磁盘花费在输入/输出操作上的毫秒数。该值为累加值。(Milliseconds Spent Doing I/Os)\n\nirate(node_disk_io_time_seconds_total[1m]):\n计算每秒的速率:(last值-last前一个值)/时间戳差值,即:1秒钟内磁盘花费在I/O操作的时间占比。","fill": 1,"gridPos": {"h": 7,"w": 16,"x": 0,"y": 12},"id": 7,"legend": {"alignAsTable": true,"avg": true,"current": true,"hideEmpty": true,"hideZero": true,"max": true,"min": false,"rightSide": true,"show": true,"sideWidth": null,"sort": null,"sortDesc": null,"total": false,"values": true},"lines": true,"linewidth": 1,"links": [],"maxPerRow": 6,"nullPointMode": "null","paceLength": 10,"percentage": false,"pointradius": 5,"points": false,"renderer": "flot","repeat": null,"seriesOverrides": [],"spaceLength": 10,"stack": false,"steppedLine": false,"targets": [{"expr": "avg(irate(node_cpu_seconds_total{instance=~\"nginxvlb\",mode=\"system\"}[1m]))","format": "time_series","interval": "","intervalFactor": 2,"legendFormat": "System","refId": "A","step": 20},{"expr": "avg(irate(node_cpu_seconds_total{instance=~\"nginxvlb\",mode=\"user\"}[1m]))","format": "time_series","intervalFactor": 2,"legendFormat": "User","refId": "B","step": 240},{"expr": "avg(irate(node_cpu_seconds_total{instance=~\"nginxvlb\",mode=\"idle\"}[1m]))","format": "time_series","hide": true,"intervalFactor": 2,"legendFormat": "Idle","refId": "F","step": 240},{"expr": "avg(irate(node_cpu_seconds_total{instance=~\"nginxvlb\",mode=\"iowait\"}[1m]))","format": "time_series","intervalFactor": 2,"legendFormat": "Iowait","refId": "D","step": 240},{"expr": "irate(node_disk_io_time_seconds_total{instance=~\"nginxvlb\"}[1m])","format": "time_series","intervalFactor": 1,"legendFormat": "{{device}}_每秒I/O操作%","refId": "C"}],"thresholds": [],"timeFrom": null,"timeRegions": [],"timeShift": null,"title": "CPU使用率、磁盘每秒的I/O操作耗费时间(%)","tooltip": {"shared": true,"sort": 0,"value_type": "individual"},"type": "graph","xaxis": {"buckets": null,"mode": "time","name": null,"show": true,"values": []},"yaxes": [{"decimals": null,"format": "percentunit","label": "","logBase": 1,"max": null,"min": null,"show": true},{"format": "short","label": null,"logBase": 1,"max": null,"min": null,"show": false}],"yaxis": {"align": false,"alignLevel": null}},{"alert": {   #这一段需要添加"conditions": [{"evaluator": {"params": [1999999998],"type": "lt"},"operator": {"type": "and"},"query": {"params": ["F","10s","now"]},"reducer": {"params": [],"type": "avg"},"type": "query"}],"executionErrorState": "alerting","for": "10s","frequency": "10s","handler": 1,"message": "【Warning】[10.10.25.111]vlb服务器内存剩余不足2G,请注意查看!","name": "[10.10.25.111]vlbserver mem is less then 2g","noDataState": "alerting","notifications": []},"aliasColors": {"内存_Avaliable": "#6ED0E0","内存_Cached": "#EF843C","内存_Free": "#629E51","内存_Total": "#6d1f62","内存_Used": "#eab839","可用": "#9ac48a","总内存": "#bf1b00"},"bars": false,"dashLength": 10,"dashes": false,"datasource": "Prometheus","decimals": 2,"fill": 6,"gridPos": {"h": 7,"w": 8,"x": 16,"y": 12},"height": "300","id": 156,"legend": {"alignAsTable": false,"avg": false,"current": true,"max": false,"min": false,"rightSide": false,"show": true,"total": false,"values": true},"lines": true,"linewidth": 3,"links": [],"nullPointMode": "null","paceLength": 10,"percentage": false,"pointradius": 5,"points": false,"renderer": "flot","seriesOverrides": [],"spaceLength": 10,"stack": false,"steppedLine": false,"targets": [{"expr": "node_memory_MemTotal_bytes{instance=~\"nginxvlb\"}","format": "time_series","hide": false,"instant": false,"intervalFactor": 2,"legendFormat": "总内存","refId": "A","step": 4},{"expr": "node_memory_MemTotal_bytes{instance=~\"nginxvlb\"} - node_memory_MemAvailable_bytes{instance=~\"nginxvlb\"}","format": "time_series","hide": false,"intervalFactor": 2,"legendFormat": "已用","refId": "B","step": 4},{"expr": "node_memory_MemFree_bytes{instance=~\"nginxvlb\"}","format": "time_series","hide": true,"intervalFactor": 2,"legendFormat": "内存_Free","refId": "C","step": 4},{"expr": "node_memory_Buffers_bytes{instance=~\"nginxvlb\"}","format": "time_series","hide": true,"intervalFactor": 2,"legendFormat": "内存_Buffers","refId": "D","step": 4},{"expr": "node_memory_Cached_bytes{instance=~\"nginxvlb\"}","format": "time_series","hide": true,"intervalFactor": 2,"legendFormat": "内存_Cached","refId": "E","step": 4},{"expr": "node_memory_MemAvailable_bytes{instance=~\"nginxvlb\"}","format": "time_series","hide": false,"interval": "","intervalFactor": 2,"legendFormat": "可用","refId": "F","step": 4},{"expr": "node_memory_MemTotal_bytes{instance=~\"nginxvlb\"} - (node_memory_Cached_bytes{instance=~\"nginxvlb\"} + node_memory_Buffers_bytes{instance=~\"nginxvlb\"} + node_memory_MemFree_bytes{instance=~\"nginxvlb\"})","format": "time_series","hide": true,"intervalFactor": 1,"refId": "G"}],"thresholds": [{###这一小段需要添加"colorMode": "critical","fill": true,"line": true,"op": "lt","value": 1999999998}],"timeFrom": null,"timeRegions": [],"timeShift": null,"title": "内存信息","tooltip": {"shared": true,"sort": 0,"value_type": "individual"},"type": "graph","xaxis": {"buckets": null,"mode": "time","name": null,"show": true,"values": []},"yaxes": [{"format": "bytes","label": null,"logBase": 1,"max": null,"min": "0","show": true},{"format": "short","label": null,"logBase": 1,"max": null,"min": null,"show": true}],"yaxis": {"align": false,"alignLevel": null}},{"aliasColors": {"vda_write": "#6ED0E0"},"bars": true,"dashLength": 10,"dashes": false,"datasource": "Prometheus","description": "Reads completed: 每个磁盘分区每秒读完成次数\n\nWrites completed: 每个磁盘分区每秒写完成次数\n\nIO now 每个磁盘分区每秒正在处理的输入/输出请求数","fill": 2,"gridPos": {"h": 8,"w": 8,"x": 0,"y": 19},"height": "300","id": 161,"legend": {"alignAsTable": false,"avg": false,"current": true,"hideEmpty": true,"hideZero": true,"max": true,"min": false,"show": true,"total": false,"values": true},"lines": false,"linewidth": 1,"links": [],"nullPointMode": "null","paceLength": 10,"percentage": false,"pointradius": 5,"points": false,"renderer": "flot","seriesOverrides": [{"alias": "/.*_读取$/","transform": "negative-Y"}],"spaceLength": 10,"stack": false,"steppedLine": false,"targets": [{"expr": "irate(node_disk_reads_completed_total{instance=~\"nginxvlb\"}[1m])","format": "time_series","hide": false,"interval": "","intervalFactor": 2,"legendFormat": "{{device}}_读取","refId": "A","step": 10},{"expr": "irate(node_disk_writes_completed_total{instance=~\"nginxvlb\"}[1m])","format": "time_series","hide": false,"intervalFactor": 2,"legendFormat": "{{device}}_写入","refId": "B","step": 10},{"expr": "node_disk_io_now{instance=~\"nginxvlb\"}","format": "time_series","hide": true,"interval": "","intervalFactor": 1,"legendFormat": "{{device}}","refId": "C"}],"thresholds": [],"timeFrom": null,"timeRegions": [],"timeShift": null,"title": "磁盘读写速率(IOPS)","tooltip": {"shared": true,"sort": 0,"value_type": "individual"},"type": "graph","xaxis": {"buckets": null,"mode": "time","name": null,"show": true,"values": []},"yaxes": [{"decimals": null,"format": "iops","label": "读取(-)/写入(+)I/O ops/sec","logBase": 1,"max": null,"min": null,"show": true},{"format": "short","label": null,"logBase": 1,"max": null,"min": null,"show": true}],"yaxis": {"align": false,"alignLevel": null}},{"aliasColors": {"vda_write": "#6ED0E0"},"bars": true,"dashLength": 10,"dashes": false,"datasource": "Prometheus","description": "Read bytes 每个磁盘分区每秒读取的比特数\nWritten bytes 每个磁盘分区每秒写入的比特数","fill": 2,"gridPos": {"h": 8,"w": 8,"x": 8,"y": 19},"height": "300","id": 168,"legend": {"alignAsTable": false,"avg": false,"current": true,"hideEmpty": true,"hideZero": true,"max": true,"min": false,"show": true,"total": false,"values": true},"lines": false,"linewidth": 1,"links": [],"nullPointMode": "null","paceLength": 10,"percentage": false,"pointradius": 5,"points": false,"renderer": "flot","seriesOverrides": [{"alias": "/.*_读取$/","transform": "negative-Y"}],"spaceLength": 10,"stack": false,"steppedLine": false,"targets": [{"expr": "irate(node_disk_read_bytes_total{instance=~\"nginxvlb\"}[1m])","format": "time_series","interval": "","intervalFactor": 2,"legendFormat": "{{device}}_读取","refId": "A","step": 10},{"expr": "irate(node_disk_written_bytes_total{instance=~\"nginxvlb\"}[1m])","format": "time_series","hide": false,"intervalFactor": 2,"legendFormat": "{{device}}_写入","refId": "B","step": 10}],"thresholds": [],"timeFrom": null,"timeRegions": [],"timeShift": null,"title": "磁盘读写容量大小","tooltip": {"shared": true,"sort": 0,"value_type": "individual"},"type": "graph","xaxis": {"buckets": null,"mode": "time","name": null,"show": true,"values": []},"yaxes": [{"decimals": null,"format": "Bps","label": "读取(-)/写入(+)","logBase": 1,"max": null,"min": null,"show": true},{"format": "short","label": null,"logBase": 1,"max": null,"min": null,"show": false}],"yaxis": {"align": false,"alignLevel": null}},{"aliasColors": {"vda": "#6ED0E0"},"bars": false,"dashLength": 10,"dashes": false,"datasource": "Prometheus","description": "Read time ms 每个磁盘分区读操作花费的秒数\n\nWrite time ms 每个磁盘分区写操作花费的秒数\n\nIO time ms 每个磁盘分区输入/输出操作花费的秒数\n\nIO time weighted 每个磁盘分区输入/输出操作花费的加权秒数","fill": 3,"gridPos": {"h": 8,"w": 8,"x": 16,"y": 19},"height": "300","id": 160,"legend": {"alignAsTable": false,"avg": false,"current": true,"hideEmpty": true,"hideZero": true,"max": true,"min": false,"show": true,"total": false,"values": true},"lines": true,"linewidth": 1,"links": [],"nullPointMode": "null","paceLength": 10,"percentage": false,"pointradius": 5,"points": false,"renderer": "flot","seriesOverrides": [{"alias": "/,*_读取$/","transform": "negative-Y"}],"spaceLength": 10,"stack": false,"steppedLine": false,"targets": [{"expr": "irate(node_disk_io_time_seconds_total{instance=~\"nginxvlb\"}[1m])","format": "time_series","hide": true,"interval": "","intervalFactor": 2,"legendFormat": "{{device}}","refId": "A","step": 10},{"expr": "irate(node_disk_io_time_weighted_seconds_total{instance=~\"nginxvlb\"}[1m])","format": "time_series","hide": true,"intervalFactor": 1,"legendFormat": "{{device}}_加权","refId": "D"},{"expr": "irate(node_disk_read_time_seconds_total{instance=~\"nginxvlb\"}[1m])","format": "time_series","hide": false,"interval": "","intervalFactor": 1,"legendFormat": "{{device}}_读取","refId": "B"},{"expr": "irate(node_disk_write_time_seconds_total{instance=~\"nginxvlb\"}[1m])","format": "time_series","hide": false,"intervalFactor": 1,"legendFormat": "{{device}}_写入","refId": "C"}],"thresholds": [],"timeFrom": null,"timeRegions": [],"timeShift": null,"title": "磁盘IO读写时间","tooltip": {"shared": true,"sort": 0,"value_type": "individual"},"type": "graph","xaxis": {"buckets": null,"mode": "time","name": null,"show": true,"values": []},"yaxes": [{"format": "s","label": "读取(-)/写入(+)","logBase": 1,"max": null,"min": null,"show": true},{"format": "short","label": null,"logBase": 1,"max": null,"min": null,"show": false}],"yaxis": {"align": false,"alignLevel": null}},{"aliasColors": {},"bars": false,"dashLength": 10,"dashes": false,"datasource": "Prometheus","fill": 1,"gridPos": {"h": 8,"w": 12,"x": 0,"y": 27},"height": "300","id": 157,"legend": {"alignAsTable": false,"avg": false,"current": true,"hideEmpty": true,"hideZero": true,"max": false,"min": false,"show": true,"total": false,"values": true},"lines": true,"linewidth": 2,"links": [],"nullPointMode": "null","paceLength": 10,"percentage": false,"pointradius": 5,"points": false,"renderer": "flot","seriesOverrides": [{"alias": "/.*_out上传$/","transform": "negative-Y"}],"spaceLength": 10,"stack": false,"steppedLine": false,"targets": [{"expr": "irate(node_network_receive_bytes_total{instance=~'nginxvlb',device!~'tap.*'}[5m])*8","format": "time_series","intervalFactor": 2,"legendFormat": "{{device}}_in下载","refId": "A","step": 4},{"expr": "irate(node_network_transmit_bytes_total{instance=~'nginxvlb',device!~'tap.*'}[5m])*8","format": "time_series","intervalFactor": 2,"legendFormat": "{{device}}_out上传","refId": "B","step": 4}],"thresholds": [],"timeFrom": null,"timeRegions": [],"timeShift": null,"title": "网络流量","tooltip": {"shared": true,"sort": 0,"value_type": "individual"},"type": "graph","xaxis": {"buckets": null,"mode": "time","name": null,"show": true,"values": []},"yaxes": [{"format": "bps","label": "上传(-)/下载(+)","logBase": 1,"max": null,"min": null,"show": true},{"format": "short","label": null,"logBase": 1,"max": null,"min": null,"show": false}],"yaxis": {"align": false,"alignLevel": null}},{"aliasColors": {"TCP": "#6ED0E0"},"bars": false,"dashLength": 10,"dashes": false,"datasource": "Prometheus","description": "CurrEstab - 当前状态为 ESTABLISHED 或 CLOSE-WAIT 的 TCP 连接数\n\nActiveOpens - 已从 CLOSED 状态直接转换到 SYN-SENT 状态的 TCP 平均连接数(1分钟内)\n\nPassiveOpens - 已从 LISTEN 状态直接转换到 SYN-RCVD 状态的 TCP 平均连接数(1分钟内)\n\nTCP_alloc - 已分配(已建立、已申请到sk_buff)的TCP套接字数量\n\nTCP_inuse - 正在使用(正在侦听)的TCP套接字数量\n\nTCP_tw - 等待关闭的TCP连接数","fill": 0,"gridPos": {"h": 8,"w": 12,"x": 12,"y": 27},"height": "300","id": 158,"legend": {"alignAsTable": true,"avg": false,"current": true,"max": true,"min": false,"rightSide": true,"show": true,"total": false,"values": true},"lines": true,"linewidth": 1,"links": [],"nullPointMode": "null","paceLength": 10,"percentage": false,"pointradius": 5,"points": false,"renderer": "flot","seriesOverrides": [],"spaceLength": 10,"stack": false,"steppedLine": false,"targets": [{"expr": "node_netstat_Tcp_CurrEstab{instance=~'nginxvlb'}","format": "time_series","hide": false,"interval": "10s","intervalFactor": 1,"legendFormat": "ESTABLISHED","refId": "A","step": 20},{"expr": "node_sockstat_TCP_tw{instance=~'nginxvlb'}","format": "time_series","intervalFactor": 1,"legendFormat": "TCP_tw","refId": "D"},{"expr": "irate(node_netstat_Tcp_ActiveOpens{instance=~'nginxvlb'}[1m])","format": "time_series","hide": false,"intervalFactor": 1,"legendFormat": "ActiveOpens","refId": "B"},{"expr": "irate(node_netstat_Tcp_PassiveOpens{instance=~'nginxvlb'}[1m])","format": "time_series","intervalFactor": 1,"legendFormat": "PassiveOpens","refId": "C"},{"expr": "node_sockstat_TCP_alloc{instance=~'nginxvlb'}","format": "time_series","intervalFactor": 1,"legendFormat": "TCP_alloc","refId": "E"},{"expr": "node_sockstat_TCP_inuse{instance=~'nginxvlb'}","format": "time_series","intervalFactor": 1,"legendFormat": "TCP_inuse","refId": "F"}],"thresholds": [],"timeFrom": null,"timeRegions": [],"timeShift": null,"title": "TCP 连接情况","tooltip": {"shared": true,"sort": 0,"value_type": "individual"},"type": "graph","xaxis": {"buckets": null,"mode": "time","name": null,"show": true,"values": []},"yaxes": [{"format": "short","label": null,"logBase": 1,"max": null,"min": null,"show": true},{"format": "short","label": null,"logBase": 1,"max": null,"min": null,"show": true}],"yaxis": {"align": false,"alignLevel": null}},{"aliasColors": {},"bars": false,"dashLength": 10,"dashes": false,"datasource": "Prometheus","fill": 0,"gridPos": {"h": 10,"w": 24,"x": 0,"y": 35},"id": 169,"legend": {"alignAsTable": true,"avg": true,"current": true,"hideEmpty": true,"hideZero": true,"max": true,"min": false,"rightSide": true,"show": true,"total": false,"values": true},"lines": true,"linewidth": 1,"links": [],"nullPointMode": "null as zero","paceLength": 10,"percentage": false,"pointradius": 0.5,"points": false,"renderer": "flot","seriesOverrides": [],"spaceLength": 10,"stack": false,"steppedLine": false,"targets": [{"expr": "node_hwmon_temp_celsius{instance=\"nginxvlb\"}","format": "time_series","intervalFactor": 1,"legendFormat": "{{chip}} {{sensor}}","refId": "A"}],"thresholds": [],"timeFrom": null,"timeRegions": [],"timeShift": null,"title": "硬件温度","tooltip": {"shared": true,"sort": 0,"value_type": "individual"},"type": "graph","xaxis": {"buckets": null,"mode": "time","name": null,"show": true,"values": []},"yaxes": [{"format": "celsius","label": null,"logBase": 1,"max": null,"min": null,"show": true},{"format": "short","label": null,"logBase": 1,"max": null,"min": null,"show": true}],"yaxis": {"align": false,"alignLevel": null}}],"refresh": false,"schemaVersion": 18,"style": "dark","tags": ["StarsL","Prometheus"],"templating": {"list": [{"auto": true,"auto_count": 30,"auto_min": "10s","current": {"text": "auto","value": "$__auto_interval_interval"},"hide": 0,"label": "interval","name": "interval","options": [{"selected": true,"text": "auto","value": "$__auto_interval_interval"},{"selected": false,"text": "1m","value": "1m"},{"selected": false,"text": "10m","value": "10m"},{"selected": false,"text": "30m","value": "30m"},{"selected": false,"text": "1h","value": "1h"},{"selected": false,"text": "6h","value": "6h"},{"selected": false,"text": "12h","value": "12h"},{"selected": false,"text": "1d","value": "1d"},{"selected": false,"text": "7d","value": "7d"},{"selected": false,"text": "14d","value": "14d"},{"selected": false,"text": "30d","value": "30d"}],"query": "1m,10m,30m,1h,6h,12h,1d,7d,14d,30d","refresh": 2,"skipUrlSync": false,"type": "interval"},{"allFormat": "glob","allValue": null,"current": {"isNone": true,"text": "None","value": ""},"datasource": "Prometheus","definition": "","hide": 0,"includeAll": false,"label": "环境","multi": false,"multiFormat": "regex values","name": "env","options": [],"query": "label_values(node_exporter_build_info,env)","refresh": 1,"regex": "","skipUrlSync": false,"sort": 1,"tagValuesQuery": "","tags": [],"tagsQuery": "","type": "query","useTags": false},{"allFormat": "glob","allValue": null,"current": {"isNone": true,"text": "None","value": ""},"datasource": "Prometheus","definition": "","hide": 0,"includeAll": false,"label": "主机名","multi": false,"multiFormat": "regex values","name": "name","options": [],"query": "label_values(node_exporter_build_info{env='$env'},name)","refresh": 1,"regex": "","skipUrlSync": false,"sort": 1,"tagValuesQuery": "","tags": [],"tagsQuery": "","type": "query","useTags": false},{"allFormat": "glob","allValue": null,"current": {"tags": [],"text": "nginxvlb","value": "nginxvlb"},"datasource": "Prometheus","definition": "","hide": 0,"includeAll": false,"label": "节点","multi": false,"multiFormat": "regex values","name": "node","options": [],"query": "label_values(node_exporter_build_info{name='$name'},instance)","refresh": 1,"regex": "","skipUrlSync": false,"sort": 1,"tagValuesQuery": "","tags": [],"tagsQuery": "","type": "query","useTags": false},{"allValue": null,"current": {"text": "/","value": "/"},"datasource": "Prometheus","definition": "","hide": 2,"includeAll": false,"label": "","multi": false,"name": "maxmount","options": [],"query": "query_result(topk(1,sort_desc (max(node_filesystem_size_bytes{instance=~'nginxvlb',fstype=~\"ext4|xfs\"}) by (mountpoint))))","refresh": 1,"regex": "/.*\\\"(.*)\\\".*/","skipUrlSync": false,"sort": 0,"tagValuesQuery": "","tags": [],"tagsQuery": "","type": "query","useTags": false}]},"time": {"from": "now-5m","to": "now"},"timepicker": {"now": true,"refresh_intervals": ["5s","10s","30s","1m","5m","15m","30m","1h","2h","1d"],"time_options": ["5m","15m","1h","6h","12h","24h","2d","7d","30d"]},"timezone": "browser","title": "nginxvlb","uid": "SW8eIbgZz","version": 4
}
需要重启prometheus + grafana-server 服务
查看 Telegram群组告警
如果需要其他报警请自己编辑json文件.
转载于:https://my.oschina.net/54188zz/blog/3030618
基于prometheus + grafana + mysql + Telegram 监控告警相关推荐
- mysql 可视化监控_基于Prometheus构建MySQL可视化监控平台
对于MySQL的监控平台,相信大家实现起来有很多了:基于天兔的监控,还有基于zabbix相关的二次开发.相信很多同行都应该已经开始玩起来了.我这边的选型是prometheus + granafa的实现 ...
- 监控——Prometheus+ Grafana+Mysql主从复制监控
目录 一.基础概念 二.grafana部署(端口3000) 三.打标签,主要用于k8s 重打标签 四.prometheus告警功能 五.实验部署 主服务器时间同步 从服务器时间同步 主服务器的mysq ...
- 基于Prometheus+Grafana搭建监控平台-(2)实现监控elink服务器EIMServer
EIMServer是由北京华夏易联科技开发有限公司研发的一款可以私有部署的即时通讯服务平台E-Link,服务器是基于OSGI框架研发的java服务器程序,所以也可以通过Prometheus+Grafa ...
- 基于Prometheus+Grafana搭建监控平台-(5)实现监控Solr服务
基于Prometheus+Grafana搭建监控平台-(1)搭建基础环境,实现监控JVM 基于Prometheus+Grafana搭建监控平台-(2)实现监控elink服务器EIMServer 基于P ...
- 基于Prometheus+Grafana监控SQL Server数据库
墨墨导读:本文整理了基于Prometheus+Grafana监控SQL Server数据库的全过程,分享至此,希望对大家有帮助. 搭建SQL Server环境 使用容器建立SQL Server环境非常 ...
- 3.Prometheus + Grafana实现可视化、告警
3.Prometheus + Grafana实现可视化.告警 3.1.什么是Grafana 3.2.快速入门 3.3.Grafana的下载 3.4.启动grafana 3.5.配置数据源 3.6.配置 ...
- 技术实践丨Prometheus+Grafana搭建HBase监控仪表盘
摘要:Grafana+Prometheus是目前非常流行的监控方案,图形化展示非常强大. 本文分享自华为云社区<Prometheus+Grafana搭建HBase监控仪表盘>,原文作者:L ...
- Prometheus+Grafana+企业微信机器人告警
Prometheus+Grafana+企业微信机器人告警 开源监控和报警系统 Prometheus+Grafana+企业微信机器人告警 Prometheus+Grafana+企业微信机器人告警 1.P ...
- 使用开源实时监控系统 HertzBeat 5分钟搞定 Mysql 数据库监控告警
使用开源实时监控系统 HertzBeat 对 Mysql 数据库监控告警实践,5分钟搞定! Mysql 数据库介绍 MySQL是一个开源关系型数据库管理系统,由瑞典MySQL AB 公司开发,属于 O ...
最新文章
- 微服务实战(一):微服务架构的优势与不足
- 市值十亿美金公司的五个特点
- 如果波音公司破产,对美国经济的影响有多大?
- Math.round(),Math.ceil(),Math.floor()的区别
- 年薪30k-50k、面试通过率90%,这个职位到底是在做什么?
- activeMQ,spring的jmstemplate简单例子
- linux应用对物理内存映射,深入理解Linux内存映射机制 (1)
- java监听器演示样例
- csdn 登录经常卡住无法登录
- TCP 和 UDP 的区别 TCP 和 UDP 详解
- (1)外网映射(NATAPP快速入门)
- excel冻结窗口怎么设置_excel冻结多行怎么设置-和冻结首行一样哦
- 非常详细的范式讲解(1NF/2NF/3NF/BCNF)
- CF446C DZY Loves Fibonacci Numbers 万能的线段树
- 智能扫描王 v1.0.0
- 信息学奥赛一本通1379:热浪(heatwv) 图论dijkastra算法
- 关于软件测试你必须知道的名词
- JoyStick(游戏手柄)与C#
- 数据结构与算法 试题与答案
- PC 微信 Hook 实战记录 1: 找到个人信息
热门文章
- 用css和jquery实现标签页效果(一)
- VS2010链接SQLsever2008数据库时出现[DBNETLIB][ConnectionOpen (Connect()).]SQL Server 不存在或拒
- 7-118 估值一亿的AI核心代码 (20 分)
- 7-237 有理数加法 (15 分)
- 动态规划之最长公共子序列
- c语言vco_VCO仿真的方法
- String s = new String(“hello“)创建了几个对象(图解)
- Java如何读取mysql存入es_java循环读取mysql并存入java集合里
- UVA - 820 Internet Bandwidth(最大流模板题)
- Linux中ls -l(ll)返回结果中的文件访问权限-rw-r--rw-