三种模型验证方法:holdout, K-fold, leave one out cross validation(LOOCV)
Cross Validation: A Beginner’s Guide
An introduction to LOO, K-Fold, and Holdout model validation
By: Caleb Neale, Demetri Workman, Abhinay Dommalapati
源自:https://towardsdatascience.com/cross-validation-a-beginners-guide-5b8ca04962cd
文章目录
- Cross Validation: A Beginner’s Guide
- An introduction to LOO, K-Fold, and Holdout model validation
- 1. 什么是模型验证?
- 2. Holdout validation
- 3. 模型验证中的偏差和方差
- 4. 什么是交叉验证?
- 4.1 K-折交叉验证
- 5. Leave One Out Cross Validation
- 6. 不同模型验证方法的适用情况
- 6.1 Hold out method
- 6.2 **K-Fold Cross Validation**
- 6.3 LOOCV
- 7. 不同模型验证方法的优点和缺点
- 7.1 Holdout Validation
- 7.2 K-fold Validation
- 7.3 LOOCV
- 8. 何时不需要使用交叉验证(cross validation)?
- 8.1 K-fold交叉验证
- 8.2 Holdout validation
- 9. Key Terms
在开始进入机器学习和数据科学的旅程时,通常会有一种诱惑,即跳进算法和模型创建,而不了解如何在真实数据上测试生成的模型的有效性。 **交叉验证(Cross validation) 是一种试图通过利用我们的数据的子集和理解的偏差(bias)/方差(variance) 平衡改进独立验证(hold-out validation)**的基本方法, 进而更好地评估我们的模型在训练数据之外的数据上的性能。
本文旨在为三种模型验证方法(hold out、k-fold和LOOCV)及其背后的概念提供指南,并提供链接和参考资料,以指导您进一步阅读。 在给出的例子中,我们使用了scikit learn、pandas、numpy和其他python库。
我们将在本文中解决如下问题:
- 什么是模型验证?
- 为什么模型验证很重要?
- 模型验证中的bias和variance是什么?
- 什么是交叉验证?
- 交叉验证有哪些常见的方法?
- 不同的交叉验证方法应该在什么情形、什么时候使用?
- 不同的交叉验证方法是如何工作的?
- 我们如何利用交叉验证来创建更好的模型?
1. 什么是模型验证?
模型验证是我们确保我们的模型在“现实世界”中可以执行的过程。 用更专业的术语来说,模型验证允许您预测您的模型将如何在训练中不使用的数据集上执行(模型验证时防止数据泄漏非常重要)。 模型验证很重要,因为我们并不关心模型预测我们训练它的数据有多好。 我们已经知道用于训练模型的数据的目标值(target value), 并且更重要的是要考虑模型在具有相同分布和特征但是目标值不同的新数据集上的性能。模型验证的最简单形式是hold-out validation, 其是交叉验证的最简单形式,易于实现。让我们看下面的例子。
2. Holdout validation
在这个例子中,我们将在scikit-learn的加州房价数据库上使用线性回归。
# import scikit learn databases
from sklearn import datasets
# import california housing data from sklearn and store data into a variable
calihouses = datasets.fetch_california_housing()
calidata = calihouses.data
一旦数据存储在一个变量中,我们将更加容易使用,我们将其转化为pandas dataframe形式,因而我们能够更加容易地观测和使用这些数据。
# import pandas and numpy
import pandas as pd
import numpy as np
# define the columns names of the data then convert to dataframe
headers = calihouses.feature_names
df = pd.DataFrame(calidata, columns=headers)
# print the df and shape to get a better understanding of the data
print(df.shape)
print(df)
现在我们已经看到了我们使用的数据,我们可以开始建模和交叉验证了。在hold-out validation中,我们将数据集划分为训练集和测试集。在训练集上创建模型,然后在测试集上验证产生的模型。尽管pandas中有多种简单的方法可以实现,我们可以使用scikit-learns中的“train_test_split"来实现。
# first store all target data to a variable
y = calihouses.target
# create testing and training sets for hold-out verification using scikit learn method
from sklearn import train_test_split
X_train, X_test, y_train, y_test = train_test_split(df, y, test_size = 0.25)
# validate set shapes
print(X_train.shape, y_train.shape)
print(X_test.shape, y_test.shape)
如你所见,"train_test_split"有三个参数:数据数据(X), 预测变量(y)和作为测试数据的数据比例,此处是25%(常见的划分是7:3, 这取决于数据的多个因素)。然后,我们将划分的X和y数据分别赋值给新的变量,以供后续使用。
现在,我们已经创建了用来创建模型和产生预测test/train split。尽管有其他的方法可以创建模型,我们将使用scikit learn来使之更加简单。我将包括一些行来记录运行时间,我们可以在后续比较中使用。
# time function using .time methods for later comparison
from timeit import default_timer as timer
start_ho = timer()# fit a model using linear model method from sklearn
from sklearn import linear_model
lm = linear_model.LinearRegression()
model = lm.fit(X_train, y_train)# generate predictions
predictions = lm.predict(X_test)
end_ho = timer()# calcualte function runtime
time_ho = (end_ho - start_ho)# show predictions
print(predictions)
让我们在此处停一下,回顾一下我们已经做的。我们创建了线性模型,然后用它进行预测。到此为止,你还没有进行模型验证(model validation)。换句话说,我们还没有比较测试数据上的预测值和测试数据集的真实值。在训练集/测试集划分是必要的,我们可以在没有用于训练的数据上来测试模型(谨防数据泄露)。现在,我们已经有了模型,并且进行了预测,让我们开始hold-out validation。
我们将图形化给定的目标数据集和预测的目标数据集,可视化我们模型的预测性能。
# import seaborn and plotly
mport matplotlib
from matplotlib import pyplot as plt
import seaborn as sns
# set viz style
sns.set_style('dark')
# plot the model
plot = sns.scatterplot(y_test, predictions)
plot.set(xlabel='Given', ylabel='Prediction')
# generate and graph y = x line
x_plot = np.linspace(0,5,100)
y_plot = x_plot
plt.plot(x_plot, y_plot, color='r')
输出为:
![]()
在完美的模型中(可能overfitting), 所有我们的数据点都在红线上,但是当我们的数据点接近这个趋势时,我们可以看到这个模型大致适合测试数据。
现在,让我获得模型打分来评估它与后续的方法。
start_ho_score = timer()
# model score (neg_mean_squared_error)
from sklearn import metrics
ho_score = -1*metrics.mean_squared_error(y_test, predictions)
print(ho_score)
end_ho_score = timer()
ho_score_time = (end_ho_score - start_ho_score)
输出为:
-0.5201754311947533
这就是模型评估。我们使用训练数据来创建模型,用该模型来预测测试集划分上的结果,然后使用打分方法来决定模型在测试数据集上的有效性(负平均平方误差)。这给了我们一个近似,模型在其他类似数据集上的性能会怎么样。
现在,有些事情要考虑。我们只验证了我们的模型一次。如果我们所做的分割恰好对这个模型非常有利呢? 如果我们的划分导致了日期的偏差呢? 我们通过这样分割训练数据集难道不是显著地减少了训练集的大小吗? 这是我们在进行交叉验证时要考虑的几个问题,但首先要介绍一些背景概念。
3. 模型验证中的偏差和方差
为了理解偏差和方差,让我们首先处理过拟合和欠拟合的模型。 当模型与训练数据的拟合非常紧密时,就会产生过拟合(overfit)模型,这可能会导致随机噪声或不希望出现的趋势,这些趋势在预测后续数据集的目标时不会出现或有用。 欠拟合(Underfit)发生在模型不够复杂,占总体趋势的数据将在随后的数据集是有用的预测目标,比如使用一个线性模型拟合一个多项式趋势(可视化和进一步解释这个概念可以从AWS中找到)。
[外链图片转存失败,源站可能有防盗链机制,建议将图片保存下来直接上传(img-uqXyRVFT-1649681177640)(https://jialh.oss-cn-shanghai.aliyuncs.com/img/image-20220411163500729.png)]
当创建模型时,我们考虑几种类型的错误:验证错误、测试错误、偏差导致的错误、方差导致的错误,称之为bias variance trade-off(另一个可视化在这里)。
[外链图片转存失败,源站可能有防盗链机制,建议将图片保存下来直接上传(img-UF9WZWYa-1649681177641)(https://jialh.oss-cn-shanghai.aliyuncs.com/img/image-20220411163742882.png)]
正如前面提到的,我们想知道模型将如何“在现实世界中”执行。 验证误差由偏差和方差引起的误差组成(训练误差不提供关于模型在未来数据集上将如何执行的信息,可以暂时搁置一边)。
最小化模型验证误差需要找到偏差和方差误差组合最小化的模型复杂性点,如图所示。 随着模型复杂性的增加,由偏差引起的误差减小,而由方差引起的误差增大,从而产生偏差-方差权衡,我们稍后将通过各种交叉验证方法来解决这个问题。
现在,让我们来定义偏差和方差:
- Bias: 偏差是由模型的期望值和多次迭代中想要预测的实际值之间差异所产生的误差。在accuracy和precision中科学概念中,偏差与准确率非常相似。
- Variance: 方差定义为模型中不同数据预测之间的变异性所产生的误差。在方差方面,正确的值(s)并不像预测值之间的差异范围那么重要。当我们运行多个模型创建试验时,方差也会发挥更大的作用。
更完整的定义和可视化在这里。
![]()
在机器学习中,偏差和方差经常被当作“偏差和方差的权衡”一起讨论,即在创建和评估模型时,有效地减少一个错误,使得更有可能出现另一个错误。 理想情况下,我们会寻求一个模型,其折衷结果是低偏差和低方差,我们会通过使用交叉验证来实现这一点。 根据数据集的特性,在创建和评估模型时,交叉验证的一种方法可能更理想地实现偏差-方差权衡。
4. 什么是交叉验证?
如果我们所做的分割恰好对这个模型非常有利呢? 如果我们的分割导致了日期的偏差呢? 我们通过这样分割难道不是使得训练数据集显著地减少吗?
Cross validation is a method of model validation which splits the data in creative ways in order to obtain the better estimates of “real world” model performance, and minimize validation error.
交叉验证时一种创造性地划分数据进行模型验证的方法,为了获得“真实世界”数据的模型性能的最好估计,同时最小化验证错误。
记住这些我们在hold-out validation中提出的问题。交叉验证就是我们的答案。
4.1 K-折交叉验证
K-折交叉验证(K-fold validation)是一种流行的交叉验证方法,它将数据打乱并将其拆分为K个折(组)。一般来说,K-fold验证是将一组作为测试数据集,其他k-1组作为训练数据,对模型进行拟合和评估,记录所选的分数。 然后对每一叠(组)重复这个过程,作为测试数据和所有分数的平均值,以获得一个更全面的模型验证分数。 (这里有更多的阅读材料和有用的可视化)。
[外链图片转存失败,源站可能有防盗链机制,建议将图片保存下来直接上传(img-UcmD5YbM-1649681177642)(https://jialh.oss-cn-shanghai.aliyuncs.com/img/image-20220411171924755.png)]
当为 k 选择一个值时,每个折叠(组)应该足够大以代表模型(通常 k=10 或 k=5)并且足够小以在合理的时间内计算。 根据数据集的大小,有时可以尝试不同的 k 值。 作为一般规则,随着 k 的增加,偏差减小,方差增加。
让我们用之前的数据集来举例。
我们将再次使用线性模型,但这次使用 scikit learn 的 cross_val_predict 方法进行模型验证,该方法将完成生成 K-Fold 预测的大部分繁重工作。 在这种情况下,我选择设置 k=10。
# store data as an array
X = np.array(df)# again, timing the function for comparison
start_kfold = timer()# use cross_val_predict to generate K-Fold predictions
lm_k = linear_model.LinearRegression()
k_predictions = cross_val_predict(lm_k, X, y, cv=10)
print(k_predictions)end_kfold = timer()kfold_time = (end_kfold - start_kfold)
输出(或近似)为:
[4.22358985 4.04800271 3.75534521 ... 0.14474758 0.29600522 0.49525933]
cross_val_predict接收用于数据的模型、输入数据和预测变量以及“cv"参数,返回每个输入的预测值。现在,我们可以绘制预测结果,正如我们在holdout方法中进行的一样。
# plot k-fold predictions against actual
plot_k = sns.scatterplot(y, k_predictions)
plot_k.set(xlabel='Given', ylabel='Prediction')
# generate and graph y = x line
x_plot = np.linspace(0,5,100)
y_plot = x_plot
plt.plot(x_plot, y_plot, color='r')
输出为:
![]()
接下来,让我获得10个产生的模型的打分,然后绘图可视化:
kfold_score_start = timer()# find the mean score from the k-fold models usinf cross_val_score
kfold_scores = cross_val_score(lm_k, X, y, cv=10, scoring='neg_mean_squared_error')
print(kfold_scores.mean())
kfold_score_end = timer()
kfold_score_time = (kfold_score_end - kfold_score_start)# plot scores
sns.distplot(kfold_scores, bins=5)
输出为:
-0.5509524296956634
[外链图片转存失败,源站可能有防盗链机制,建议将图片保存下来直接上传(img-8S9DpX7r-1649681177644)(https://jialh.oss-cn-shanghai.aliyuncs.com/img/image-20220411193153819.png)]
你会注意到这个分数比hold-out方法离0稍微远一点(不好)。 我们稍后再讨论。
5. Leave One Out Cross Validation
Leave One Out Cross Validation (LOOCV)可以被认为是一种K-fold验证,其中k=n, n是给定数据集的行数。 除此之外,方法是相似的。 但是,您将注意到,运行下面的代码将比以前的方法花费更多的时间。 我们稍后再深入探讨。
让我们在相同的数据集上再测试,流程相同并改变k的值。
进行预测:
start_LOO = timer()
# generate LOO predictions
LOO_predictions = cross_val_predict(lm_k, X, y, cv=(len(X)))
end_LOO = timer()
LOO_time = (end_LOO - start_LOO)
绘制预测结果的图形:
# plot LOO predictions against actual
plot_LOO = sns.scatterplot(y, LOO_predictions)
plot_LOO.set(xlabel='Given', ylabel='Prediction')# generate and graph y = x line
x_plot = np.linspace(0,5,100)
y_plot = x_plot
plt.plot(x_plot, y_plot, color='r')
输出为:
[外链图片转存失败,源站可能有防盗链机制,建议将图片保存下来直接上传(img-IvPo4Oeb-1649681177645)(https://jialh.oss-cn-shanghai.aliyuncs.com/img/image-20220411193712375.png)]
产生平均打分:
LOO_score_start = timer()# find the mean score from the LOO models using cross_val_score
LOO_score = cross_val_score(lm_k, X, y, cv=(len(X)), scoring='neg_mean_squared_error').mean()
print(LOO_score)
LOO_score_end = timer()
LOO_score_time = (LOO_score_end - LOO_score_start)
让我们比较三种方法的运行时间和打分:
print("Hold out method took", time_ho, "seconds to generate a model and", ho_score_time ,"seconds to generate a MSE of", ho_score)print("K-Fold method took", kfold_time, 'seconds to generate a model and', kfold_score_time, 'seconds to generate a MSE of', kfold_scores.mean())print("Leave One Out Cross Validation method took", LOO_time, 'seconds to generate a model and', LOO_score_time, 'seconds to generate a MSE of', LOO_score)
输出为:
Hold out method took 0.03958953900000495 seconds to generate a model and 0.002666198000042641 seconds to generate a MSE of -0.5201754311947533K-Fold method took 0.07809067700000583 seconds to generate a model and 0.1253743699999177 seconds to generate a MSE of -0.5509524296956634Leave One Out Cross Validation method took 152.00629317099992 seconds to generate a model and 161.83364986200013 seconds to generate a MSE of -0.5282462043712458
让我们深入研究一下这些结果,以及前面提到的一些要点。
6. 不同模型验证方法的适用情况
正如我们在比较结果中所注意到的,我们可以看到LOOCV方法比其他两个方法需要更长的时间来完成。 这是因为该方法为数据集中的每一行创建和计算模型,在本例中为超过20,000。 尽管我们的MSE稍微低一些,但考虑到额外的计算要求,这样做可能并不值得。 这里有一些启发,可以帮助选择一种方法。
6.1 Hold out method
在非常大的数据集或者有限的计算资源上,holdout方法是有效的,且计算成本低。对于初学者来说。它也更容易实现和理解。然而,它很少适用于小型数据集,因为它会显著减少可用于训练的数据,并损害模型的性能。
6.2 K-Fold Cross Validation
K- fold在中等规模的数据集上非常有效,尽管通过调整K值可以显著改变验证结果。 让我们添加之前的规则; 随着k的增加,偏差减小,方差和计算需求增加。 K-Fold交叉验证可能是三种方法中最常见的,因为它具有调整k值的通用性。
6.3 LOOCV
Leave One Out Cross Validation (LOOCV)在小型数据集中最有用,因为它允许在每次迭代中从训练数据中删除最小数量的数据。 然而,在大型数据集中,为数据集中的每一行生成模型的过程可能会产生难以置信的计算成本,因此对于大型数据集来说是不可能的。
7. 不同模型验证方法的优点和缺点
7.1 Holdout Validation
在holdout验证中,我们只是执行一个简单的训练/测试分割,在这个分割中,我们将我们的模型适合我们的训练数据,并将其应用于我们的测试数据以生成预测值。 我们“保留”测试数据只用于严格的预测目的。 拒绝验证不是一种交叉验证技术。 但我们必须讨论模型评估的标准方法,以便将其属性与实际的交叉验证技术进行比较。
当涉及到代码时,拒绝验证很容易使用。 该实现很简单,不需要在计算能力和时间复杂度方面投入大量精力。 此外,我们可以更好地解释和理解holdout验证的结果,因为holdout验证不需要我们弄清楚迭代是如何执行的。
然而,在许多情况下,holdout验证并不能保持数据集的统计完整性。 例如,将数据分割成训练和测试部分的holdout验证由于没有将测试数据合并到模型中而导致了偏差。 测试数据可能包含一些重要的观察结果。 这将对模型的准确性造成损害。 此外,除了引入验证和/或训练误差之外,这将导致数据的欠拟合(underfiting)和过拟合(overfitting)。
7.2 K-fold Validation
在K-fold交叉验证中,我们回答了许多holdout验证固有的问题,如欠拟合(underfiting)和过拟合(overfitting)、验证和训练误差。 这是通过在某些迭代中使用验证集中的所有观察结果来实现的。 我们计算每k次迭代中计算的所有精度分数的平均精度分数。 通过这样做,我们最小化了可能出现在初步模型验证技术——holdout验证中的偏差和方差。
然而,就计算能力而言,k-fold交叉验证是非常昂贵的。 计算机必须进行几次迭代才能得到正确的分数。 理论上,模型的精度分数随着每增加k次迭代而增加。 这将减少偏差,同时增加variation。 当我们尝试将k-fold验证应用到包含大约58万个观测的非常大的数据集时,我们将在本文后面看到一个例子。
7.3 LOOCV
LOOCV 与 K-fold 非常相似,其中 是k 等于整个数据集的长度(或样本/行数)时的特殊情况。 因此,训练集的长度为 k-1,而测试集将是单个数据样本。 LOOCV 在我们的数据集特别小,不适合进行 K-fold 的情况下特别有用。 LOOCV 通常在计算上也非常昂贵,尽管它通常是倾向于在固有较小的数据集上使用。
然而,LOOCV 往往会产生高方差,因为该方法会通过单个测试值检测数据中所有可能的噪声和异常值。 对于非常大的数据集,LOOCV 的计算成本会非常高; 在这种情况下,最好使用常规的 k-fold。
8. 何时不需要使用交叉验证(cross validation)?
在处理大型数据集时,交叉验证成为一种昂贵且费力的模型评估方法。 由于验证方法必须以k - fold策略运行k次,遍历整个数据集,因此生成预测值的时间非常长。 因此,就时间复杂度而言,交叉验证成为一种非常昂贵的模型评估策略。 我们将在一个大约有58万行的非常大的数据集上, 执行普通的holdout验证和K-Fold交叉验证来检查这一现象。 看看你是否能弄明白它,为什么它会这样工作(以及新的数据可视化),并对任何问题进行评论。 好运!
8.1 K-fold交叉验证
# upload dataset from kaggle (we're using google colab here, adapt to your IDE)
from google.colab import files
uploaded = files.upload()# initialize data frame
df = pd.read_csv("covtype.csv")
print(df.head())
print(df.tail())# that's a lot of rows!
# notice that we use all features of our dataset so that we can illustrate how taxing cross validation will be
X=df.loc[:,'Elevation':'Soil_Type40']
y=df['Cover_Type']# some nan values happen to sneak into our dataset so we will fill them up
X = X.fillna(method='ffill')
y = y.fillna(method='ffill')# use a K-nearest neighbhors machine learning algorithm
neigh = KNeighborsClassifier(n_neighbors=5)# only with 200 folds are we able to generate an accuracy of 80%
neigh.fit(X,y)
kFoldStart = time.time()
y_pred = cross_val_predict(neigh, X, y, cv = 200)
kFoldEnd = time.time()
kFoldTime = kFoldEnd - kFoldStart
print("K Fold Validation Accuracy is ", accuracy_score(y, y_pred))# it takes 16 minutes to run the K-Fold cross validation!!!!
print(kFoldTime)
输出为:
K Fold Validation Accuracy is 0.8016822371999202
K-Fold Validation takes 1001.0495188236237 seconds
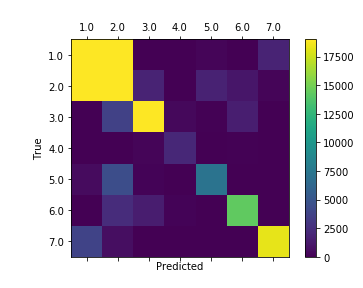
产生混淆矩阵的热图:
# generate a heatmap of a confusion matrix with predicted and true values of the type of trees
labels = [1.0, 2.0, 3.0, 4.0, 5.0, 6.0, 7.0]
cm = confusion_matrix(y_pred, y, labels)
print(cm)
fig = plt.figure()
ax = fig.add_subplot(111)
cax = ax.matshow(cm, vmin=0, vmax=19000)
fig.colorbar(cax)
ax.set_xticklabels([''] + labels)
ax.set_yticklabels([''] + labels)
plt.xlabel('Predicted')
plt.ylabel('True')
plt.show()
输出为:
[[166004 46040 27 0 243 43 1902]
[ 41396 225886 1919 4 1808 1156 293]
[ 59 3704 31832 442 143 1591 0]
[ 0 7 267 2119 0 124 0]
[ 539 4504 208 0 7251 68 5]
[ 50 2434 1501 182 44 14385 0]
[ 3792 726 0 0 4 0 18310]]
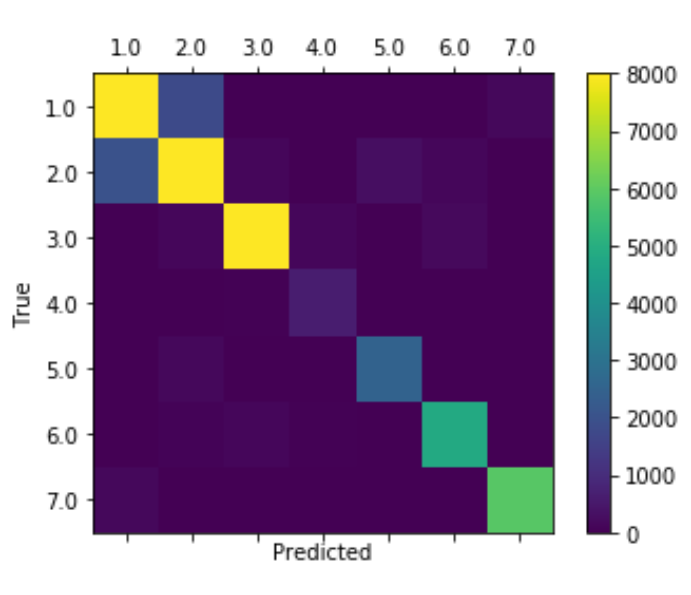
8.2 Holdout validation
# split our dataset into training and testing data
X_train, X_test, y_train, y_test = train_test_split(X,y, test_size=0.3, random_state=101)# some nan values happen to sneak into our dataset so we will fill them up
X_train = X_train.fillna(method='ffill')
y_train = y_train.fillna(method='ffill')# run the holdout validation and make predictions
# it takes only 30 seconds for a normal validation which is still pretty long
neigh.fit(X_train, y_train)
holdOutStart = time.time()
holdOutPredictions = neigh.predict(X_test)
holdOutEnd = time.time()
holdOutTime = holdOutEnd - holdOutStart
print("Hold Out Validation takes ", holdOutTime, " seconds")
print(accuracy_score(y_test, holdOutPredictions))# notice how much more accurate the holdout validation is compared to the k-fold cross validation
# generate a heatmap of a confusion matrix with predicted and true values of the type of trees
labels = [1.0, 2.0, 3.0, 4.0, 5.0, 6.0, 7.0]
cm = confusion_matrix(holdOutPredictions, y_test, labels)
print(cm)
fig = plt.figure()
ax = fig.add_subplot(111)
cax = ax.matshow(cm, vmin=0, vmax=8000)
fig.colorbar(cax)
ax.set_xticklabels([''] + labels)
ax.set_yticklabels([''] + labels)
plt.xlabel('Predicted')
plt.ylabel('True')
plt.show()
9. Key Terms
Model Validation: Any process by which a generated model is verified against additional data not used in the process of generating the model. E.g. cross validation, K-Fold validation, hold out validation, etc.
Cross Validation: A type of model validation where multiple subsets of a given dataset are created and verified against each-other, usually in an iterative approach requiring the generation of a number of separate models equivalent to the number of groups generated.
K-Fold Cross Validation: A type of cross validation where a given dataset is split into k number of groups and k number of models are generated. One of the groups is chosen as the test data, and the other k-1 groups are used as training data, and model generated and scored. This process is repeated k times such that each k-fold (group) serves as the testing group once.
LOOCV: A type of cross validation similar to K-Fold validation, where k is equal to the length of the dataset which the validation is being performed on.
Bias: The error resulting from the difference between the expected value(s) of a model and the actual (or “correct”) value(s) for which we want to predict over multiple iterations. In the scientific concepts of accuracy and precision, bias is very similar to accuracy.
Variance: The error resulting from the variability between different data predictions in a model. In variance, the correct value(s) don’t matter as much as the range of differences in value between the predictions. Variance also comes into play more when we run multiple model creation trials.
Under fit: Occurs when the model is so tightly fit to the training data that it may account for random noise or unwanted trends which will not be present or useful in predicting targets for subsequent datasets.
Over fit: Occurs when the model is not complex enough to account for general trends in the data which would be useful in predicting targets in subsequent datasets, such as using a linear fit on a polynomial trend.
Bias-Variance Trade-off: The idea that as error due to bias decreases error due to variance increases, creating a trade-off which should be minimized in model validation, and other circumstances.
三种模型验证方法:holdout, K-fold, leave one out cross validation(LOOCV)相关推荐
- 执行:三种闭环验证方法,保证执行不走样
今天我要跟你分享的主题是:打造品质,要从头开始"闭环".在正式开讲之前,我想先和你分享一个小故事. 学习场景:"这--不是我想要的!" 这天,我在公司走廊上碰到 ...
- 【小白学习keras教程】十、三种Model Selection方法:k-fold cross-validation,GridSearchCV和RandomizedSearchCV
@Author:Runsen Model Selection是划分训练集和测试集的手段,下面总结了三种Model Selection方法. k-fold cross-validation using ...
- Javascript事件模型系列(一)事件及事件的三种模型
一.开篇 在学习javascript之初,就在网上看过不少介绍javascript事件的文章,毕竟是js基础中的基础,文章零零散散有不少,但遗憾的是没有看到比较全面的系列文章.犹记得去年这个时候,参加 ...
- bert模型可以做文本主题识别吗_NLP之文本分类:「Tf-Idf、Word2Vec和BERT」三种模型比较...
字幕组双语原文:NLP之文本分类:「Tf-Idf.Word2Vec和BERT」三种模型比较 英语原文:Text Classification with NLP: Tf-Idf vs Word2Vec ...
- Java 三种模型,四种策略
Java 三种模型,四种策略 (转) 混淆事务模型与事务策略是一个常见的错误.本系列关于 事务策略 的第二篇文章将概述 Java™ 平台支持的三种事务模型,并介绍使用这些模型的四种主要事务策略.通过使 ...
- ML之Validation:机器学习中模型验证方法的简介、代码实现、案例应用之详细攻略
ML之Validation:机器学习中模型验证方法的简介.代码实现.案例应用之详细攻略 目录 模型验证方法的简介 1.Hold-out验证 2.K-折交叉验证 3.自助重采样 模型验证方法的代码实现 ...
- ASP.NET几种安全验证方法(一)
ASP.NET几种安全验证方法(一) 如何运用 Form 表单认证 ASP.NET 的安全认证,共有"Windows""Form""Passport& ...
- word2vec模型评估_NLP之文本分类:「Tf-Idf、Word2Vec和BERT」三种模型比较
字幕组双语原文:NLP之文本分类:「Tf-Idf.Word2Vec和BERT」三种模型比较 英语原文:Text Classification with NLP: Tf-Idf vs Word2Vec ...
- 运用自回归滑动平均模型、灰色预测模型、BP神经网络三种模型分别预测全球平均气温,并进行预测精度对比(附代码、数据)
大家好,我是带我去滑雪,每天教你一个小技巧!全球变暖是近十年来,人们关注度最高的话题.2022年夏天,蔓延全球40℃以上的极端天气不断刷新人们对于高温的认知,人们再也不会像从前那样认为全球变暖离我们遥 ...
- 机器学习番外篇—朴素贝叶斯三种模型(多项式,高斯,伯努利)
朴素贝叶斯三种模型(多项式,高斯,伯努利) 高斯 有些特征可能是连续型变量,比如说人的身高,物体的长度,这些特征可以转换成离散型的值,比如如果身高在160cm以下,特征值为1:在160cm和170cm ...
最新文章
- 谷歌Android各版本的代号变迁
- web前端url传递值 js加密解密
- BZOJ 1191 [HNOI2006]超级英雄Hero
- list 分页_mybatis一对多分页查询
- 学安全测试需要多少钱?安全测试培训费一般多少?
- vscode中怎样格式化js代码_vscode如何格式化代码
- python爬取豆瓣电影top250网络响应_python使用requests+re爬取豆瓣电影top250简单入门爬虫...
- 大数据第三季--zk(day1)-徐培成-专题视频课程
- 苹果电脑计算机找不到打印机,在苹果电脑上连接打印机可以这样操作
- Policy Gradient (PG)与Proximal Policy Optimization (PPO)算法详解
- 我的世界php motd,MiniMOTD - 服务器列表带有RGB渐变的MOTD插件[1.12.x-1.16.x]【Bukkit】...
- 拆分一个链表为偶数链表和奇数链表
- WMS系统是什么——史上最全WMS介绍
- 你已经是智能机器人,该上岗新基建了
- 计算机网络第七版 谢希仁 3-33答案
- WPF编程;上位机编程;C#编程;仿QQ基础实现(一)之界面预览
- 扶苏的bitset浅谈
- Pycharm配置环境本地训练yolov5(车辆检测)
- C语言----结构体及其应用
- postgresql分库分表中间件开源实现方案