样本均值的抽样分布_抽样分布样本均值
样本均值的抽样分布
One of the most important concepts discussed in the context of inferential data analysis is the idea of sampling distributions. Understanding sampling distributions helps us better comprehend and interpret results from our descriptive as well as predictive data analysis investigations. Sampling distributions are also frequently used in decision making under uncertainty and hypothesis testing.
在推论性数据分析的背景下讨论的最重要的概念之一是采样分布的想法。 了解采样分布有助于我们更好地理解和解释描述性和预测性数据分析调查的结果。 抽样分布也经常用于不确定性和假设检验的决策中。
什么是抽样分布? (What are sampling distributions?)
You may already be familiar with the idea of probability distributions. A probability distribution gives us an understanding of the probability and likelihood associated with values (or range of values) that a random variable may assume. A random variable is a quantity whose value (outcome) is determined randomly. Some examples of a random variable include, the monthly revenue of a retail store, the number of customers arriving at a car wash location on any given day, the number of accidents on a certain highway on any given day, weekly sales volume at a retail store, etc. Although the outcome of a random variable is random, the probability distribution allows us to gain and understanding about the likelihood and probabilities of different values occurring in the outcome. Sampling distributions are probability distributions that we attach to sample statistics of a sample.
您可能已经熟悉概率分布的概念。 概率分布使我们对与随机变量可能采用的值(或值的范围)相关的概率和似然性有所了解。 随机变量是其值(结果)是随机确定的数量。 随机变量的一些示例包括:零售商店的月收入,在任何给定的一天到达洗车地点的顾客数量,在任何给定的一天在特定高速公路上发生的事故数量,在零售店的每周销量尽管随机变量的结果是随机的,但概率分布使我们获得并了解结果中出现的不同值的可能性和概率。 抽样分布是我们附加到样本的样本统计量的概率分布。
样本均值作为样本统计量 (Sample mean as a sample statistic)
A sample statistic (also known simply as a statistic) is a value learned from a sample. Here is an example, suppose you collect the results of a survey filled out by 250 randomly selected individuals who live in a certain neighborhood. Based on the survey results you realize that the average annual income of the individuals in this sample is $82,512. This is a sample statistic and is denoted by x̅ = $82,512. The sample mean is also a random variable (denoted by X̅) with a probability distribution. The probability distribution for X̅ is called the sampling distribution for the sample mean. Sampling distribution could be defined for other types of sample statistics including sample proportion, sample regression coefficients, sample correlation coefficient, etc.
样本统计量(也简称为统计量)是从样本中学到的值。 这是一个示例,假设您收集由居住在某个社区中的250个随机选择的个人填写的调查结果。 根据调查结果,您会发现此样本中的个人平均年收入为$ 82,512。 这是一个样本统计量,用x̅= $ 82,512表示。 样本均值也是具有概率分布的随机变量(用X表示)。 X̅的概率分布称为样本均值的采样分布。 可以为其他类型的样本统计定义样本分布,包括样本比例,样本回归系数,样本相关系数等。
You might be wondering why X̅ is a random variable while the sample mean is just a single number! The key to understanding this lies in the idea of sample to sample variability. This idea refers to the fact that samples drawn from the same population are not identical. Here’s an example, suppose in the example above, instead of conducting only one survey of 250 individuals living in a particular neighborhood, we conducted 35 samples of the same size in that neighborhood. If we calculated the sample mean x̅ for each of the 35 samples, you would be getting 35 different values. Now suppose, hypothetically, we conducted many many surveys of the same size in that neighborhood. We would be getting many many (different) values for sample means. The distribution resulting from those sample means is what we call the sampling distribution for sample mean. Thinking about the sample mean from this perspective, we can imagine how X̅ (note the big letter) is the random variable representing sample means and x̅ (note the small letter) is just one realization of that random variable.
您可能想知道为什么X̅是一个随机变量,而样本均值只是一个数字! 理解这一点的关键在于样本之间的差异性 。 这个想法指的是从相同总体中抽取的样本不完全相同的事实。 这是一个示例,假设在上面的示例中,我们没有对居住在特定社区中的250个人进行一次调查,而是在该社区中进行了35个相同大小的样本。 如果我们为35个样本中的每个样本计算样本均值x̅ ,您将获得35个不同的值。 现在假设,我们在该邻里进行了许多相同规模的调查。 我们将获得许多(不同)样本均值值。 由这些样本均值得出的分布就是所谓的样本均值的采样分布。 从这个角度考虑样本均值,我们可以想象X̅(注意大字母)是代表样本均值和x̅ (注意小字母)的随机变量的方式。 只是该随机变量的一种实现。
样本均值的抽样分布 (Sampling distribution of the sample mean)
Assuming that X represents the data (population), if X has a distribution with average μ and standard deviation σ, and if X is approximately normally distributed or if the sample size n is large,
假设X代表数据(种群),如果X具有平均μ和标准差σ的分布,并且X近似呈正态分布,或者样本量n大,
The above distribution is only valid if,
以上分配仅在以下情况下有效:
X is approximately normal or sample size n is large, and,
X近似正常或样本大小n大,并且,
- the data (population) standard deviation σ is known.数据(种群)标准偏差σ是已知的。
If X is normal, then X̅ is also normally distributed regardless of the sample size n. Central Limit Theorem tells us that even if X is not normal, if the sample size is large enough (usually greater than 30), then X̅’s distribution is approximately normal (Sharpe, De Veaux, Velleman and Wright, 2020, pp. 318–320). If X̅ is normal, we can easily standardize and convert it to the standard normal distribution Z.
如果X是正态的,则X′也将呈正态分布,而与样本大小n无关。 中心极限定理告诉我们,即使X不是正态的,如果样本量足够大(通常大于30),则X的分布近似正态(Sharpe,De Veaux,Velleman和Wright,2020年,第318-320页) )。 如果X̅是正态的,我们可以轻松地将其标准化并将其转换为标准正态分布Z。
If the population standard deviation σ is not known, we cannot assume that the sample mean X̅ is normally distributed. If certain conditions are satisfied (explained below), then we can transform X̅ to another random variable t such that,
如果总体标准差σ是不知道,我们不能假设样本均值的正态分布。 如果满足某些条件(如下所述),那么我们可以将X transform转换为另一个随机变量t,这样,
The random variable t is said to follow the t-distribution with n-1 degrees of freedom, where n is the sample size. The t-distribution is bell-shaped and symmetric (just like the normal distribution) but has fatter tails compared to the normal distribution. This means values further away from the mean have a higher likelihood of occurring compared to that in the normal distribution.
据说随机变量t跟随t分布具有n-1个自由度,其中n是样本大小。 t分布呈钟形且对称(就像正态分布一样),但与正态分布相比,其尾部更胖。 这意味着与正态分布相比,远离平均值的值出现的可能性更高。
The conditions to use the t-distribution for the random variable t are as follows (Sharpe et al., 2020, pp. 415–420):
将t分布用于随机变量t的条件如下(Sharpe等人,2020年,第415-420页):
If X is normally distributed, even for small sample sizes (n<15), the t-distribution can be used.
如果X是正态分布的,即使对于小样本量( n < 15),也可以使用t分布。
- If the sample size is between 15 and 40, the t-distribution can be used as long as X is unimodal and reasonably symmetric.如果样本大小在15到40之间,则只要X是单峰且合理对称,就可以使用t分布。
- For sample sizes greater than 40, the t-distribution can be used unless X’s distribution is heavily skewed.对于大于40的样本,除非X的分布严重偏斜,否则可以使用t分布。
用Python模拟 (Simulation with Python)
Let’s draw a sample of size n=250 from the normal distribution. Here we are assuming that our data is normally distributed and has parameters μ = 20 and σ = 3. Collecting one sample from this population
让我们从正态分布中绘制一个大小为n = 250的样本。 这里我们假设我们的数据是正态分布的,并且参数μ= 20和σ=3。从该总体中收集一个样本
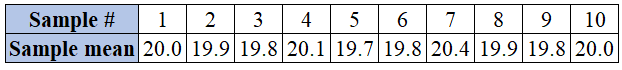
Running this code once gives me one instance (or realization) of the random variable X̅. Below are 10 values for x̅ after I ran this code 10 times.
运行此代码一次,便为我提供了随机变量X̅的一个实例(或实现)。 在我运行此代码10次后,下面是x̅的 10个值。
But if I ran this code 10,000 times and recorded the values of x̅ and plotted the frequency (or density) of the values, I would get the following result.
但是,如果我运行此代码10,000次并记录了x values的值并绘制了这些值的频率(或密度),我将得到以下结果。
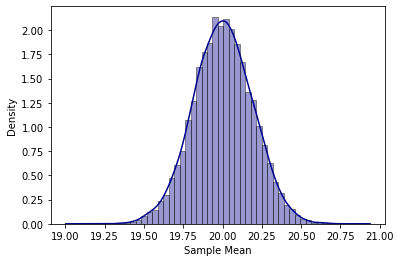
As you can see, the distribution is approximately symmetric and bell-shaped (just like the normal distribution) with an average of approximately 20 and a standard error that is approximately equal to 3/sqrt(250) = 0.19.
如您所见,分布近似对称且呈钟形(就像正态分布一样),平均分布约20,标准误差约等于3 / sqrt(250)= 0.19。
Sampling from the same population with different sample sizes will result in different measures of spread in the outcome distribution. As we expect, increasing the sample size will reduce the standard error and therefore, the distribution will be narrower around its average. Note that the distribution of X̅ is normal even for extremely small sample sizes. This is because X is normally distributed.
从具有不同样本量的同一总体中进行采样将导致结果分布中差异的度量不同。 正如我们所期望的,增加样本量将减少标准误差,因此,分布将在其平均值附近变窄。 请注意,即使样本量非常小,X̅的分布也是正常的。 这是因为X是正态分布的。
如果总体(数据)不正常怎么办? (What if the population (data) is not normal?)
No worries! Even if your data is not normally distributed, if the sample size is large enough, the distribution of X̅ can still be approximated using the normal distribution (according to Central Limit Theorem). The following figure shows the distribution of X̅ when X is heavily skewed to the left. As you can see, X̅’s distribution tends to mimic the distribution of X for small sample sizes. However, as sample size grows the distribution of X̅ becomes more symmetric and bell-shaped. As mentioned above, if sample size is large (usually larger than 30), X̅’s distribution is approximately normal regardless of what the distribution of X is.
别担心! 即使您的数据不是正态分布的,如果样本量足够大,仍可以使用正态分布(根据中心极限定理)来近似估计X̅的分布。 下图显示了X严重偏向左侧时X̅的分布。 如您所见,对于小样本量,X̅的分布趋向于模仿X的分布。 但是,随着样本量的增加,X 1的分布变得更加对称和呈钟形。 如上所述,如果样本量较大(通常大于30),则X的分布近似为正态,而与X的分布无关。
示例和应用 (Example and applications)
Knowing the distribution of X̅ can help us solve problems, where we need to use inferential data analysis to make decisions under uncertainty. Many business problems require decision making tools that are able to address the stochastic and probabilistic nature of random event. Hypothesis testing is one of those tools frequently used in many different business domains including retail operations, marketing, quality assurance, etc.
知道X̅的分布可以帮助我们解决问题,在这种情况下,我们需要使用推断数据分析来在不确定的情况下做出决策。 许多业务问题都需要决策工具,这些工具必须能够解决随机事件的随机性和概率性。 假设检验是许多不同业务领域(包括零售运营,市场营销,质量保证等)中经常使用的工具之一。
For example, suppose a retail store has run a major marketing campaign and is interested to investigate the effects of the campaign on average sales of the store. Suppose that the management would like to investigate if average daily sales is now greater than $8,000. The following hypotheses demonstrate this research question:
例如,假设一家零售商店进行了一次大规模的营销活动,并且有兴趣调查该活动对商店平均销售额的影响。 假设管理层想调查现在的平均每日销售额是否大于8,000美元。 以下假设证明了该研究问题:

Note that we are conducting a test on the population average sales, hence the μ. To address the test, suppose we record sales volumes over 40 days (sample with n=40) and calculate the required statistics. Suppose the average and standard deviation of daily sales volumes are calculated as x̅=$8,100 and s=$580, respectively. Since the value of σ is not known, and given that the above hypothesis test is being addressed, we can convert X̅ to the random variable t with n-1=39 degrees of freedom where,
请注意,我们正在对人口平均销售额(即μ)进行测试。 为了进行测试,假设我们记录了40天的销售量( n = 40的样本)并计算所需的统计数据。 假设每日销售量的平均偏差和标准偏差分别计算为x̅= $ 8,100和s = $ 580 。 由于σ的值未知,并且鉴于上述假设检验正在解决,我们可以将X̅转换为n-1 = 39自由度的随机变量t ,其中,

To address the test, we need to find the p-value associated with the test. This property is calculated as,
要处理该测试,我们需要找到与该测试关联的p值。 此属性的计算公式为
The probability density function for the random variable t along with the p-value of the test are depicted below.
下面描述了随机变量t的概率密度函数以及检验的p值。
The following will find the p-value for the test.
以下将找到测试的p值。
The calculations give a p-value equal to approximately 0.14. By most standards (significance levels), this is a large p-value indicating that we fail to reject the null hypothesis. In other words, based on the distribution of X̅ and the sample collected, we cannot conclude that the average daily sales volume at the retail store, μ, is greater than $8000. This calculation was possible only because we knew what the distribution of X̅ was.
计算得出的p值大约等于0.14。 按照大多数标准(显着性水平),这是一个很大的p值,表明我们无法拒绝原假设。 换句话说,根据X的分布和收集的样本,我们不能得出结论,零售商店的平均日销售量μ大于$ 8000。 仅因为我们知道X̅的分布是什么,才可能进行此计算。
Sampling distributions could be defined for other sample statistics (e.g., sample proportions, regression predictor coefficients, etc.) and are also used in other contexts like confidence and prediction intervals or inferential analysis on regression results.
可以为其他样本统计数据(例如,样本比例,回归预测系数等)定义采样分布,也可以在其他情况下使用采样分布,例如置信度和预测区间或对回归结果进行推论分析。
[1]: Sharpe N. R., De Veaux R. D., Velleman P. F., Wright D. (2020) Business Statistics, Fourth Canadian Edition. Pearson Canada Inc.
[1]:Sharpe NR,De Veaux RD,Velleman PF,Wright D.(2020) 商业统计,加拿大第四版 。 培生加拿大公司
翻译自: https://towardsdatascience.com/sampling-distribution-sample-mean-fcf69484535e
样本均值的抽样分布
http://www.taodudu.cc/news/show-2024563.html
相关文章:
- 2022上海Java工资收入概览
- 年龄和收入对数的线性回归_(CFA教材详解)数量分析:线性回归模型的规范及常见错误...
- 网络工程师(软考)学习笔记6--传输介质
- 工程造价管理
- 软件工程造价师好考吗?
- python在工程造价的作用_工程预算的意义何在
- python对工程造价有用吗_工程造价真的不行了吗?
- 软件工程 第4版张海藩 pdf_2019年第4期软件工程造价师培训课程圆满结束
- 计算机 考 二级结构工程师,下半年河北省结构工程师二级专业结构:计算机软件的组成及功能考试试题.doc...
- 2022-2027年(新版)中国工程造价咨询行业现状动态与未来前景预测报告
- 铁路车辆工程使用计算机软件,铁路车辆工程论文
- vc设备工程师_工程/设备工程师简历工作经历填写样本
- 国家标准《软件工程 软件开发成本度量规范》GB/T 36964-2018正式发布
- 硬件工程师笔试题集
- 工程造价步骤_史上最全造价工作流程,全了
- 一级造价工程师(安装)- 案例笔记
- 软件是计算机程序的总和 主要分为,2014年造价师考试安装工程专业讲义:计算机控制...
- 【CSDN软件工程师能力认证学习精选】Python网络编程之初识
- 软件工程经济学作业5-7
- “2016年度优秀软件工程造价师”“工信部行业标准《软件研发成本度量规范》2016年度应用示范单位” 评选活动正式启动...
- 【面试】造价工程师面试试题汇总
- 【课程总结】软件工程经济学简答题总结
- python与工程造价的联系_终于知道工程造价专业面试技巧
- 软件工程概述
- 2017年度优秀软件工程造价师等评选通知
- “软件工程造价师”和“软件造价评估师”有什么区别?
- 软件工程造价是做什么的?
- 软件工程造价师和软件造价评估师有什么区别?
- 软件工程造价师有用吗?
- 藏在耳机里的小东西——蓝牙天线
样本均值的抽样分布_抽样分布样本均值相关推荐
- 概论第6章_正态总体的抽样分布_卡方分布_F分布_t分布
一 卡方分布 定义 设 X 1 , X 2 , . . . , X n X_1, X_2,..., X_n X1,X2,...,Xn 独立同分布于标准正态分布N(0, 1), 则 χ 2 = X ...
- 概论第6章_正态总体的抽样分布_样本均值的期望与样本方差的期望__方差的期望
下面的定理给出 样本均值的期望, 方差的期望, 样本方差的期望, 它 不依赖于总体的分布形式. 一. 定理: 假设有总体X, 均值 μ\muμ, E(X)=μ\muμ, 有方差 σ2\sigma^2σ ...
- t分布f分布与样本均值抽样分布_分布模拟1——MCMC抽样方法
分布是一系列数字的规律组合.如果在收集了历史中的几百个数据后,我想知道这群数据背后的发射机制是什么,那么就得去寻找这个分布.当然这里的重点不是寻找分布,而是在已知分布的情况下,如何模拟这个机制发射出来 ...
- 两个卡方分布之和_正态分布样本均值和样本方差的独立性
前记:假期开始后,主要精力放在了科研上,最近终于抽点时间写点更新. 在数理统计的学习中,有一个重要的结论,即对于正态分布而言,样本均值和样本方差是独立的.这个结论初看起来是有些让人吃惊的,因为直观上样 ...
- python 样本均值t检验_假设检验与单样本T检验(上)
假设检验与单样本T检验(上)假设检验与单样本T检验(上)假设检验与单样本T检验(上) 响应输出 大多数情况,我们不需要关注Response对象本身,只需要在控制器的操作方法中返回数据即可. 最简单的响 ...
- 样本均值的抽样分布的均值问题
声明: 仅仅个人小记 为什么用样本均值来作为总体均值的估计? 这样真的好吗?如果好,到底好到什么程度. 目的 本文用来解释下面这句话(本人对下面这句话的逻辑一开始是不接受的,故而写文记录,以分享个人的 ...
- python按指定概率抽样_基于python进行抽样分布描述及实践详解
本次选取泰坦尼克号的数据,利用python进行抽样分布描述及实践. 备注:数据集的原始数据是泰坦尼克号的数据,本次截取了其中的一部分数据进行学习.Age:年龄,指登船者的年龄.Fare:价格,指船票价 ...
- [统计学笔记](五)统计量及其抽样分布
统计量 统计学中最主要的提取信息的方式就是对原始数据进行一定的运算,得出某些代表性的数字,以反映数据某些方面的特征,这种数字称为统计量.用统计学的语言表述就是:统计量是样本的函数,它不依赖于任何未知参 ...
- 常用的统计量及其对应的抽样分布(python)
1.样本均值 设 x1,x2,⋯,xn为取自某总体的样本, 其算术平均值称为样本均值,一 般用表示,即 如果把样本中的数据与样本均值的差称为偏差, 则样本所有偏差之和为 0, 即 # 从总体/总体的分 ...
- 数据挖掘--统计学模块 05 抽样分布
文章目录 抽样分布 楔子 大数法则 中心极限定理 自助法 抽样分布: Z分布和T分布: 卡方分布和F分布 卡方分布 F分布 从抽样分布到置信区间 抽样分布 统计量:样本均值.样本方差.样本变异系数.样 ...
最新文章
- 学习如何用平板电脑设计和绘制自己的动漫角色
- mysql主从出现异常,处理方法
- 软件测试2019:第四次作业
- 0729------Linux网络编程----------使用 select 、poll 和 epoll 模型 编写客户端程序
- java 获取nodejs端Gson数据案例(请求MongoDB)
- 【CSDN】Markdown 如何画分界线
- [转载] 杜拉拉升职记——15 1001个笑话
- 关于QSqlTableModel的使用说明(QT上创建本地SQL)
- 05丨深入浅出索引(下)
- mysql整点抖动_MySQL 5.5 大量数据插入出现的抖动问题 及 解决方法
- android 横向stepview,Android 流程指示器 StepView
- Flash网站流量统计的方法
- bat代码雨代码流星_bat-入门系列-03-判断结构2
- pajek软件使用方法_双全科技|管家婆管理库存必备“序列号”,管家婆软件的使用方法...
- ubuntu下唤醒或休眠远程计算机
- 2021赣一中高考成绩查询,赣州中学2021年高一招生问答
- ckEditor使用JS代码调用的方法
- Eclipse里面导工程的时候报错faceted project problem
- python属于低级语言还是高级语言,【单选题】Python语言属于 A. 机器语言 B. 汇编语言 C. 高级语言 D. 科学计算语言...
- 如何零基础入门PS软件?