power bi 参数_参数化Power BI报表入门
power bi 参数
In this article, I am going to explain how we can develop parameterized Power BI reports locally and then migrate the same report across multiple environments, like development, QA, and production. Parameterized Power BI reports are essential because we can use the same report to develop the charts and the KPIs and then provide the same report to the QA who will test it on a separate environment and finally when the testing is completed, it can then maybe provided to an administrator who can publish it to the production workspace.
在本文中,我将解释我们如何在本地开发参数化的Power BI报表,然后在多个环境(例如开发,QA和生产)中迁移同一报表。 参数化Power BI报告必不可少,因为我们可以使用相同的报告来开发图表和KPI,然后将相同的报告提供给QA,QA将在单独的环境中对其进行测试,最后在测试完成时可以提供该报告。可以将其发布到生产工作区的管理员。
To develop parameterized Power BI reports, we would need to parameterize our data source connection in the Power BI reports while establishing the connection to the source databases. Another important thing to keep in mind for this is to have the source database schema the same across all the environments. This means that the structure of the tables and relationships in the databases must be the same in all the environments. If there are any discrepancies within the schema then the Power BI reports will fail and no longer work as intended.
要开发参数化的Power BI报表,我们需要在建立与源数据库的连接时在Power BI报表中参数化数据源连接。 要记住的另一件重要事情是在所有环境中使源数据库架构相同。 这意味着在所有环境中,表的结构和数据库中的关系必须相同。 如果架构中存在任何差异,则Power BI报告将失败并且不再按预期工作。
准备数据库环境 (Preparing the Database Environment)
To develop parameterized Power BI reports, we would need to have three different data sources from which we can fetch data into the Power BI environment. Let us now go ahead and prepare our database environment first. In the database server, we are going to create three different databases, one for each development, QA, and production environments. Although in a real scenario, the servers and the databases will be in complete isolation, however, for the sake of this tutorial, we will keep the databases in the same server itself. Head over to SQL Server Management Studio and create the databases. I am going to call the databases as “SQLShackDemo_DEV”, “SQLShackDemo_QA” and “SQLShackDemo_PROD”. You can run the following script to create the databases on your machine:
要开发参数化的Power BI报表,我们需要有三个不同的数据源,我们可以从中获取数据到Power BI环境中。 现在让我们继续并首先准备我们的数据库环境。 在数据库服务器中,我们将创建三个不同的数据库,每个数据库分别用于开发,质量保证和生产环境。 尽管在实际情况下,服务器和数据库将完全隔离,但是,出于本教程的考虑,我们将数据库保留在同一服务器本身中。 转到SQL Server Management Studio并创建数据库。 我将这些数据库称为“ SQLShackDemo_DEV ”,“ SQLShackDemo_QA ”和“ SQLShackDemo_PROD ”。 您可以运行以下脚本在计算机上创建数据库:
-- Creating the databases
CREATE DATABASE SQLShackDemo_DEV
GO
CREATE DATABASE SQLShackDemo_QA
GO
CREATE DATABASE SQLShackDemo_PROD
GO
Figure 1 – Creating the databases
图1 –创建数据库
Once the databases are created, let us go ahead and create the tables in it for development, QA, and production. To keep things simple, I am going to add a table called “FactSales” and add only one column “TotalSalesAmount” to all the three tables in the databases. You can add as many tables and columns as you want. Please note that it is extremely mandatory to have the schema exactly the same for the three databases or data sources in order to parameterize the data sources. If the schema is not the same, then the parameterized Power BI report would not be able to fetch the data and hence fail while refreshing the reports. You can use the script below to create the three tables under the databases and insert some test data into it:
创建数据库后,让我们继续在其中创建表以进行开发,质量检查和生产。 为简单起见 ,我将添加一个名为“ FactSales ”的表,并仅向数据库中的所有三个表添加一列“ TotalSalesAmoun t ”。 您可以根据需要添加任意数量的表和列。 请注意, 将三个数据库或数据源的模式完全相同是非常强制性的 ,以便参数化数据源。 如果架构不同,则参数化的Power BI报告将无法获取数据,因此刷新报告时将失败。 您可以使用以下脚本在数据库下创建三个表并将一些测试数据插入其中:
-- Create the tables under each database
USE SQLShackDemo_DEV
GO
CREATE TABLE FactSales(TotalSalesAmount INT
)
GOUSE SQLShackDemo_QA
GO
CREATE TABLE FactSales(TotalSalesAmount INT
)
GOUSE SQLShackDemo_PROD
GO
CREATE TABLE FactSales(TotalSalesAmount INT
)
GO-- Insert sample data into the tables
INSERT INTO SQLShackDemo_DEV.dbo.FactSales  VALUES (100)
INSERT INTO SQLShackDemo_QA.dbo.FactSales   VALUES (800)
INSERT INTO SQLShackDemo_PROD.dbo.FactSales VALUES (5000)
With this, we have completed our database development. Now let us move to the Power BI Report development.
至此,我们完成了数据库开发。 现在,让我们转到Power BI Report开发。
开发Power BI报告 (Developing the Power BI Report)
Now that our database environment has been set up, we are ready to start working on the Power BI report. Open Power BI Desktop and click on File. On the menu that appears, select Options and settings, and then select Options. The Options dialog box opens up. Under the Global pane on the left, click on Power Query Editor, and under the Parameters heading, select the checkbox which says, “Always allow parameterization in data source and transformation dialogs”. Click on OK once done:
现在我们的数据库环境已经设置好,我们准备开始处理Power BI报告。 打开Power BI Desktop,然后单击“ 文件” 。 在出现的菜单上,选择选项和设置,然后选择选项 。 将打开“ 选项”对话框。 在左侧的“ 全局”窗格下,单击Power Query编辑器,然后在“ 参数”标题下,选中显示“ 始终允许在数据源和转换对话框中进行参数化 ”的复选框。 完成后单击“ 确定” :
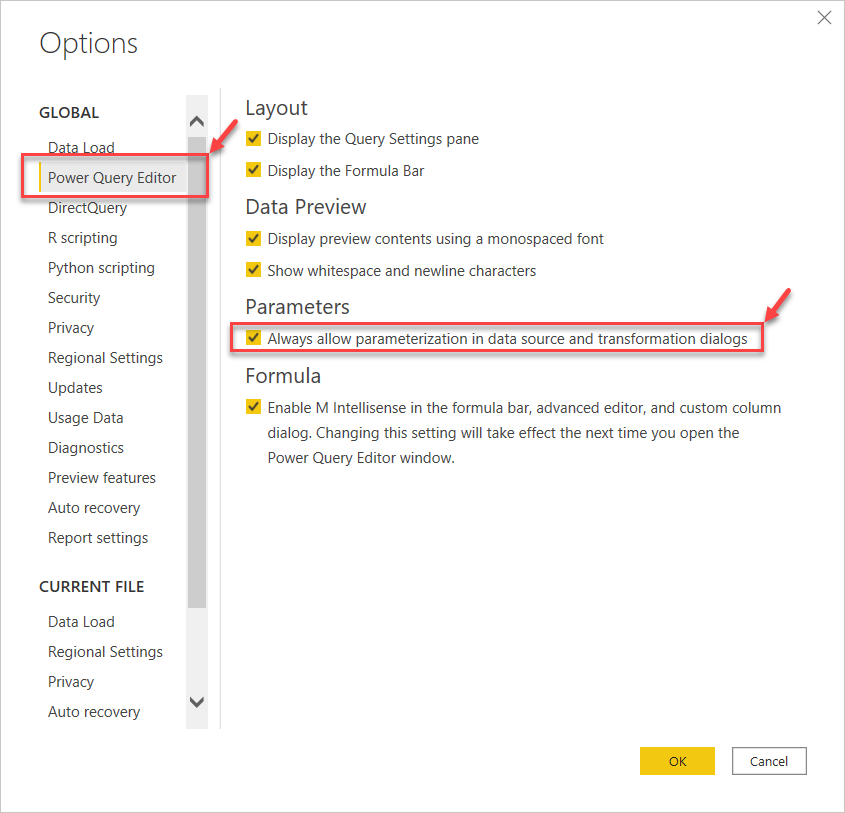
Figure 2 – Enabling the parametrization in Power BI Desktop
图2 –在Power BI Desktop中启用参数化
Once the parametrization of data sources is enabled, let start to bring in the data from the SQL Server. Click on Get Data and select SQL Server from the drop-down menu:
一旦启用了数据源的参数化,就开始从SQL Server引入数据。 单击获取数据,然后从下拉菜单中选择SQL Server :
Figure 3 – Fetching data from SQL Server into Power BI
图3 –从SQL Server提取数据到Power BI
Now as you can see, we have a drop-down box available to specify if the data source is a simple text value or it is a parameter. Since we want to parameterize our data source, we will go ahead and select the New Parameter from the drop-down menu and click OK:
现在您可以看到,我们有一个下拉框可用于指定数据源是简单文本值还是参数。 由于我们要参数化数据源,因此我们将继续,然后从下拉菜单中选择“ 新参数 ”,然后单击“ 确定” :
Figure 4 – Selecting New Parameter for data source
图4 –为数据源选择新参数
The Manage Parameters dialog box opens up. In this, you can name your parameters and provide values for the connection string as well. Since we are going to parameterize our data source, let us name this as “DataSource” and enter the Current Value as “localhost”. You need to provide the name of your server on which the database is created. Click OK once done:
将打开“ 管理参数”对话框。 在这种情况下,您可以命名参数并为连接字符串提供值。 由于我们要参数化数据源,因此我们将其命名为“ DataSource ”,然后将“ Current Value”输入为“ localhost ”。 您需要提供在其上创建数据库的服务器的名称。 完成后单击“ 确定” :
Figure 5 – Specifying the Data Source Parameter
图5 –指定数据源参数
Repeat the same for specifying the catalog name as a parameter. Provide the name of the development database as the Current Value. Click OK once done:
重复相同的操作以将目录名称指定为参数。 提供开发数据库的名称作为“ 当前值” 。 完成后单击“ 确定” :
Figure 6 – Specifying Catalog Name as the parameter
图6 –指定目录名称作为参数
Finally, select Data Connectivity mode as Import and click on OK. This will bring in the data from the SQL Server into the parameterized Power BI report:
最后,选择数据连接模式作为导入 ,然后单击确定 。 这会将来自SQL Server的数据带入参数化的Power BI报告:
Figure 7 – Import Data
图7 –导入数据
Once the connection is established with the SQL Server database, you will see and option to import the tables that you need to import. Since we have only one table, we will go ahead and fetch it into Power BI. Click Load once done:
与SQL Server数据库建立连接后,您将看到和选项来导入需要导入的表。 由于只有一张桌子,我们将继续将其取入Power BI。 单击完成后加载 :
Figure 8 – Fetch data from FactSales
图8 –从FactSales获取数据
Since we have only one field in the table (TotalSalesAmount), let us create a card visual to display the value. In the development environment, we have inserted the value as “100” which is visible in the report as follows.
由于表中只有一个字段( TotalSalesAmount ),因此让我们创建可视化卡片以显示该值。 在开发环境中,我们将值插入为“ 100 ”,该值在报告中如下所示。
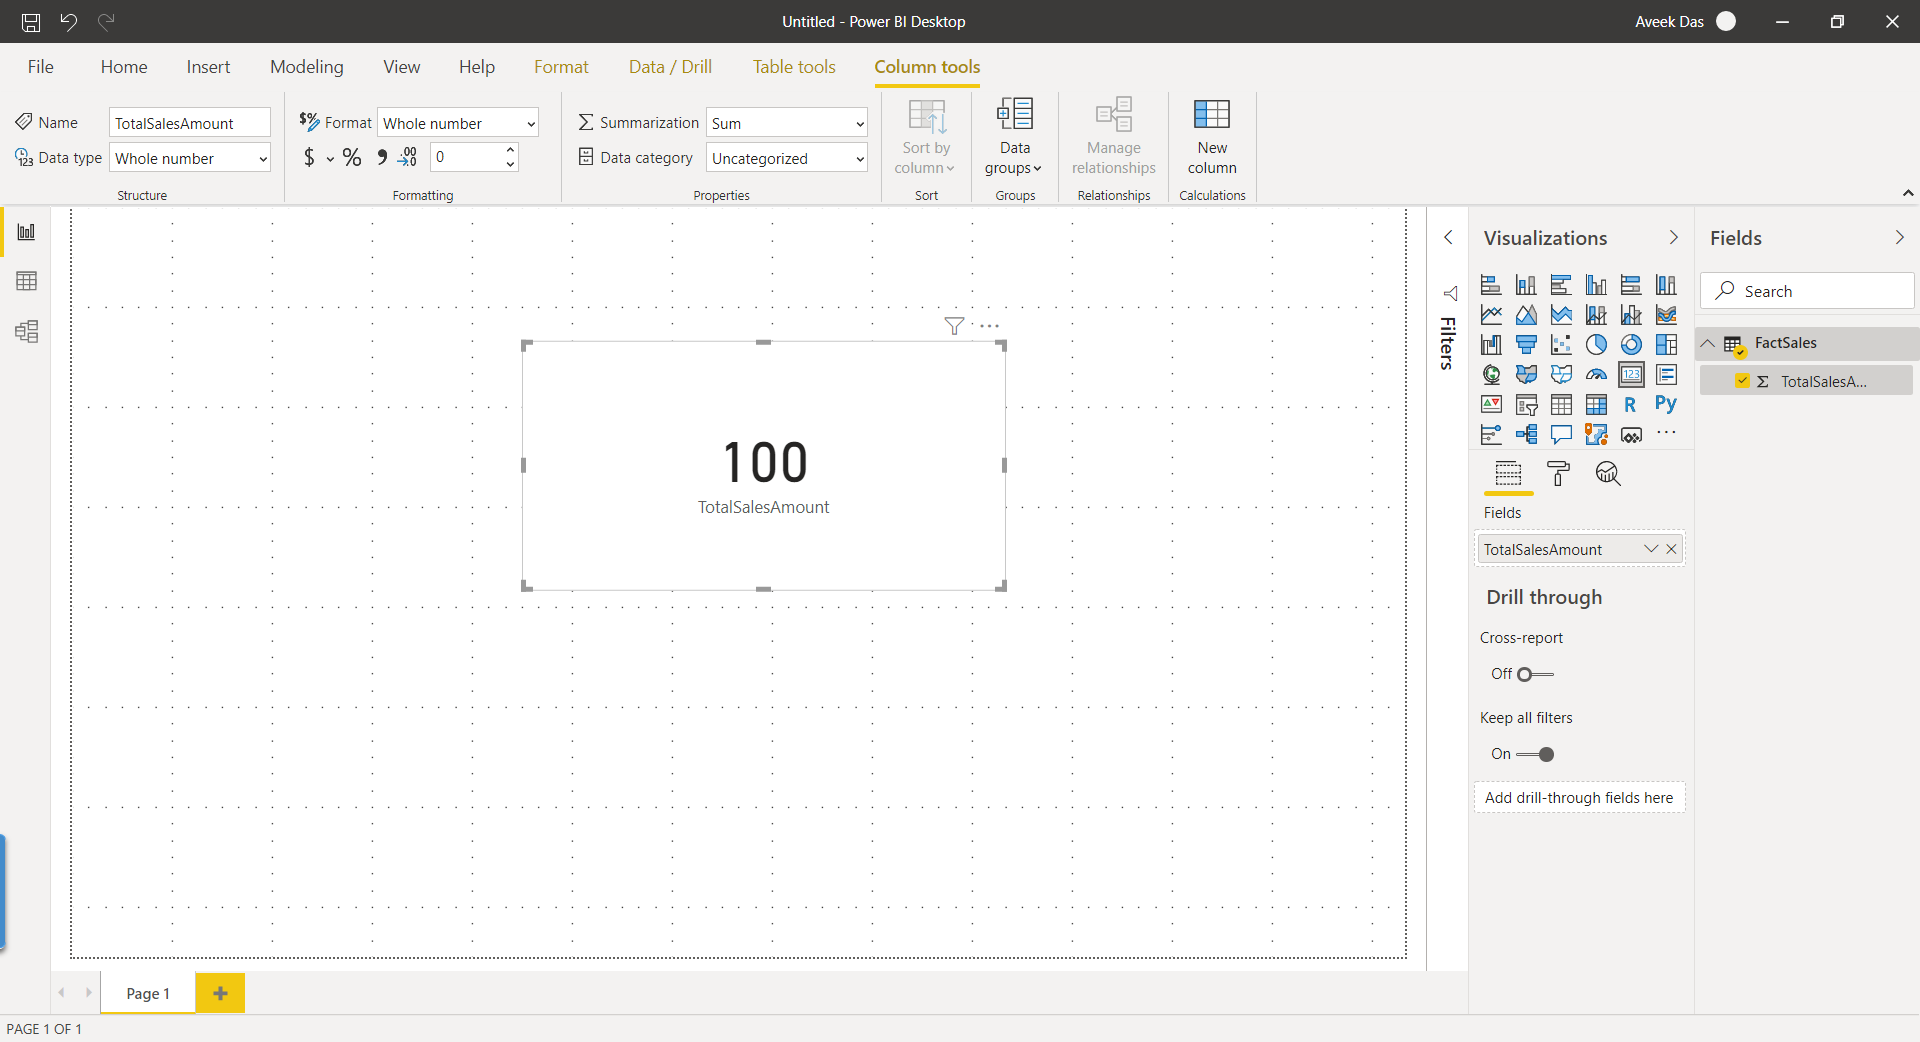
Figure 9 – Capturing data from Development Environment
图9 –从开发环境捕获数据
修改参数 (Changing the parameters)
Now that our initial report from the development database is built and we can visualize the data, let us move ahead and try to change the connection parameters and point the data source to the QA database.
现在,我们已经建立了开发数据库的初始报告,并且可以可视化数据,让我们继续进行,尝试更改连接参数并将数据源指向QA数据库。
Head over to the Transform data tab on the menu bar and select Edit Parameters from the drop-down menu:
转到菜单栏上的“ 转换数据”选项卡,然后从下拉菜单中选择“ 编辑参数 ”:

Figure 10 – Edit Parameters
图10 –编辑参数
In the Edit Parameters dialog box, alter the name of the catalog to point it to the QA environment. In this case, we will rename it to “SQLShackDemo_QA” and click OK. Finally, click on the Apply Changes button to go ahead and refresh the Power BI dataset:
在“ 编辑参数”对话框中,更改目录的名称以将其指向QA环境。 在这种情况下,我们将其重命名为“ SQLShackDemo_QA ”,然后单击“ 确定” 。 最后,单击“ 应用更改”按钮继续并刷新Power BI数据集:
Figure 11 – Edit Parameters Dialog Box
图11 –编辑参数对话框
Once the dataset is refreshed, you can now see that the card visual has been updated, and now it reflects the value from the QA environment which is “800”. This is how you can use any data source to fetch data into Power BI without manually changing the reports:
刷新数据集后,您现在可以看到卡片外观已更新,现在它反映了质量检查环境中的值“ 800 ”。 这是您可以使用任何数据源将数据提取到Power BI中而无需手动更改报告的方式:
Figure 12 – Power BI Report from QA Environment
图12 – QA环境中的Power BI报告
Repeat the same for the production environment. Let us go ahead and modify the catalog name to “SQLShackDemo_PROD” and load the data into the Power BI report:
对生产环境重复相同的操作。 让我们继续并将目录名称修改为“ SQLShackDemo_PROD ”,然后将数据加载到Power BI报告中:
Figure 13 – Edit Parameters for Production
图13 –编辑生产参数
Once the dataset is refreshed, you can now see the values from the production database “5000” being displayed in the parameterized Power BI report:
刷新数据集后,现在可以在参数化的Power BI报表中看到生产数据库“ 5000 ”中的值:
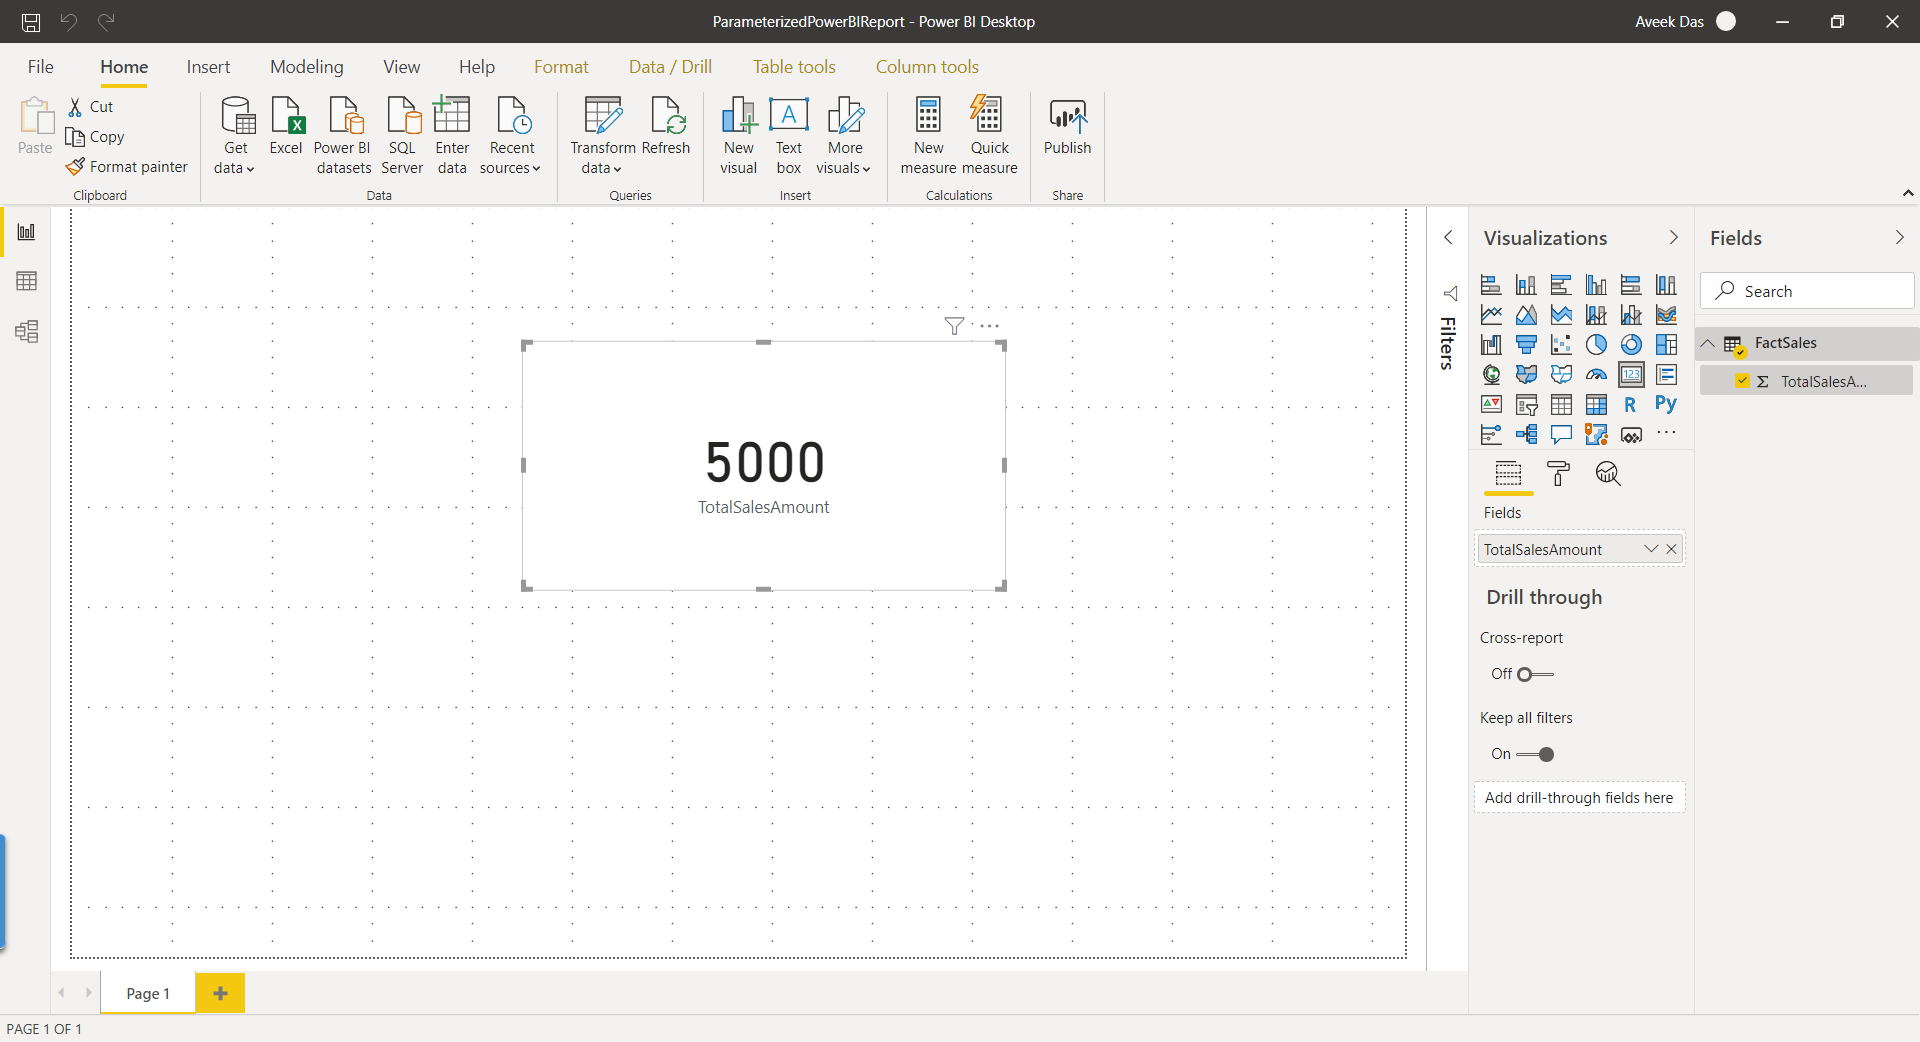
Figure 14 – Power BI Report from Production Environment
图14 –生产环境中的Power BI报告
结论 (Conclusion)
In this article, I have described how to create parameterized Power BI reports across different environments. This is done by parameterizing the data source connections while fetching data into the Power BI Reports. By default, this feature is turned off in the Power BI Desktop application, but it can be enabled later on if required. Using this feature can greatly help in using the same Power BI report over different environments without having to manually build the report separately for each environment. Also, using the parameterized data source connections enable the users to use the report and connect to any other data source as long as the schema of the database is the same.
在本文中,我描述了如何在不同环境中创建参数化Power BI报表。 这是通过在将数据提取到Power BI报表中时参数化数据源连接来完成的。 默认情况下,此功能在Power BI Desktop应用程序中处于关闭状态,但以后可以根据需要启用。 使用此功能可以极大地帮助您在不同的环境中使用相同的Power BI报告,而不必为每个环境分别手动构建报告。 另外,使用参数化的数据源连接,只要数据库的架构相同,用户就可以使用报表并连接到任何其他数据源。
翻译自: https://www.sqlshack.com/getting-started-with-parameterized-power-bi-reports/
power bi 参数
power bi 参数_参数化Power BI报表入门相关推荐
- iHRM 人力资源管理系统_第9章_文件上传与PDF报表入门_第二节_PDF报表入门
iHRM 人力资源管理系统_第9章_文件上传与PDF报表入门_第二节_PDF报表入门 文章目录 iHRM 人力资源管理系统_第9章_文件上传与PDF报表入门_第二节_PDF报表入门 PDF报表入门 3 ...
- power bi函数_在Power BI中的行上使用聚合函数
power bi函数 Aggregate functions are one of the main building blocks in Power BI. Being used explicitl ...
- postgresql 遍历参数_《go语言从入门到入坟》json操作、文件操作
json操作 JSON (JavaScript Object Notation)是一种比XML更轻量级的数据交换格式,不仅易于阅读和理解,也更方面程序解析和生成.尽管json是JavaScript的一 ...
- powershell编程_对Power BI PowerShell Commandlet的编程访问
powershell编程 In this article, I am going to demonstrate how to access the Power BI PowerShell comman ...
- 未发现数据源名称_在Power BI中管理数据源Analysis Services
添加数据源 有关如何添加数据源的信息,请参阅添加数据源. 如果要连接到多维或表格服务器,请选择 Analysis Services 作为"数据源类型" . 填写数据源的信息(包括服 ...
- Power BI 数据可视化软件实现共享报表
l 在 Power BI 中与同事共享和协作 在此模块中,涵盖各种用于与同事共享和协作处理仪表板.报表和数据的方法.例如,你可以: 从 Power BI Desktop 向 Power BI 服务发布 ...
- Power BI 参数解决源文件路径问题
PowerBI可以将本地excel作为数据源,但是本地数据源的位置不固定时每次都要更改数据源重新刷新. 我们可以通过 Power BI 参数的方法轻松解决更新excel数据源的问题 步骤: 1 点击转 ...
- power bi导入文件夹_从Power BI Desktop中的PDF文件导入数据
power bi导入文件夹 Power BI Desktop is a useful reporting and analytical tool to represent data in variou ...
- powerbi使用说明_微软Power BI入门指南(1):Power BI初步介绍
来源:数据之巅链接:http://www.cnblogs.com/asxinyu/p/Power_BI_GettingStarted_English_Intro.html 我们在前一篇文章微软新神器- ...
最新文章
- Android 断点续传实现原理
- 大数据互联网架构 tomcat集群配置时三个端口的作用
- 选修课计算机网络技术,2020智慧职教网络选修课计算机网络技术基础答案完整满分章节测试答案...
- Matlab出现On Startup: Error using eval undefined function 'workspacefunc' for input arguments of type
- 前端码农的焦虑与救赎
- wpf datepicker 选择时分秒_[Angular 组件库 NG-ZORRO 基础入门] - DatePicker
- ssis 创建ssisdb_SSIS目录数据库(SSISDB)简介
- 如何实现复杂FPGA设计的时序收敛
- RegisterWindowMessage
- 《数学女孩》 读书笔记 Part 1 of 5
- 安卓学习专栏——实现记住密码功能(图文+代码)
- matlab解方java_如何在MATLAB中获得该方程的所有解?
- 20190826——python对象实例搬家具
- 办公实用技巧:利用迅捷画图绘制网络拓扑图操作方法介绍
- 刷表法 和 填表法(DP)
- 2021贵州江口中学高考成绩查询,2020铜仁江口县中考分数线 江口县高中录取分数线 江口县中考成绩查询_中考_3773考试网...
- 学生学籍管理系统 jsp mysql_学生学籍管理系统的设计与实现(JSP,MySQL)
- harbor安装时出现ERROR: An HTTP request took too long to complete. Retry with --verbose to obtain debug in
- CIL之——初识CIL
- NUIST OJ 1350-1352 面朝大海,春暖花开【初识线段树】
热门文章
- bootstrap 点击图片放大查看_Bootstrap 开源 SVG 图标库 Bootstrap Icons
- JConsole远程配置
- pom.xml文件引入tools.jar
- 潭州课堂25班:Ph201805201 爬虫高级 第十二 课 Scrapy-redis分布 项目实战 (课堂笔记)...
- bzoj1565【NOI2009】植物大战僵尸(最小割)
- 【ARM-Linux开发】libxml/parser.h: 没有那个文件或目录解决方案
- Python网页抓取
- 1.LeetCode字符编辑距离
- (进阶)LeetCode(338)——比特位计数(JavaScript)
- Error:Trailing spaces not allowed no-trailing-spaces