ssas 维度属性_Analysis Services(SSAS)多维数据集–维度属性和层次结构
ssas 维度属性
In Data Warehouse language, slicing and dicing is done with Dimension Attributes. Sometime a developer feels the need to provide everything to end users, whereas seasoned Business Intelligence Architects understand to provide only the attributes from the requirements. It is a hard path to follow and the seasoned architect’s experience might be the better option.
在数据仓库语言中,切片和切块是通过维度属性完成的。 有时,开发人员感到有必要向最终用户提供一切,而经验丰富的商业智能架构师则理解仅提供需求中的属性。 这是一条很难走的路,经验丰富的建筑师的经验可能是更好的选择。
Multidimensional Cubes (cubes) handle the attribute list differently than the Tabular Model for SQL Server Analysis Services (SSAS). The cube wizard selects dimensions not previously defined but based on relationships built in the Data Source View outside of the Dimensions already built. If these dimensions are not deselected during the cube wizard, the dimension is built with Keys only. On the other hand, the Tabular Model will select all the columns in a table or view imported like the older versions SSAS for cubes.
多维多维数据集(多维数据集)对属性列表的处理方式不同于SQL Server Analysis Services的表格模型(SSAS)。 多维数据集向导会选择先前未定义的维度,但会基于已构建的维度外部的数据源视图中构建的关系。 如果在多维数据集向导中未取消选择这些尺寸,则仅使用“键”构建尺寸。 另一方面,表格模型将选择表或视图中的所有列,就像多维数据集的旧版本SSAS一样。
The cube created in the previous article, Initial Attributes and Measures in SSAS Multidimensional Cubes, had the Date Dimension created through the dimension wizard and was completed before running the cube wizard. But, the other dimensions related to the fact table selected were created with the Cube wizard and added as dimensions like Dim Product and Dim Customer in Figure 1.
在上一篇文章“ SSAS多维多维数据集中的初始属性和度量”中创建的多维数据集具有通过维度向导创建的“日期”维度,并且在运行多维数据集向导之前已完成。 但是,与所选事实表相关的其他维度是使用多维数据集向导创建的,并作为维度添加到了图1中,例如Dim Product和Dim Customer。
To update the new dimensions, go to the Dimensions folder in the solution explorer and double click the Dim Product dimension or right click and select Open from the submenu.
要更新新尺寸,请转到解决方案资源管理器中的“尺寸”文件夹,然后双击“暗淡产品”尺寸,或右键单击并从子菜单中选择“打开”。
The Dimension editor will open to the Dimension Structure Pane, but also note there are 3 other panes (or tabs): Attribute Relationships, Translations and Browser.
“维度”编辑器将打开“维度结构”窗格,但还要注意还有3个其他窗格(或选项卡):“属性关系”,“翻译”和“浏览器”。
There needs to be some cleaning up of the names used for attributes and dimension name as well as adding new attributes and changing the NameColumn for the keys. Right clicking on these names and select rename from the submenu will assist in this task. After renaming, deploy the cube in order to browse the changes. It is always good to deploy the project when making changes with Multidimensional Cubes. If too many changes are made at once, an error during deployment might be harder to catch.
需要清理一些用于属性和维名称的名称,以及添加新属性和更改键的NameColumn。 右键单击这些名称,然后从子菜单中选择“重命名”将有助于完成此任务。 重命名后,部署多维数据集以浏览更改。 使用多维多维数据集进行更改时,最好部署项目。 如果一次进行太多更改,则部署期间的错误可能更难以捕获。
To Deploy, right click the project and select Deploy from the submenu like Figure 4.
要部署,请右键单击该项目,然后从子菜单中选择Deploy,如图4所示。
After the cube is deployed, go to the Browser tab of the Dimension editor and reconnect to browse the changes.
部署多维数据集后,转到“维度”编辑器的“浏览器”选项卡,然后重新连接以浏览更改。
The Product, Category and Subcategory all have keys as the displayed values in this cube. Changing the NameColumn property will enable a different column value to be used. The end user does not want to see the integer key for product, they would want to see the Product Name. This example in Figure 6 changes the Product NameColumn to ProductName, Category to CategoryName and Subcategory to SubcategoryName.
产品,类别和子类别都具有键作为此多维数据集中的显示值。 更改NameColumn属性将允许使用其他列值。 最终用户不想看到产品的整数键,而是希望看到产品名称。 图6中的示例将Product NameColumn更改为ProductName,Category更改为CategoryName,并将Subcategory更改为SubcategoryName。
Figure 6 also shows the Data Source View pane that contains the DimProduct, DimProductCategory and DimProductSubcategory tables plus their relationships. This was done by the Cube Wizard because the Dimension tables had foreign keys when connecting to the Data Source and creating the Data Source View. These Dimension tables can be separate Dimensions in the Cube if the user prefers that architecture.
图6还显示了“数据源视图”窗格,其中包含DimProduct,DimProductCategory和DimProductSubcategory表以及它们之间的关系。 这是由多维数据集向导完成的,因为在连接到数据源并创建数据源视图时,维表具有外键。 如果用户喜欢该架构,则这些维度表可以是多维数据集中的单独维度。
The columns Color, ListPrice and Class are also added to the product dimension before another deployment. In addition to the new attributes, a hierarchy is create for Category/Subcategory/Product Name. Hierarchies are useful in visual reporting tools to show the Parent/Child relationship between attributes. This can be a natural hierarchy like Year/Qtr/Month/Day or a user hierarchy like Color and Class.
在再次部署之前,还将列Color,ListPrice和Class添加到产品维度。 除新属性外,还将为“类别/子类别/产品名称”创建层次结构。 层次结构在可视化报表工具中非常有用,可以显示属性之间的父/子关系。 这可以是自然的层次结构,例如Year / Qtr / Month / Day,也可以是用户层次结构,例如Color和Class。
The blue squiggly line under the Hierarchy Color by Class indicates that there is not a relationship set in the Attribute Relationships for the Dimension between these two source columns for their attributes. Figure 8 shows the relationship for Category, Subcategory and Product Name. This indicator is only a warning and will not prevent the cube from being deployed. It is only a saying no relationship can cause performance issues when using large dimensions with this hierarchy type.
层次结构颜色(按类别)下的蓝色波浪线表示在这两个源列的属性之间,“维度的属性关系”中未设置任何关系。 图8显示了类别,子类别和产品名称的关系。 该指示符仅是警告,不会阻止多维数据集的部署。 只能说,在使用这种层次结构类型的大尺寸维度时,任何关系都不会导致性能问题。
The Dimension understands that only one Category can be related to one Subcategory and one Subcategory for one Product. But, many Subcategories can have the same Category as well as many Products can have the same Subcategory. This is because the Data Source View has these as separate tables with relationships. That is not the case for Color and Class. The Color and Class columns are in the Product table and there is no direct relationship between the two attributes, at least that Analysis Services can see.
维度了解到,只有一个类别可以与一个子类别和一个产品的一个子类别相关。 但是,许多子类别可以具有相同的类别,并且许多产品可以具有相同的子类别。 这是因为数据源视图将这些作为具有关系的独立表。 颜色和类别不是这种情况。 “颜色”和“类”列位于“产品”表中,并且两个属性之间没有直接关系,至少Analysis Services可以看到这些关系。
Figure 9 shows the Dim Customer and the changes needed for it to be useful. We need to update the Data Source View for the table DimCustomer in order to add a new column for the combination of LastName and FirstName. This will be used in the NameColumn of the Customer Key. Additional attributes related to Geography and Demographics are required for slicing and dicing
图9显示了Dim客户及其有用的更改。 我们需要更新表DimCustomer的数据源视图,以便为姓氏和名字的组合添加新列。 这将在“客户密钥”的“名称”列中使用。 切片和切块需要与地理和人口统计相关的其他属性
The Data Source View can be used to replace the table with a query or another table/view from a Data Source. Or, you could add the new column by right clicking the DimCustomer table and selecting New Named Calculation… The new column will be called CustomerName and can be created with the following statement: LastName + ‘, ‘ + FirstName
数据源视图可用于将表替换为查询或数据源中的另一个表/视图。 或者,您可以通过右键单击DimCustomer表并选择“新命名的计算”来添加新列。新列将被称为CustomerName,并可以使用以下语句创建:LastName +','+ FirstName
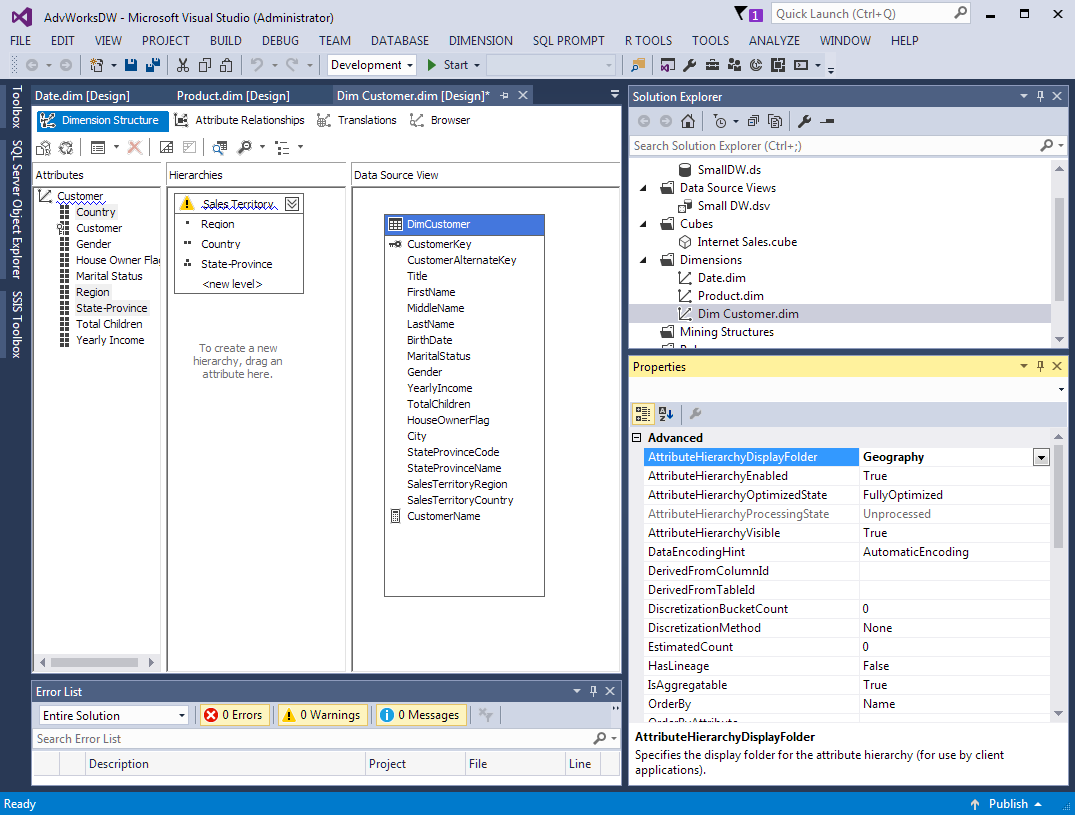
The Customer Key can be renamed to Customer and Dim Customer to Customer. The new attributes Gender, YearlyIncome, TotalChildren and HouseOwnerFlag will be used for Demographics and StateProvinceName, SalesTerritoryRegion and SalesTerritoryCountry will be used for Geography. Figure 11 shows the new attributes and NameColumn for Customer Key.
可以将“客户密钥”重命名为“客户”,并将“暗淡客户”重命名为“客户”。 新属性Gender,YearlyIncome,TotalChildren和HouseOwnerFlag将用于人口统计,StateProvinceName,SalesTerritoryRegion和SalesTerritoryCountry将用于地理。 图11显示了新的属性和Customer Key的NameColumn。
There is also a property for an attribute called AttributeHierarchyDisplayFolder that enables attributes to be organized into a folder structure for better display in tools like Excel. Figure 12 shows Geography used as the folder for Country, Region and State-Province. This dimension uses Demographics as a folder for attributes Gender, Marital Status, House Owner Flag, Total Children and Yearly Income.
还有一个名为AttributeHierarchyDisplayFolder的属性的属性,该属性使属性可以组织为文件夹结构,以便在Excel等工具中更好地显示。 图12显示了用作Country,Region和State-Province的文件夹的Geography。 此维度使用“人口统计”作为属性“性别”,“婚姻状况”,“房主旗帜”,“子女总数”和“年收入”的文件夹。
NOTE: A better way to include or exclude columns for a Dimension or Fact table is to create a view. The view can be used in the Data Source View of Multidimensional Cubes or Data Import for Tabular Model. The only caution is when using views, the Data Source does not reveal foreign key relationships between the source dimension table and fact table. So, the relationship will have to be added after the view is added. Other benefits of using a view is a database administrator (DBA) can performance tuning the source table(s) of the view without impacting the structure of the dimension using the view. Also, if the source table does change structurally, then the view can be adopted to hide the changes like a column that is renamed.
注意:包含或排除Dimension或Fact表的列的一种更好的方法是创建视图。 该视图可用于多维多维数据集的数据源视图或用于表格模型的数据导入。 唯一的警告是,在使用视图时,数据源不会显示源维表和事实表之间的外键关系。 因此,必须在添加视图之后添加关系。 使用视图的其他好处是,数据库管理员(DBA)可以对视图的源表进行性能调整,而不会影响使用该视图的维度的结构。 同样,如果源表确实在结构上发生了更改,则可以采用该视图来隐藏更改,例如重命名的列。
Previous articles in this series:
本系列以前的文章:
- SQL Server Data Warehouse design best practice for Analysis Services (SSAS)分析服务(SSAS)SQL Server数据仓库设计最佳实践
- Connecting to Data Source(s) with SQL Server Analysis Services使用SQL Server Analysis Services连接到数据源
- Initial Attributes and Measures in SSAS Multidimensional CubesSSAS多维立方体中的初始属性和度量
有用的链接 (Useful links)
- Modifying a Cube 修改多维数据集
- Dimensions 外型尺寸
- Analysis Services (SSAS) Multidimensional Design Tips – Data Source View and Cubes Analysis Services(SSAS)多维设计技巧–数据源视图和多维数据集
翻译自: https://www.sqlshack.com/analysis-services-ssas-cubes-dimension-attributes-hierarchies/
ssas 维度属性
ssas 维度属性_Analysis Services(SSAS)多维数据集–维度属性和层次结构相关推荐
- 微软BI 之SSAS 系列 - 多维数据集维度用法之二 事实维度(退化维度 Degenerate Dimension)...
这篇文章是基于上一篇 SSAS 系列 - 多维数据集维度用法之一 引用维度 Referenced Dimension 继续讲解多维数据集维度用法中的事实维度. 事实维度,顾名思义就是把事实表 Fact ...
- ssas 度量值属性_Analysis Services(SSAS)表格模型–属性和度量
ssas 度量值属性 In this article, a demonstration of the tabular model will try to related multidimensiona ...
- ssas如何创建分区_Analysis Services(SSAS)多维设计技巧–创建尺寸
ssas如何创建分区 In the previous article, Analysis Services (SSAS) Multidimensional Design Tips – Data Sou ...
- ssas报表项目数据集_Analysis Services(SSAS)多维设计技巧–数据源视图和多维数据集
ssas报表项目数据集 In this article, we'll discuss some tips and best practices regarding the design of OLAP ...
- ssas 分层维度_如何在SSAS多维中使用分区来优化维度安全性能
ssas 分层维度 介绍 (Introduction) In the articles How to partition an SSAS Cube in Analysis Services Multi ...
- sql2018 ssas_如何使用SQL Server Analysis Services(SSAS)从头开始构建多维数据集
sql2018 ssas 介绍 (Introduction) I am a DBA consultant and several times, in the past, I have been ask ...
- SSAS系列——【03】多维数据(多维数据集对象)
原文:SSAS系列--[03]多维数据(多维数据集对象) 1.什么是Cube? 简单 Cube 对象由基本信息.维度和度量值组组成. 基本信息包括多维数据集的名称.多维数据集的默认度量值.数据源和存储 ...
- ssas报表项目数据集_处理SSAS多维OLAP多维数据集的有效方法
ssas报表项目数据集 介绍 (Introduction) While building and deploying an SSAS OLAP cube, there are two processi ...
- ssas表格模型 权限控制_Analysis Services(SSAS)表格模型中的时间智能
ssas表格模型 权限控制 In the analytical world, time is an important slicer. The ability to view data over ti ...
最新文章
- Odd Translation(一)
- Java集合框架:WeakHashMap
- CircularFifoQueue队列API
- TCP连接建立与释放
- 递归,yield,参数槽
- POJ 1201 Intervals
- WDTP:利器,在于轻便犀利
- 三维重建 - Clion打包C++代码(包含qt库,opencv以及dcmtk)
- High Reward Low Risk Strategies
- 苹果新款耳机问题多 线上短暂销售仍被抢空
- avm2 pcode 学习笔记。高手勿笑
- 根据当前时间获取当前周的开始、结束时间(周一到周日)
- modbus调试团结_教学团结? 为教育者免费提供丰富的课程资源
- 玩转西塘:感受水墨江南的迷醉风情
- cadence学习记录
- STM32+ULN2003驱动步进电机
- Spring注解驱动之注册组件(spring的再回顾)
- 3年轻人20万开店日营业额79.2元,年轻人开店还能赚到钱吗?
- ajax同步的使用创场景,Ajax的同步调用场景——使用同步Ajax在 onunload 事件时通知服务器...
- LabVIEW矩阵的基本应用