SQL Server查询存储–概述
The SQL Server Query Store is a relatively new feature introduced in SQL Server 2016. It is basically a SQL Server “flight recorder” or “black box”, capturing a history of executed queries, query runtime execution statistics, execution plans etc. against a specific database. This information helps in identifying performance problems caused by query plan changes and troubleshooting by quickly finding performance differences, even after SQL Server restart or upgrade. All data that SQL Server Query Store capture are stored on disk.
SQL Server 查询存储是SQL Server 2016中引入的一个相对较新的功能。它基本上是SQL Server的“飞行记录器”或“黑匣子”,捕获已执行查询的历史记录,查询运行时执行统计信息,针对执行计划的执行计划等。特定的数据库。 此信息通过快速查找性能差异(即使在SQL Server重新启动或升级之后),也有助于识别由查询计划更改和故障排除引起的性能问题。 SQL Server查询存储捕获的所有数据都存储在磁盘上。
This article will cover an explanation of the SQL Server Query Store options and a brief description of the SQL Server Query Store built-in reports.
本文将介绍SQL Server查询存储选项的说明,以及SQL Server查询存储内置报告的简要说明。
Here are the common scenarios where the SQL Server Query Store feature can be useful:
以下是SQL Server查询存储功能可能有用的常见方案:
- Find the most expensive queries for CPU, I/O, Memory etc. 查找最昂贵的CPU,I / O,内存等查询。
- Get full history of query executions 获取查询执行的完整历史记录
- Get information about query regressions (a new execution plan generated by query engine is worse than the older one). Quickly find performance regression and fixing it by forcing the previous query plan whose performances are much better than a newly generated plan 获取有关查询回归的信息(查询引擎生成的新的执行计划比旧的计划糟糕)。 通过强制执行性能比新生成的计划好得多的先前查询计划,快速找到性能退化并进行修复
- Determine how many times a query was executed in the given range of time 确定在给定的时间范围内执行一次查询的次数
要闻速览 (Quick facts)
- The SQL Server Query Store is per-database-level feature which means that it can be enabled on every SQL database separately by using SQL Server Management Studio or T-SQL. It is not an instance level setting. SQL Server查询存储是每个数据库级别的功能,这意味着可以使用SQL Server Management Studio或T-SQL在每个SQL数据库上分别启用它。 这不是实例级别设置。
- DMWs quickly and easily. DMW快速,轻松地分析查询性能。
- The SQL Server Query Store feature is available on every SQL Server editions. 每个SQL Server版本上都提供SQL Server查询存储功能。
- Note, on Azure databases, the SQL Server Query Store feature is enabled by default. 注意,在Azure数据库上,默认情况下启用SQL Server查询存储功能。
- VIEW DATABASE STATE permission: VIEW DATABASE STATE权限:
USE AdventureWorks2014 GO GRANT VIEW DATABASE STATE TO [USER]; - This permission is not for forcing execution plan, data flush Interval etc. For this, you need to have db_owner fixed database role. 该权限不是强制执行计划,数据刷新间隔等。为此,您需要具有db_owner固定数据库角色。
建立 (Setup)
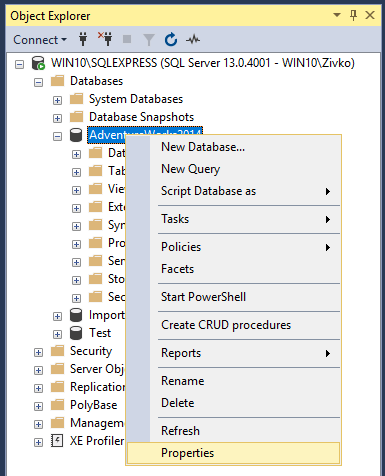
To enable SQL Server Query Store for a database on on-promise SQL Server, right click on a database in Object Explorer and from the context menu, choose the Properties option:
要在本地SQL Server上为数据库启用SQL Server查询存储,请在对象资源管理器中右键单击数据库,然后从上下文菜单中选择“ 属性”选项:
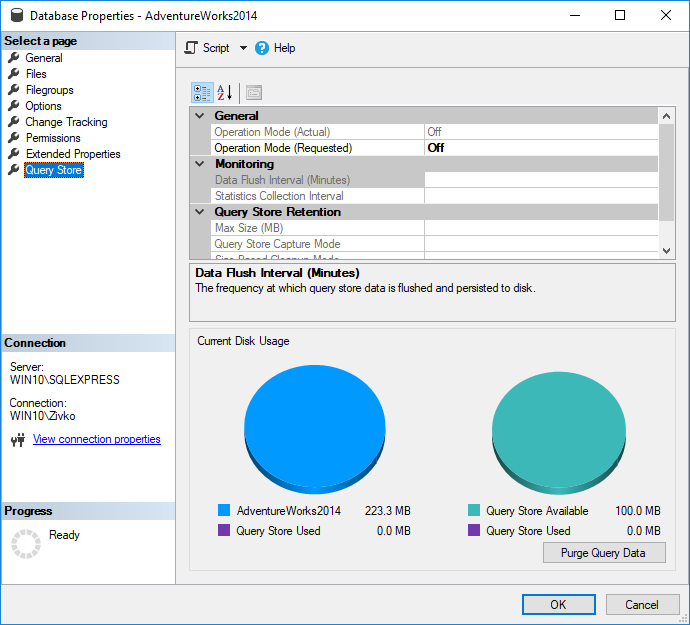
From the Database Properties dialog in the Select a page section, select the Query Store page:
在“选择页面”部分的“数据库属性”对话框中,选择“ 查询存储”页面:
From the Operation Mode (Requested) drop down box, choose the Read Write item:
在“ 操作模式(请求的)”下拉框中,选择“ 读写”项:
As soon as the Read Write item is chosen, the other fields under the Operation Mode (Requested) drop down box will be pre-populated with default values:
选择“ 读写”项后,“ 操作模式(请求)”下拉框下的其他字段将预先填充为默认值:
By pressing the OK button on the Database Properties dialog, the SQL Server Query Store is enabled to capture query execution plans and runtime information.
通过单击 “数据库属性”对话框上的“ 确定”按钮,将启用SQL Server查询存储以捕获查询执行计划和运行时信息。
To confirm that the SQL Server Query Store is enabled on the chosen database, go to Object Explorer, refresh and expand the database. The SQL Server Query Store folder will appear with the list of available built-in reports:
若要确认在所选数据库上启用了SQL Server查询存储,请转到“对象资源管理器”,刷新并展开数据库。 SQL Server Query Store文件夹将与可用的内置报告列表一起出现:
To enable the SQL Server Query Store by using T-SQL execute the following statement in a query window:
若要使用T-SQL启用SQL Server查询存储,请在查询窗口中执行以下语句:
ALTER DATABASE [AdventureWorks2014] SET QUERY_STORE = ON;
Note, SQL Server Query Store cannot be enabled for master or tempdb database.
注意,不能为master或tempdb数据库启用SQL Server查询存储。
The SQL Server Query Store will have performance impact on SQL Server 3-5% on average by Microsoft indication.
Microsoft表示,SQL Server查询存储平均会对SQL Server产生3-5%的性能影响。
选件 (Options)
The first option under the SQL Server Query Store page of the Database Properties dialog is the Operation Mode (Active) option:
“数据库属性”对话框的“ SQL Server查询存储”页面下的第一个选项是“ 操作模式(活动)”选项:
This option is disabled and cannot be changed. This option indicates the state of the SQL Server Query Store. There are three modes of the SQL Server Query Store and those are Off, Read Only and Read Write.
此选项已禁用,无法更改。 此选项指示SQL Server查询存储的状态。 SQL Server查询存储有三种模式,分别是“ 关闭” ,“ 只读”和“ 读写”模式 。
Off – The SQL Server Query Store turned off
关 – SQL Server查询存储已关闭
Read Only – This mode indicates that new query runtime statistics or executed plans will not be tracked (collected)
只读 -此模式指示将不会跟踪(收集)新的查询运行时统计信息或已执行的计划
Read Write – Allows capturing query executed plans and query runtime statistics
读写 -允许捕获查询执行的计划和查询运行时统计信息
In the Operation Mode (Requested), in the drop-down box, the same options can be set as those mentioned for the previously option. Setting here the values will directly have impact on the state of the Query Store.
在“ 操作模式(已请求)”的下拉框中,可以设置与先前选项相同的选项。 在此处设置值将直接影响查询存储的状态。
For example, if in the Operation Mode (Requested), from the drop-down box the Read Only value is chosen:
例如,如果处于“ 操作模式(请求)”,则从下拉框中选择“ 只读”值:
The equivalent T-SQL code for the same option is:
相同选项的等效T-SQL代码为:
ALTER DATABASE AdventureWorks2014
SET QUERY_STORE = ON   (  OPERATION_MODE = READ_ONLY   );
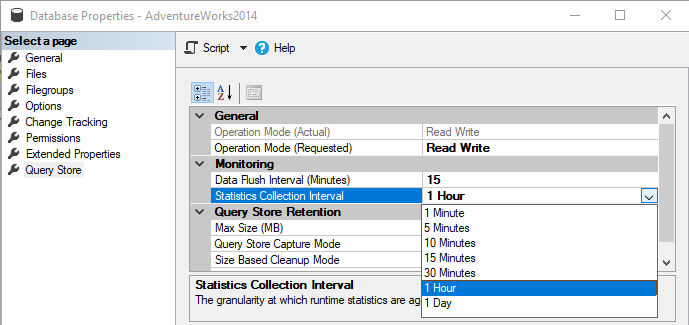
In the Data Flush Interval (Minutes) option, an interval in minutes can be set which shows how frequent the query runtime statistics and query execution plans will be flushed from memory of SQL Server instance to disk. By default, this option is set to 15 minutes:
在“ 数据刷新间隔(分钟)”选项中,可以设置以分钟为单位的间隔,该间隔显示查询运行时统计信息和查询执行计划从SQL Server实例的内存刷新到磁盘的频率。 默认情况下,此选项设置为15分钟:
If this option is set to lower value than the frequency of flushes, data from memory to disk will occur often which will have negative impact on performance of SQL Server instance. But If the value is increased, more SQL Server Query Store information will be placed in memory of the SQL Server instance before it flushes to disk, which increases a risk of losing that data in case of SQL Server restart/crashes.
如果将此选项设置为低于刷新频率的值,则将经常发生从内存到磁盘的数据,这将对SQL Server实例的性能产生负面影响。 但是,如果增加该值,则会在刷新到磁盘之前将更多SQL Server查询存储信息放入SQL Server实例的内存中,这会增加在SQL Server重新启动/崩溃时丢失该数据的风险。
Below is the T-SQL code for setting the Data Flush Interval (Minutes) option:
以下是用于设置“ 数据刷新间隔(分钟)”选项的T-SQL代码:
ALTER DATABASE AdventureWorks2014
SET QUERY_STORE = ON   (  DATA_FLUSH_INTERVAL_SECONDS = 900   );
The Statistics Collection Interval option defined aggregation interval of query runtime statistics that should be used inside the SQL Server Query Store. By default, it is set to 60 minutes. Lower value means that granularity of query runtime statistics is finer, because of that, more intervals occur which requires more disk space for storing query runtime statistics.
“ 统计信息收集间隔”选项定义了查询运行时统计信息的聚合间隔,应在SQL Server查询存储中使用该间隔。 默认情况下,它设置为60分钟。 较低的值表示查询运行时统计信息的粒度更好,因为这样会出现更多的间隔,这需要更多的磁盘空间来存储查询运行时统计信息。
The T-SQL code for setting the Statistics Collection Interval option:
用于设置统计信息收集间隔选项的T-SQL代码:
ALTER DATABASE AdventureWorks2014
SET QUERY_STORE = ON   (  INTERVAL_LENGTH_MINUTES = 1440   );
Note, in the T-SQL code for the Statistics Collection Interval option the following values in minutes 1, 5, 10, 15, 30, 60, 1440 can be set.
注意,在“ 统计信息收集间隔”选项的T-SQL代码中 可以在分钟1、5、10、15、30、60、1440中设置以下值。
In case that is in INTERVAL_LENGTH_MINUTES set some other number:
如果是INTERVAL_LENGTH_MINUTES,请设置其他一些数字:
ALTER DATABASE AdventureWorks2014
SET QUERY_STORE = ON   (  INTERVAL_LENGTH_MINUTES = 900   );
The following message will appear when the statement is executed:
执行该语句时将出现以下消息:
Msg 12432, Level 16, State 1, Line 1
SQL Server Query Store Interval length cannot be changed because an invalid value was provided. Please try again with a valid value (1, 5, 10, 15, 30 & 60).
Msg 5069, Level 16, State 1, Line 1
ALTER DATABASE statement failed.
消息12432,第16级,状态1,第1行
SQL Server查询存储间隔长度不能更改,因为提供了无效的值。 请使用有效值(1、5、10、15、30和60)再试一次。
Msg 5069,第16级,状态1,第1行
ALTER DATABASE语句失败。
The Max Size (MB) option is for configuring the maximum size of the SQL Server Query Store. By default, the maximum size of the SQL Server Query Store is set to 100 MB. The data in the SQL Server Query Store is stored in the database where the SQL Server Query Store is enabled. The SQL Server Query Store doesn’t auto grow and once the SQL Server Query Store reaches the maximum size, the Operation Mode will be switched to the Read Only mode, automatically, and new query execution plan and query runtime statistics will not be collected:
“ 最大大小(MB)”选项用于配置SQL Server查询存储的最大大小。 默认情况下,SQL Server查询存储的最大大小设置为100 MB 。 SQL Server查询存储中的数据存储在启用了SQL Server查询存储的数据库中。 SQL Server查询存储不会自动增长,一旦SQL Server查询存储达到最大大小, 操作模式将自动切换为只读模式,并且不会收集新的查询执行计划和查询运行时统计信息:
The T-SQL code for setting maximum size of the SQL Server Query Store is:
用于设置SQL Server查询存储的最大大小的T-SQL代码为:
ALTER DATABASE AdventureWorks2014
SET QUERY_STORE = ON   (  MAX_STORAGE_SIZE_MB = 1024   );
The Query Store Capture Mode option determines what type of query will be captured in the Query Store. By default, the Query Store Capture Mode option is set to All, which means that every executed query will be stored in the SQL Server Query Store that runs on the database. When the Query Store Capture Mode option is set to Auto then the SQL Server Query Store will try to triage which query capture, by priority, and try to ignore infrequently executed and other ad hoc queries. Also, there is the third value in the Query Store Capture Mode drop down box which is None. When the None value is chosen, then the SQL Server Query Store will not gather information for the new queries and will continue gathering information only on the queries that it has been recorded previously:
“ 查询存储捕获模式”选项确定在查询存储中将捕获哪种类型的查询。 默认情况下,“ 查询存储捕获模式”选项设置为All ,这意味着每个执行的查询将存储在数据库上运行SQL Server查询存储中。 当“ 查询存储捕获模式”选项设置为“ 自动”时 ,SQL Server查询存储将尝试按优先级对哪个查询捕获进行分类,并尝试忽略不经常执行的查询和其他临时查询。 此外,在“ 查询存储捕获模式”下拉框中没有第三个值,即None 。 选择“无”值时,SQL Server查询存储将不会为新查询收集信息,而将仅继续收集先前已记录的查询的信息:
The T-SQL code to set this option is:
设置此选项的T-SQL代码为:
ALTER DATABASE AdventureWorks2014
SET QUERY_STORE = ON   (  QUERY_CAPTURE_MODE = ALL);
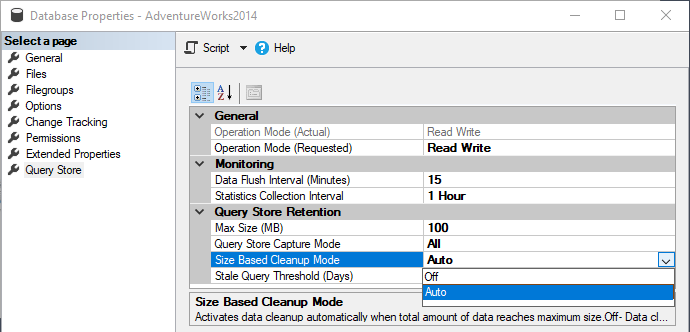
The Size Based Cleanup Mode option is for cleaning the SQL Server Query Store data when the maximum size in the Max Size (MB) option is reached to 90% of capacity. The cleanup process will remove the oldest and less expensive query data. The cleanup process stops when 80% of the maximum size in the Max Size (MB) option is reached. By default, this option is set to Auto. If in the Size Based Cleanup Mode drop down box the Off value is set, then the cleanup process will not be performed when the size of the SQL Server Query Store reaches 90% of the maximum size and the SQL Server Query Store will go to Read Only mode when the maximum size is reached:
“ 基于大小的清理模式”选项用于在“ 最大大小(MB)”选项中的最大大小达到容量的90%时清理SQL Server查询存储数据。 清理过程将删除最旧且价格较低的查询数据。 当达到“ 最大大小(MB)”选项中最大大小的80%时,清理过程将停止。 默认情况下,此选项设置为Auto 。 如果在“ 基于大小的清理模式”下拉框中设置了“ 关”值,则当SQL Server查询存储的大小达到最大大小的90%并且SQL Server查询存储将进入“读取”时,将不执行清理过程。达到最大大小时的唯一模式:
The T-SQL code to set this option is:
设置此选项的T-SQL代码为:
ALTER DATABASE AdventureWorks2014
SET QUERY_STORE = ON   (  SIZE_BASED_CLEANUP_MODE = AUTO);
The Stale Query Threshold (Days) option is for defining how long the data will stay in the SQL Server Query Store. By default, it is set for 30 days
过时查询阈值(天)选项用于定义数据在SQL Server查询存储中保留的时间。 默认情况下,设置为30天
The T-SQL code to set this option is:
设置此选项的T-SQL代码为:
ALTER DATABASE AdventureWorks2014
SET QUERY_STORE = ON   (  CLEANUP_POLICY = (STALE_QUERY_THRESHOLD_DAYS = 30));
On more options that can be set via T-SQL and not present in the SQL Server Query Store tab is MAX_PLANS_PER_QUERY:
在可以通过T-SQL设置但在SQL Server的“查询存储”选项卡中不存在的更多选项上,是MAX_PLANS_PER_QUERY :
ALTER DATABASE AdventureWorks2014
SET QUERY_STORE = ON   (  MAX_PLANS_PER_QUERY=200);
With this option, maximum Execution Plans can be set that will be stored in the SQL Server Query Store per query. By default, this is set to 200 Execution Plans per query.
使用此选项,可以设置最大执行计划,每个查询将存储在SQL Server查询存储中。 默认情况下,此设置为每个查询200个执行计划。
The last option on the SQL Server Query Store tab is an option that clears/purges all data in the SQL Server Query Store by pressing the Purge Query Data button:
“ SQL Server查询存储”选项卡上的最后一个选项是通过按“ 清除查询数据”按钮清除/清除SQL Server查询存储中所有数据的选项:
The same can be done by executing the following T-SQL code in the query window:
通过在查询窗口中执行以下T-SQL代码,可以完成相同的操作:
ALTER DATABASE AdventureWorks2014 SET QUERY_STORE CLEAR;
建筑与收藏 (Architecture and collection)
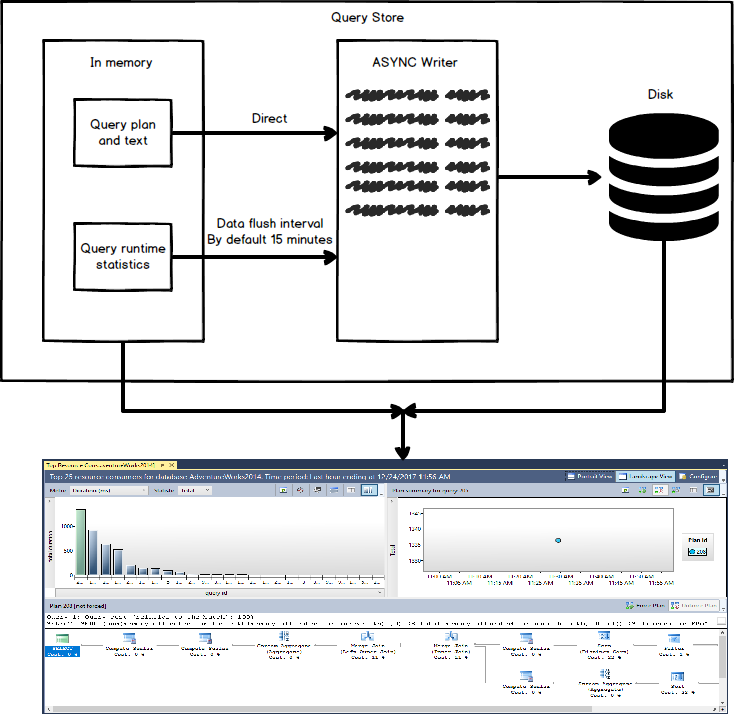
The SQL Server Query Store collects the query text, query plan and the query run time statistics and place that in the memory.
SQL Server查询存储收集查询文本,查询计划和查询运行时统计信息并将其放置在内存中。
Note, query plans that show the SQL Server Query Store are estimated execution plans not actual execution plans.
注意,显示SQL Server查询存储的查询计划是估计的执行计划,而不是实际的执行计划 。
Note: More about estimated and actual plans can be found on the SQL Server Estimated Vs Actual Execution Plans article.
注意:有关估计和实际计划的更多信息,请参见 SQL Server估计与实际执行计划 文章。
The SQL Server Query Store extracts every query statement from the query. For example, if in the stored procedure multiple query statements exist, the SQL Server Query Store will store every query statement separately and get the query run time statistics from every query statement.
SQL Server查询存储从查询中提取每个查询语句。 例如,如果在存储过程中存在多个查询语句,则SQL Server查询存储将分别存储每个查询语句,并从每个查询语句获取查询运行时统计信息。
The unique query plan and query text, if new, will directly be passed to ASYNC Writer which will write it to disk.
唯一的查询计划和查询文本(如果有的话)将直接传递给ASYNC Writer,后者会将其写入磁盘。
The query run time statistics will not be directly written to the ASYNC Writer. The query run time statistics will be written at a specific time interval that is set in the Data Flush Interval (Minutes) option.
查询运行时统计信息将不会直接写入ASYNC Writer。 查询运行时间统计信息将以在“ 数据刷新时间间隔(分钟)”选项中设置的特定时间间隔写入。
The SQL Server Query Store gathers all information together no matter if the information is stored on the disk or in memory and shows them in built-in reports:
无论信息存储在磁盘还是内存中,SQL Server查询存储都会将所有信息收集在一起,并在内置报表中显示它们:
报告书 (Reports)
As mentioned earlier in the article, once enabled, the SQL Server Query Store will start to collect query runtime statistics and query Execution Plans. Built-in reports use collected data analyzing them and show them in grid or chart format depending on what is set in the reports.
如本文前面所述,启用后,SQL Server查询存储将开始收集查询运行时统计信息和查询执行计划。 内置报告使用收集的数据进行分析,并根据报告中的设置以网格或图表格式显示它们。
Currently, there are six built-in reports
当前,有六个内置报告
Regressed Queries is a built-in report that shows all queries that execution matrices are degraded in specific time range (last hour, day, week)
回归查询是一个内置报告,显示了在特定时间范围(最后一小时,一天,一周)执行矩阵降级的所有查询。
The Regressed Queries built-in report is divided in several pans. By default, the top 25 regressed queries in the last hour are shown.
“ 回归查询”内置报告分为几个窗格。 默认情况下,显示最近一小时内排名前25位的查询。
Here, different options can be set in order to see desired information. For example, if want to see the raw date instead of the graph press the button for showing regressed queries in a grid format:
在这里,可以设置不同的选项以查看所需的信息。 例如,如果要查看原始日期而不是图形,请按按钮以网格格式显示回归查询:
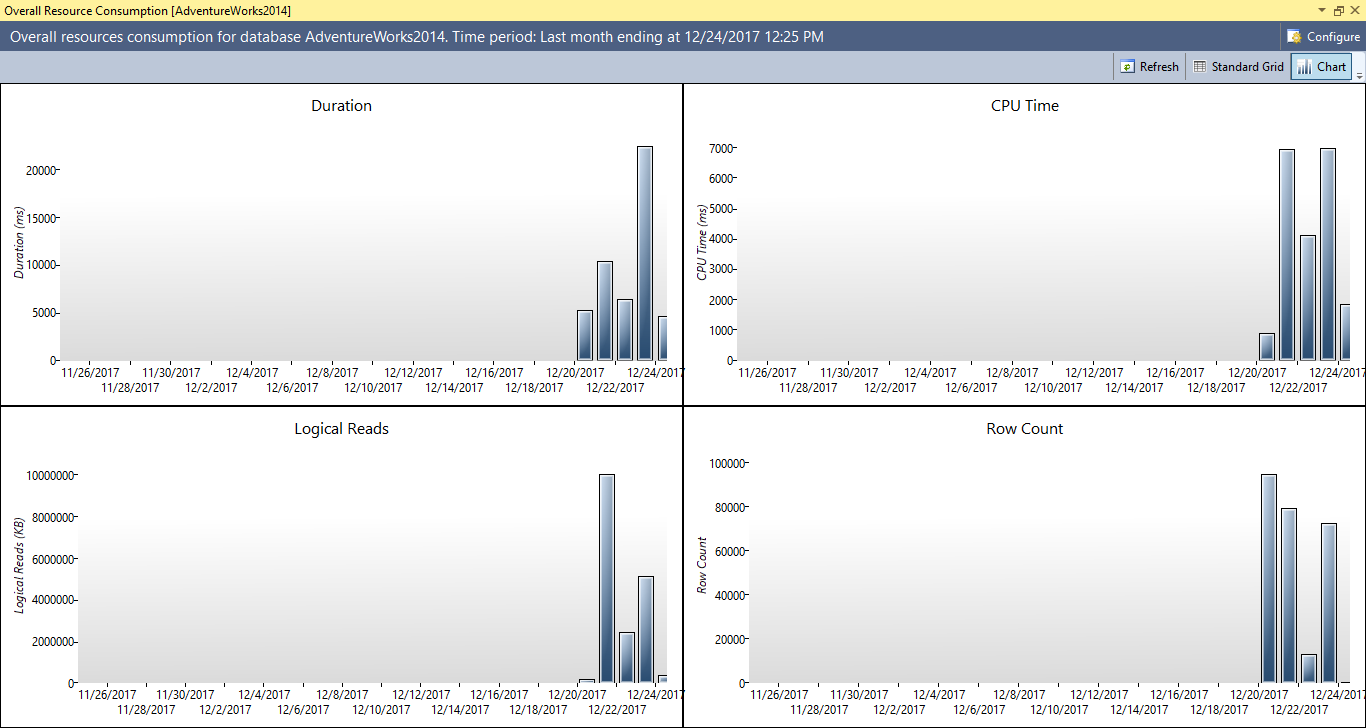
The Overall Resource Consumption built-in report shows summary resource consumption during the specific set of time. By default, results are shown for the last month and the results are shown in four charts: Duration, CPU Time, Logical Reads and Execution count:
内置的“ 总体资源消耗”报告显示特定时间段内的摘要资源消耗。 默认情况下,显示的是上个月的结果,结果显示在四个图表中:持续时间,CPU时间,逻辑读取和执行计数:
To set additional charts report, time and aggregation interval, press the Configure button and the Configure Overall Resource Consumption dialog will appear where different options can be set for the Overall Resource Consumption report:
要设置其他图表报告,时间和聚合间隔,请按“ 配置”按钮,将出现“ 配置 总体资源消耗”对话框,可以在其中为“ 总体资源消耗”报告设置不同的选项:
The Top Resource Consuming Queries built-in report shows, by default, the top 25 queries against specific database that consume most of resources like CPU Time, Memory Consumption, Physical Reads etc. over specific set of time:
内置的顶级资源消耗查询 报告 默认情况下显示针对消耗特定数据库的前25个查询 大多数 在特定时间范围内的资源,例如CPU时间,内存消耗,物理读取等:
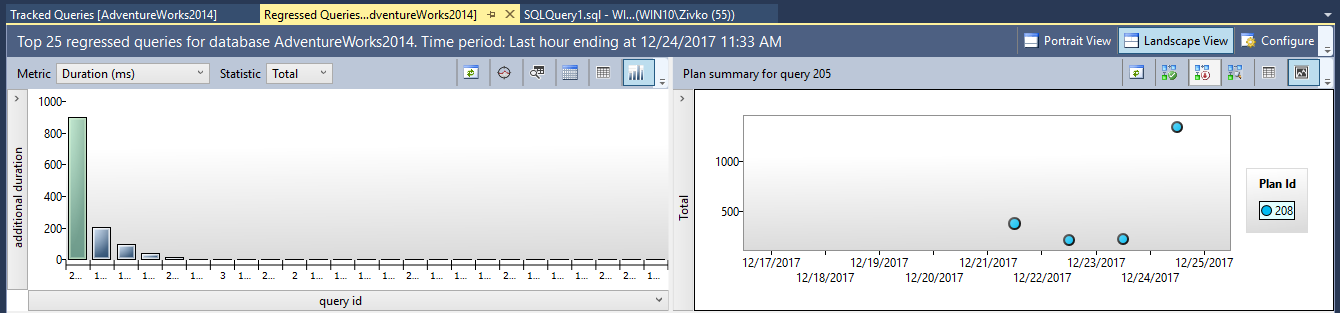
With the Tracked Queries built-in report, query runtime statistics and query Execution plans can be tracked for the specific query over time. In the Tracking query text box, enter the query id (e.g. 205) and press the green play button next to the Tracking query box:
使用“ 跟踪查询”内置报告,可以随时间跟踪特定查询的查询运行时统计信息和查询执行计划。 在“ 跟踪查询”文本框中,输入查询ID(例如205),然后按“跟踪查询”框旁边的绿色播放按钮:
The Queries With Forced Plans built-in report shows all forced Execution Plans for specific queries:
带有强制计划的查询内置报告显示了特定查询的所有强制执行计划:
To force SQL Server to use a specific Execution Plan for the particular query, in the Regressed Queries, Top Resource Consuming Queries, Queries With Hight Variation or Tracked Queries built-in reports, first select the Execution Plan Id and click the Force Plan button:
若要强制SQL Server对特定查询使用特定的执行计划,请在“回归查询”,“资源消耗最大的查询”,“变异较大的查询”或“跟踪的查询”内置报告中,首先选择“ 执行计划ID” ,然后单击“ 强制计划”按钮:
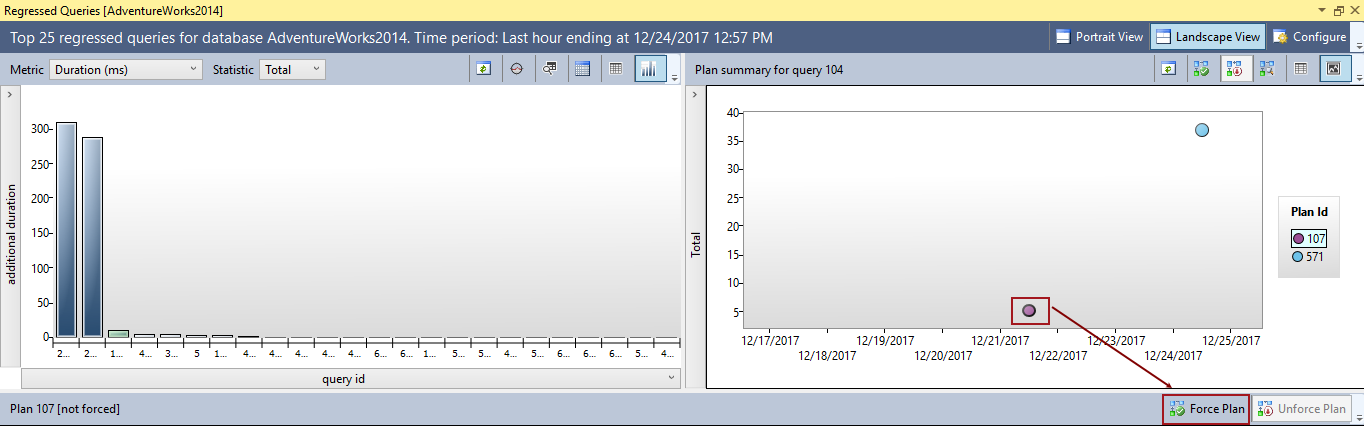
Press the Yes button on the Confirmation message box:
在确认消息框中按是按钮:
By doing this, you force SQL Server to use this Execution Plan for specific query from now on when that query is executed. This means that SQL Server will not generate a new Execution Plans for that query until unforce that plan.
通过这样做,您强制SQL Server从现在开始执行该查询时就对该特定查询使用该执行计划。 这意味着在取消强制执行该计划之前,SQL Server不会为该查询生成新的执行计划。
To unforce SQL Server to use a specific Execution Plan for the particle query in the Queries With Forced Plans, Regressed Queries, Top Resource Consuming Queries, Queries With High Variation or Tracked Queries report, select the Execution Plan and press the Unforce Plan button:
若要在强制计划查询,回归查询,顶级资源消耗查询,高变异性查询或跟踪查询报表中强制SQL Server对粒子查询使用特定的执行计划,请选择执行计划,然后按“ 强制计划”按钮:
In the Confirmation message box, press the Yes button to confirm removing forced Execution Plan:
在“ 确认”消息框中,按“ 是”按钮以确认删除强制执行计划:
This will remove the Execution Plan from the Queries With Forced Plans report.
这将从“带有强制计划的查询”报告中删除执行计划。
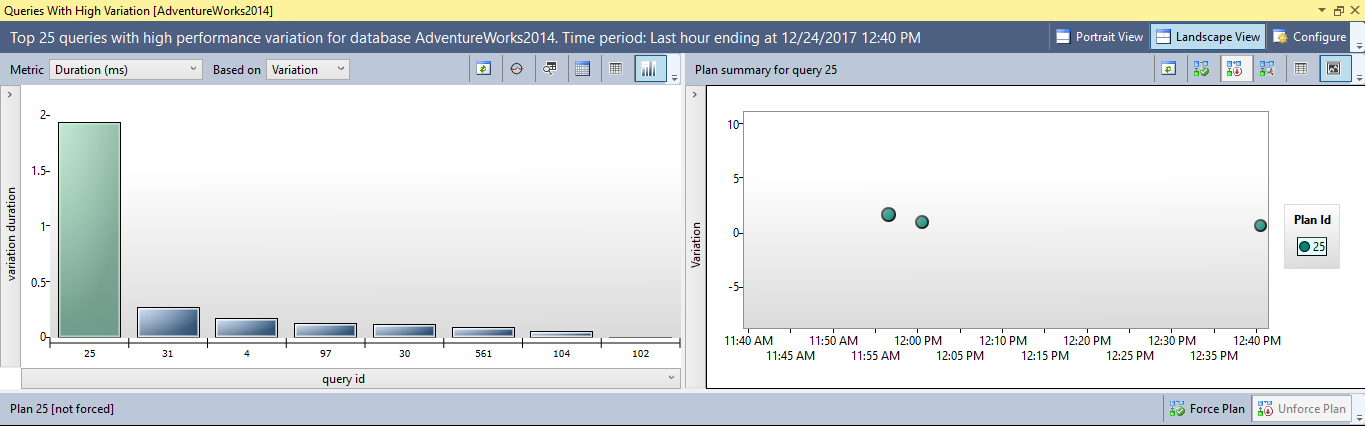
The Queries With High Variation built-in report analyze the queries and show the queries with the most frequent parameterization problems:
内置的“具有高变化量的查询”报告分析查询并显示最频繁出现参数化问题的查询:
结论 (Conclusion)
The SQL Server Query Store is an powerful feature, for users of SQL Server 2016 and higher, that keeps tracking of query runtime execution and query execution plans, monitoring and analyzing the performance of queries and showing results in built-in reports. This provides powerful new capabilities comparedto previous methods DBAs were relegated to using in previous versions of SQL Server
对于SQL Server 2016及更高版本的用户,SQL Server查询存储是一项强大的功能,它可以跟踪查询运行时执行和查询执行计划,监视和分析查询的性能并在内置报告中显示结果。 与先前在SQL Server的先前版本中使用DBA的方法相比,此方法提供了强大的新功能。
翻译自: https://www.sqlshack.com/sql-server-query-store-overview/
SQL Server查询存储–概述相关推荐
- ssms .net3.5_SSMS 18.4中SQL Server查询存储选项
ssms .net3.5 In this article, we will run through the new options added in the Query Store with SSMS ...
- 运行中SQL Server查询存储
介绍 (Introduction) The Query Store is a new feature in SQL Server 2016 that will greatly improve the ...
- SQL Server查询所有数据库下模式schema
SQL Server查询所有数据库下模式名 需求描述 找到SQL Server里所有数据库下的schema.输出格式为数据库名.模式名. 背景补充 关于SQL Server需要简单介绍下,从数据库对象 ...
- athena sql_使用SQL Server查询Amazon Athena外部表
athena sql This article covers the following topics: 本文涵盖以下主题: Overview of the Amazon Athena 亚马逊雅典娜概 ...
- Sql Server查询性能优化之索引篇【推荐】
Sql Server查询性能优化之索引篇[推荐] 这篇是索引系列中比较完整的,经过整理而来的 一 索引基础知识 索引概述 1.概念 可以把索引理解为一种特殊的目录.就好比<新华字典>为了加 ...
- SQL SERVER大话存储结构(2)
阅读目录(Content) 1 行记录如何存储 1.1 堆表 1.2 聚集索引表格 2 非聚集索引结构 3 非聚集索引键值内容 3.1 堆表上的非聚集索引 3.2 聚集索引表(唯一)的非聚集索引 3. ...
- SQL Server 查询性能优化——覆盖索引(二)
在SQL Server 查询性能优化--覆盖索引(一) 中讲了覆盖索引的一些理论. 本文将具体讲一下使用不同索引对查询性能的影响. 下面通过实例,来查看不同的索引结构,如聚集索引.非聚集索引.组合索 ...
- SQL Server查询执行计划–基础
为什么查询执行对SQL Server性能很重要? (Why is query execution important for SQL Server performance?) SQL Server性能 ...
- sql server 缓存_了解SQL Server查询计划缓存
sql server 缓存 Whenever a query is run for the first time in SQL Server, it is compiled and a query p ...
最新文章
- 做产品16年,我有9条心得--百度贴吧前负责人
- 解决Jira和Confluence访问打开越来越缓慢问题
- SQL Date Utility
- 从考研说起:大学、职场、个人选择
- 炒鸡简单,带你快速撸一遍Numpy代码!
- java ==和equals的区别
- grasp设计模式应用场景_grasp设计模式笔记回顾
- Ubuntu 下安装 输入法
- webpack资源管理
- Equivalent String
- [转]六步使用ICallbackEventHandler实现无刷新回调
- Codeforces - Mother of Dragons
- COUNTIFS函数
- 移动web适配的方式
- IT男最新躺枪:武汉恋爱培训班教搭讪女孩技巧 学员多为IT男
- Linux进程的后台运行
- 删除所有奇数顺序表c语言,如何删除列表中的所有奇数序数项?
- 前端国际化如何对中文——>英文自动化翻译小demo
- 数据库 和html的交互
- 删除单号中的符号并查询快递物流信息