excel透视表计数去重_Excel数据透视表中的唯一计数
excel透视表计数去重
In a previous article, Roger Govier showed us a couple of different ways to get a Unique count with a Pivot Table.
在上一篇文章中,Roger Govier向我们展示了几种不同的方法来通过数据透视表获得唯一计数 。
- Create a Pivot of a Pivot Tables results (fast) 创建数据透视表的数据透视(快速)
- Add a calculated column to the source data (much slower) 将计算出的列添加到源数据(慢得多)
Now Roger has added another technique that you can use, in Excel 2013 and later. I'll hand things over to Roger, so he can describe the steps.
现在,Roger在Excel 2013及更高版本中添加了另一种可以使用的技术。 我将事情交给罗杰,以便他描述步骤。
添加到数据模型 (Add to Data Model)
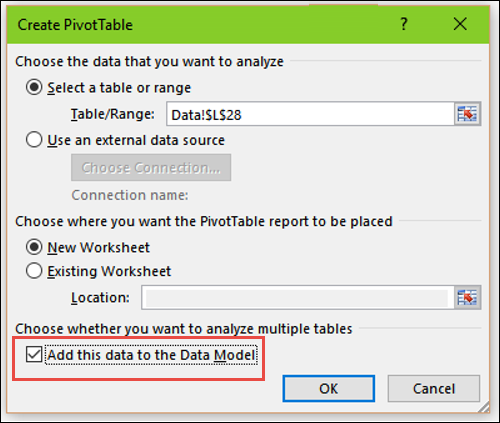
With the advances made by Microsoft with Power Pivot, and DAX (Data Expressions) formulae, which are more powerful than the inbuilt Excel functions, there is a way of obtaining a Distinct Count. From Excel 2013 onward, when creating a Pivot Table form any set of data, there is an option to Add this data to Data Model.
随着Microsoft在Power Pivot和DAX(数据表达式)公式方面所取得的进步,它们比内置的Excel函数更强大,因此有一种获取非重复计数的方法。 从Excel 2013开始 , 从数据集创建数据透视表时,可以选择将数据添加到数据模型。
When you select this option, Excel treats the data as being loaded into Power Pivot, as opposed into the older Pivot Table.
选择此选项后,Excel会将数据视为已加载到Power Pivot中,而不是旧数据透视表中。
我的默认选择 (My Default Choice)
Even though you might not want to be combining data from multiple tables and creating relationships between tables, this is now my default choice when I create a Pivot Table.
即使您可能不想合并多个表中的数据并在表之间创建关系,现在这也是我创建数据透视表时的默认选择。
Then, when creating the PT, and dragging an item to the Values area, when you click on Value Field settings, and scroll to the bottom, there is a new measure that has been added called Distinct Count.
然后,在创建PT并将项目拖到“值”区域时,单击“值字段”设置并滚动到底部,将添加一个名为“非重复计数”的新度量。
看到不同的计数 (See a Distinct Count)
Choosing this Measure, as opposed to Count, does indeed give you a unique count as can be seen in the following PT example.
与Count相反,选择此度量确实可以为您提供唯一的计数,如下面的PT示例所示。
For each Salesperson, I allocated Product to the Values area twice, once as Count and once as Distinct Count, and I did the same for Customers.
对于每个销售人员,我将产品两次分配到“值”区域,一次分配为“计数”,一次分配为“非重复计数”,而我对“客户”也执行相同的操作。
NOTE: Distinct Count of Product is a measure you wouldn't need, as it clearly has to be the same as the number of Products sold, 5. It has only been included for illustrative purposes.
注意:“产品的不同数量”是您不需要的度量,因为它显然必须与所售产品的数量相同。5.仅出于说明目的将其包括在内。
项数 (Count of Items)
As you can see the Count of Product is the same as the Count of Customer, which is not at all surprising as it is the count of all of the transactions made by these particular Salespeople.
如您所见,产品数量与客户数量相同,这并不奇怪,因为它是这些特定销售人员进行的所有交易的数量。
(The image is trimmed below, to show Barry's Count of Product and Count of Customer, at a larger font size.)
(下面的图像进行了裁剪,以较大的字体显示Barry的产品数和客户数。)
客户的不同数量 (Distinct Count of Customer)
But, the Distinct Count of Customer shows that even though there were 41, 42 and 27 transactions by the three Salespeople shown, they made those sales to 11, 12 and 13 Unique Customers in each case, showing there have been multiple sales to the same Customer.
但是,“不同客户数量”显示,即使显示的三个销售人员分别进行了41、42和27个交易,但他们在每种情况下都分别向11、12和13个唯一客户进行了销售,表明同一笔交易有多个顾客。
(The image is trimmed below, to show Barry's Count of Customer and Distinct Count of Customer, at a larger font size.)
(下面的图像进行了裁剪,以较大的字体显示Barry的客户数和客户的不同数。)
使用此方法 (Use This Method)
This is a much easier method than those I have shown in earlier articles, so if you have Excel 2013 or 2016, or Office 365, then this is definitely the way to go. So, even if you don't need all of the other advantages of Power Pivot, it is always worth choosing the option to add data to the Data Model for all of the new Pivot Tables that you create.
与我之前的文章中介绍的方法相比,这是一种简单得多的方法,因此,如果您拥有Excel 2013或2016或Office 365,则绝对是一种方法。 因此,即使您不需要Power Pivot的所有其他优点,也始终值得选择为您创建的所有新数据透视表向数据模型添加数据的选项。
Big thanks to Microsoft for introducing this long awaited feature, and for making it so easy for people to use without having to get into learning DAX (although there are many benefits from doing so).
非常感谢Microsoft引入了这一期待已久的功能,并使其易于使用,而无需学习DAX(尽管这样做有很多好处)。
获取样本文件 (Get the Sample File)
Thanks to Roger, for explaining how we can easily get a distinct count now! It's easy to overlook that "Add this data to the Data Model" check box, when creating a pivot table. Or, if you aren't aware of the benefits, you wouldn't bother to check it.
感谢罗杰(Roger),解释了我们现在如何轻松获得独特的计数! 创建数据透视表时,很容易忽略“将数据添加到数据模型”复选框。 或者,如果您不了解好处,则无需费心检查它。
If you'd like to download Roger's sample file, from his earlier tutorial, you can go to my Contextures website. Visit the different ways to get a Unique count page, and go to the Download the sample file section. You can use that data to create a new pivot table, and remember to check the "Add this data to the Data Model" box!
如果您想从Roger的较早教程中下载其示例文件,则可以转到我的Contextures网站。 访问获取“唯一计数”页面的不同方法 ,然后转到“下载示例文件”部分。 您可以使用该数据创建新的数据透视表,并记得选中“将此数据添加到数据模型”框!
翻译自: https://contexturesblog.com/archives/2016/02/25/count-unique-in-excel-pivot-table/
excel透视表计数去重
http://www.taodudu.cc/news/show-3297521.html
相关文章:
- Excel 透视图
- java excel 透视_Java在Excel中创建透视表方法解析
- python处理excel数据透视表_Python也能轻松做出Excel透视表的效果,一切技巧全在这里...
- java excel 透视_Java Excel透视表相关操作实现代码
- java excel 透视_java基于poi导出excel透视表代码实例
- 2017年Android开源项目及库汇总
- 前端知识体系1:【css/js/vue/es6/手写/安全/优化】
- python小球在窗口弹来弹去_《Python游戏趣味编程》 第2章 弹跳的小球
- 400倍加速,PolarDB HTAP 实时数据分析技术解密
- R语言 数理统计
- Python数据分析基础【建模篇】
- 400倍加速, PolarDB HTAP实时数据分析技术解密
- 使用爬虫爬取移动端数据
- 70款常用的免费数据源分享(最新)
- 校园网AP隔离情况下用户互通的几种方法总结
- Adaptive AUTOSAR (AP) 平台设计(8)——诊断
- AP Autosar平台设计 10 Persistency持久性/可靠性存储
- 用友软件T3数据库表结构表名、数据字典
- Adaptive AUTOSAR (AP) 平台设计(12)——UCM
- 简单的统计教学方式——NCSS
- AP Autosar平台设计 9 诊断
- ap计算机科学a 5分,新鲜出炉2019年AP考试5分率分析,尝鲜版来啦~~
- 《数据处理与知识发现》章节测验复习
- Adaptive AUTOSAR (AP) 平台设计(9)——Persistency
- ap计算机教材pdf百度云,AP计算机A:你需要知道的信息
- Fragment 与 Viewpager 联合使用在网络上获取图片
- jQuery数组处理
- 诸子百家
- jQuery数组处理完全详解
- jQuery数组处理详解
excel透视表计数去重_Excel数据透视表中的唯一计数相关推荐
- python数据透视表计数去除重复_excel透视表计数去重_Excel数据透视表中的唯一计数...
In a previous article, Roger Govier showed us a couple of different ways to get a Unique count with ...
- excel按季度分类汇总_excel数据透视表按月汇总
Q4:excel中如何建立数据透视表? 从0到1轻松教会你使用Excel数据透视表,要想学好Excel数据透视表,你至少要学会下面的这些知识点,今天我选择几个重要的模块给你讲解:001 拖拽之间创建数 ...
- excel按季度分类汇总_Excel数据透视不会,分类汇总来帮忙,强的不是一点,学会它,错不了...
Excel数据透视不会,分类汇总来帮忙,强的不是一点,学会它,错不了 大家办公经常要用到Excel处理数据,想要对成千上万条数据做分类汇总,则需要做数据透视表和分类汇总功能:在数据量适中即小于万条时, ...
- excel透视表计数去重_在工作表上对Excel自动筛选进行计数
excel透视表计数去重 It seemed simple enough, but counting the AutoFilters on an Excel sheet is a tough job! ...
- html行标签并列显示,excel数据透视表_excel数据透视表怎样不显示汇总
EXCEL中的数据透视表有什么作用,用在哪些方面? excel2010数据透视表怎么做 excel2010数据透视表做法,需要用户打开需要编辑的文件,进入后点击数据透视表,选中我们需要统计的数据,默认 ...
- Excel:用宏批量更改数据透视表中数据汇总方式
有时Excel数据透视表中的值字段较多,我这有64个值字段,因为数据默认汇总方式是"求和".如果要全部更改其汇总方式,如将下图数据透视表中所有值字段的汇总方式由"求和&q ...
- Excel 数据透视表小技巧之 06 使用 Excel 数据透视表作为另一个数据透视表的数据源
我在 excel 中有一个使用原始表作为其数据源的数据透视表.这个数据透视表正在对行进行一组分组和求和.我现在想使用这个新数据透视表的结果作为新数据透视表的数据源,它将进一步修改这些数据.这可以用ex ...
- Excel的数据透视表怎么弄 ?数据透视表怎么做汇总求和
使用Excel进行求和,除了运用函数之外,还可以插入数据透视表进行求和,数据透视表怎么做呢?小编使用WPS里的Excel给大家演示一遍. 步骤一:打开需要求和的表格,点击最上方的工具栏里的" ...
- excel 第6讲:认识数据透视表
一.数据透视表 1.创建数据逶视表 一列为一个字段,一行为一条记录. 在数据透视表上的值,任意选择一个双击可以返回原数据的表,来展示数据的来源. 2.更改数据透视表汇总方式 在数据透视表中,双击表头的 ...
最新文章
- TrackID识别音乐的应用不能用了
- 合并多个Word文档
- 雷达多普勒频率计算公式_雷达系统的用途、分类,影响雷达性能的关键要素
- java web使用jquery,JAVA_Web_JQuery
- Swift中文教程(二十) 扩展
- 用T-SQL修改数据库的恢复模型
- 阿里云携手印度电信巨头 网络互连覆盖150个国家地区
- PyQt5教程 - QtDesigner窗口设计工具的使用
- hololens与混合现实开发pdf_增强现实与虚拟现实:过去和未来
- Java从json串中获取某个值
- 我的世界服务器怎么修改标语,我的世界怎么用资源包修改闪烁标语
- 数据分析师常用工具有哪些?初学者必看
- space-evenly的兼容性问题
- Firefox(火狐浏览器)常见插件应用
- mysql workbench怎么_MySQL Workbench怎么用?MySQL Workbench详细使用教程
- vue.js devtools
- html 重复一百次 代码,重复一百次
- 热电偶集电环与热电阻的区别是什么
- 【方法】blob类型地址的图片下载
- 装饰边框 与 被装饰物 一致的 Decorator模式