数据eda_银行数据EDA:逐步
数据eda
This banking data was retrieved from Kaggle and there will be a breakdown on how the dataset will be handled from EDA (Exploratory Data Analysis) to Machine Learning algorithms.
该银行数据是从Kaggle检索的,将详细介绍如何将数据集从EDA(探索性数据分析)转换为机器学习算法。
脚步: (Steps:)
- Identification of variables and data types识别变量和数据类型
- Analyzing the basic metrics分析基本指标
- Non-Graphical Univariate Analysis非图形单变量分析
- Graphical Univariate Analysis图形单变量分析
- Bivariate Analysis双变量分析
- Correlation Analysis相关分析
资料集: (Dataset:)
The dataset that will be used is from Kaggle. The dataset is a bank loan dataset, making the goal to be able to detect if someone will fully pay or charge off their loan.
将使用的数据集来自Kaggle 。 该数据集是银行贷款数据集,其目标是能够检测某人是否将完全偿还或偿还其贷款。
The dataset consist of 100,000 rows and 19 columns. The predictor (dependent variable) will be “Loan Status,” and the features (independent variables) will be the remaining columns.
数据集包含100,000行和19列。 预测变量(因变量)将为“贷款状态”,要素(因变量)将为剩余的列。
变量识别: (Variable Identification:)
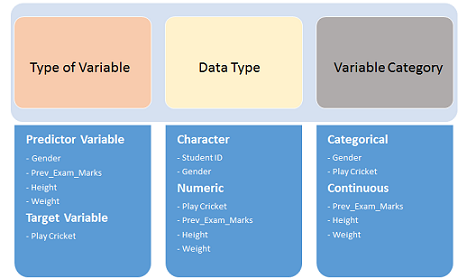
The very first step is to determine what type of variables we’re dealing with in the dataset.
第一步是确定数据集中要处理的变量类型。
df.head()
We can see that there are some numeric and string (object) data types in our dataset. But to be certain, you can use:
我们可以看到我们的数据集中有一些数字和字符串(对象)数据类型。 但可以肯定的是,您可以使用:
df.info() # Shows data types for each column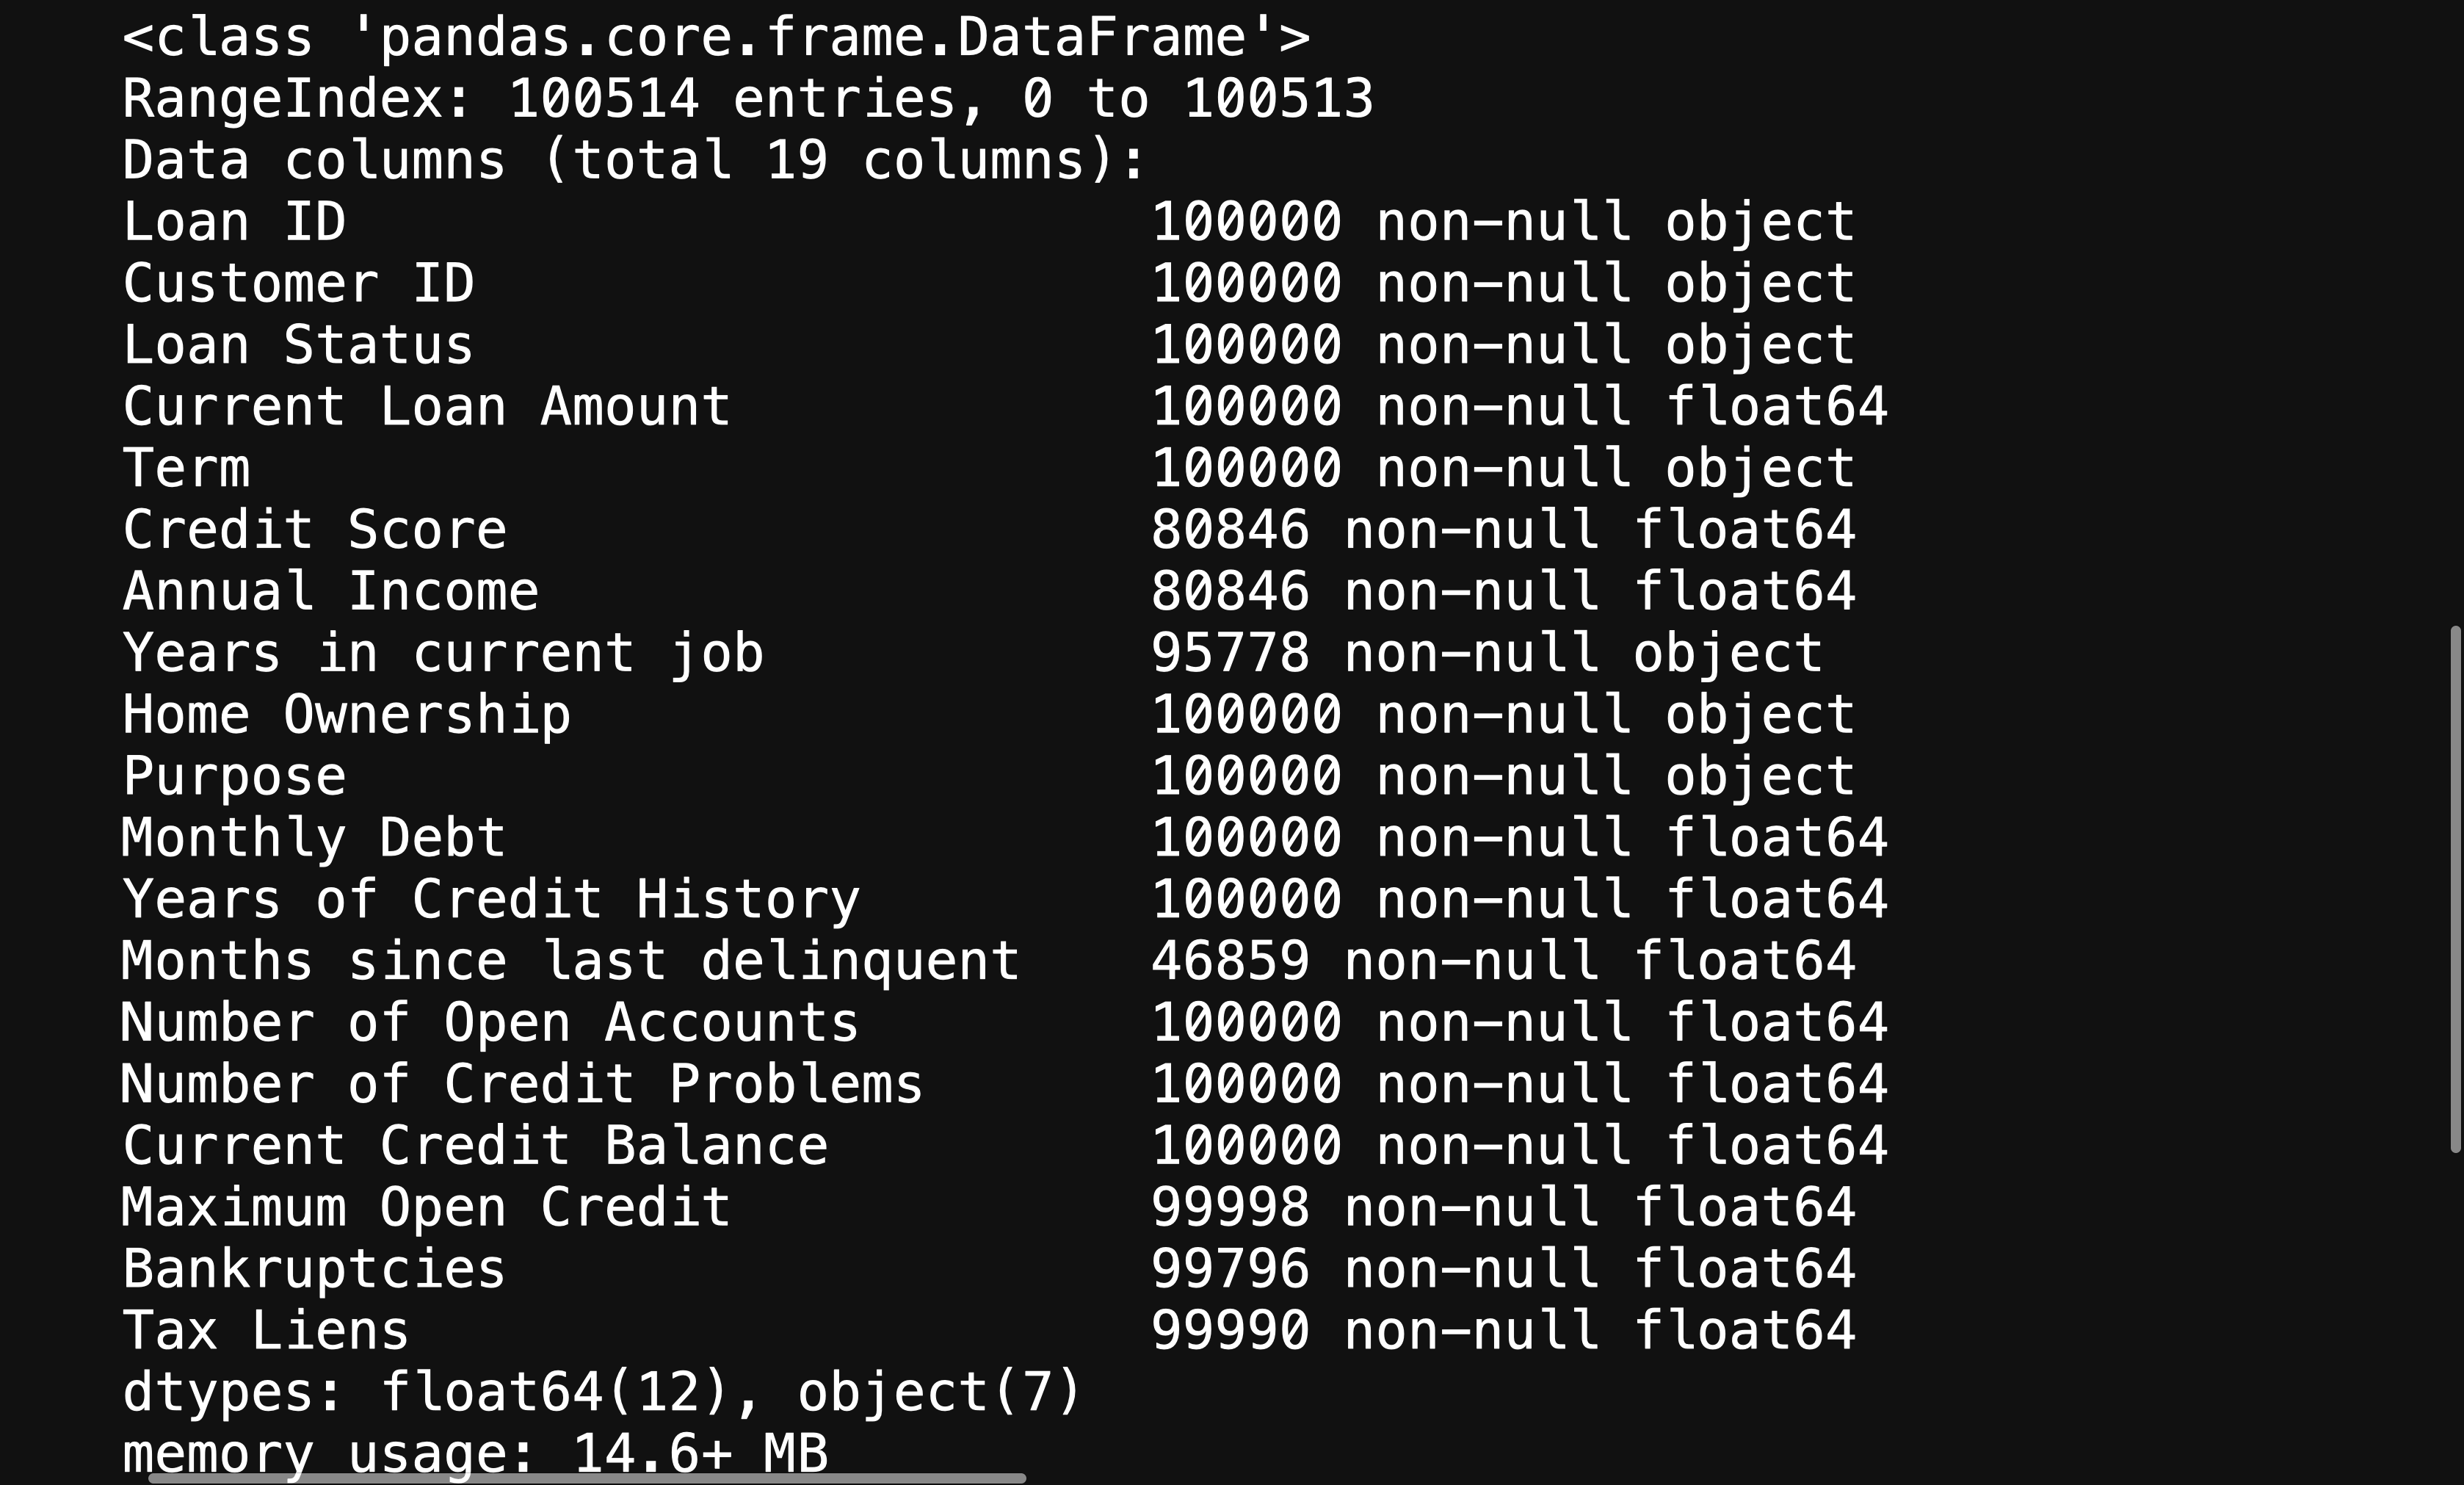
This will give you further information about your variables, helping you figure out what will need to be changed in order to help your machine learning algorithm be able to interpret your data.
这将为您提供有关变量的更多信息,帮助您确定需要更改哪些内容,以帮助您的机器学习算法能够解释您的数据。
分析基本指标 (Analyzing Basic Metrics)
This will be as simple as using:
这就像使用以下命令一样简单:
df.describe().T
This allows you to look at certain metrics, such as:
这使您可以查看某些指标,例如:
- Count — Amount of values in that column计数-该列中的值数量
- Mean — Avg. value in that column均值-平均 该列中的值
- STD(Standard Deviation) — How spread out your values areSTD(标准偏差)—您的价值观分布如何
- Min — The lowest value in that column最小值-该列中的最小值
- 25% 50% 70%— Percentile25%50%70%—百分位数
- Max — The highest value in that column最大值-该列中的最大值
From here you can identify what your values look like, and you can detect if there are any outliers.
在这里,您可以确定值的外观,并可以检测是否存在异常值。
From doing the .describe() method, you can see that there are some concerning outliers in Current Loan Amount, Credit Score, Annual Income, and Maximum Open Credit.
通过执行.describe()方法,您可以看到在当前贷款额,信用评分,年收入和最大未结信贷中存在一些与异常有关的问题。
非图形单变量分析 (Non-Graphical Univariate Analysis)
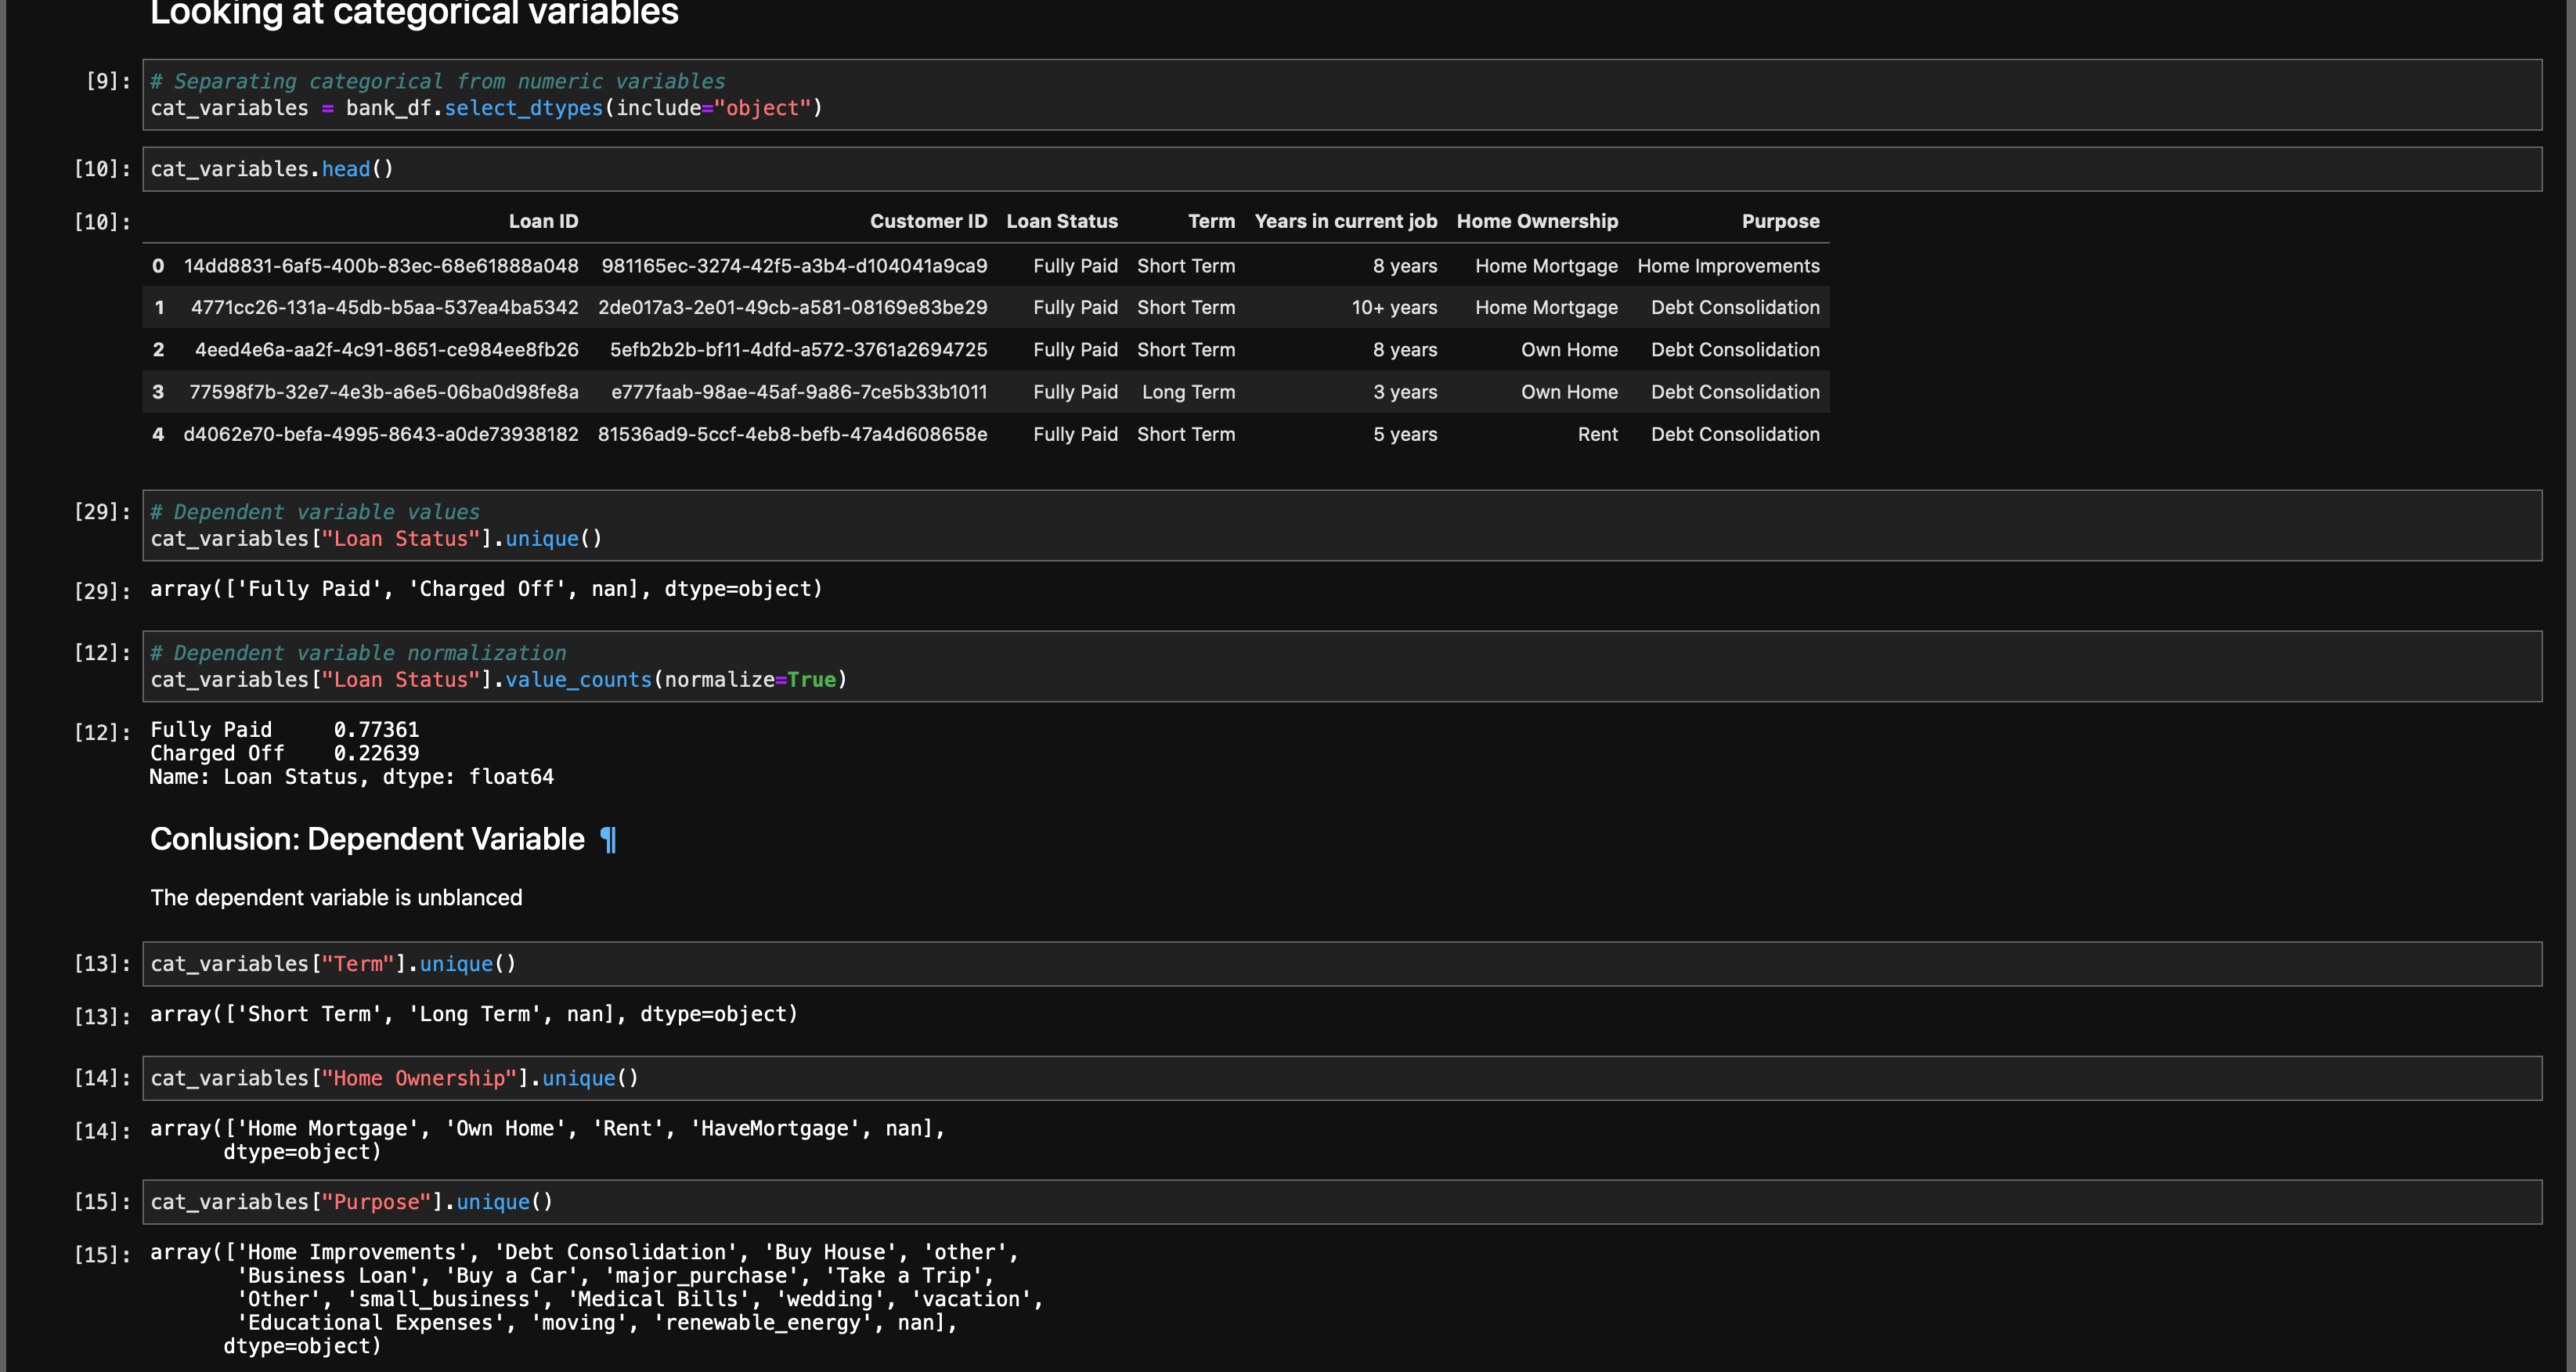
Univariate Analysis is when you look at statistical data in your columns.
单变量分析是当您查看列中的统计数据时。
This can be as simple as doing df[column].unique() or df[column].value_counts(). You’re trying to get as much information from your variables as possible.
这可以像执行df [column] .unique()或df [column] .value_counts()一样简单。 您正在尝试从变量中获取尽可能多的信息。
You also want to find your null values
您还想找到空值
df.isna().sum()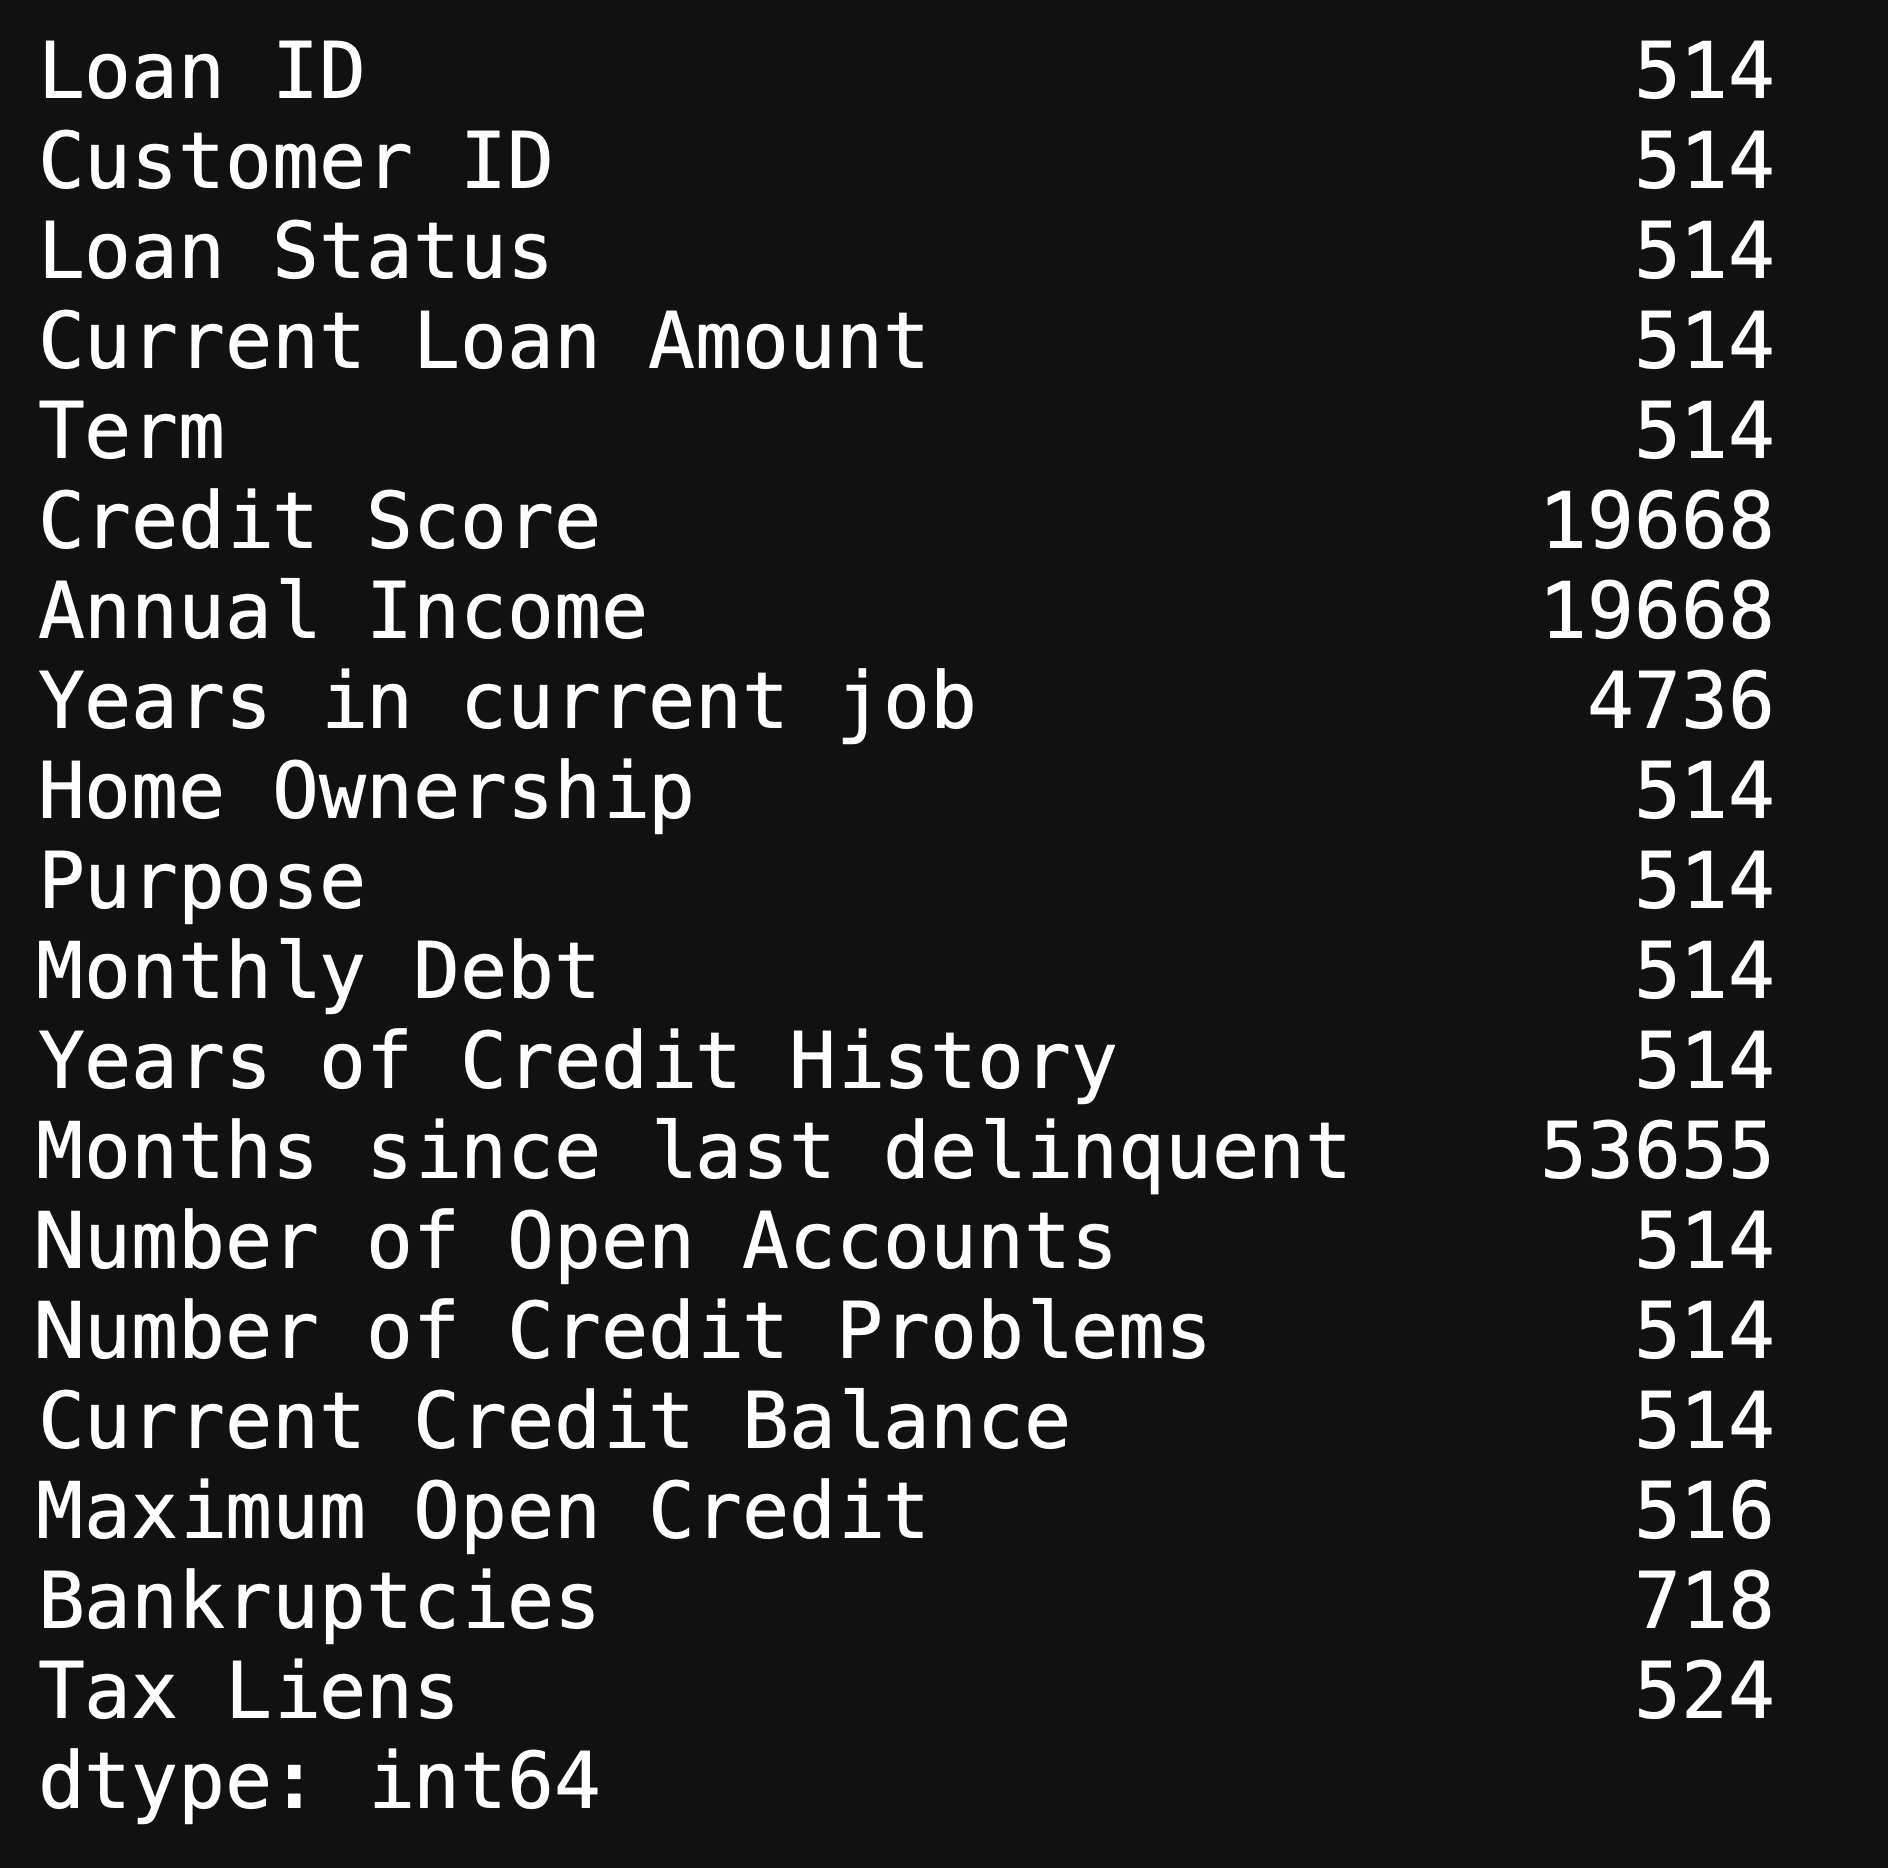
This will show you the amount of null values in each column, and there are an immense amount of missing values in our dataset. We will look further into the missing values when doing Graphical Univariate Analysis.
这将向您显示每列中的空值数量,并且我们的数据集中有大量的缺失值。 在进行图形单变量分析时,我们将进一步研究缺失值。
图形单变量分析 (Graphical Univariate Analysis)
Here is when we look at our variables using graphs.
这是我们使用图形查看变量的时候。
We can use a bar plot in order to look at our missing values:
我们可以使用条形图来查看缺失值:
fig, ax = plt.subplots(figsize=(15, 5))x = df.isna().sum().indexy = df.isna().sum()ax.bar(x=x, height=y)ax.set_xticklabels(x, rotation = 45)plt.tight_layout();
Moving past missing values, we can also use histograms to look at the distribution of our features.
超越缺失值后,我们还可以使用直方图查看特征的分布。
df["Years of Credit History"].hist(bins=200)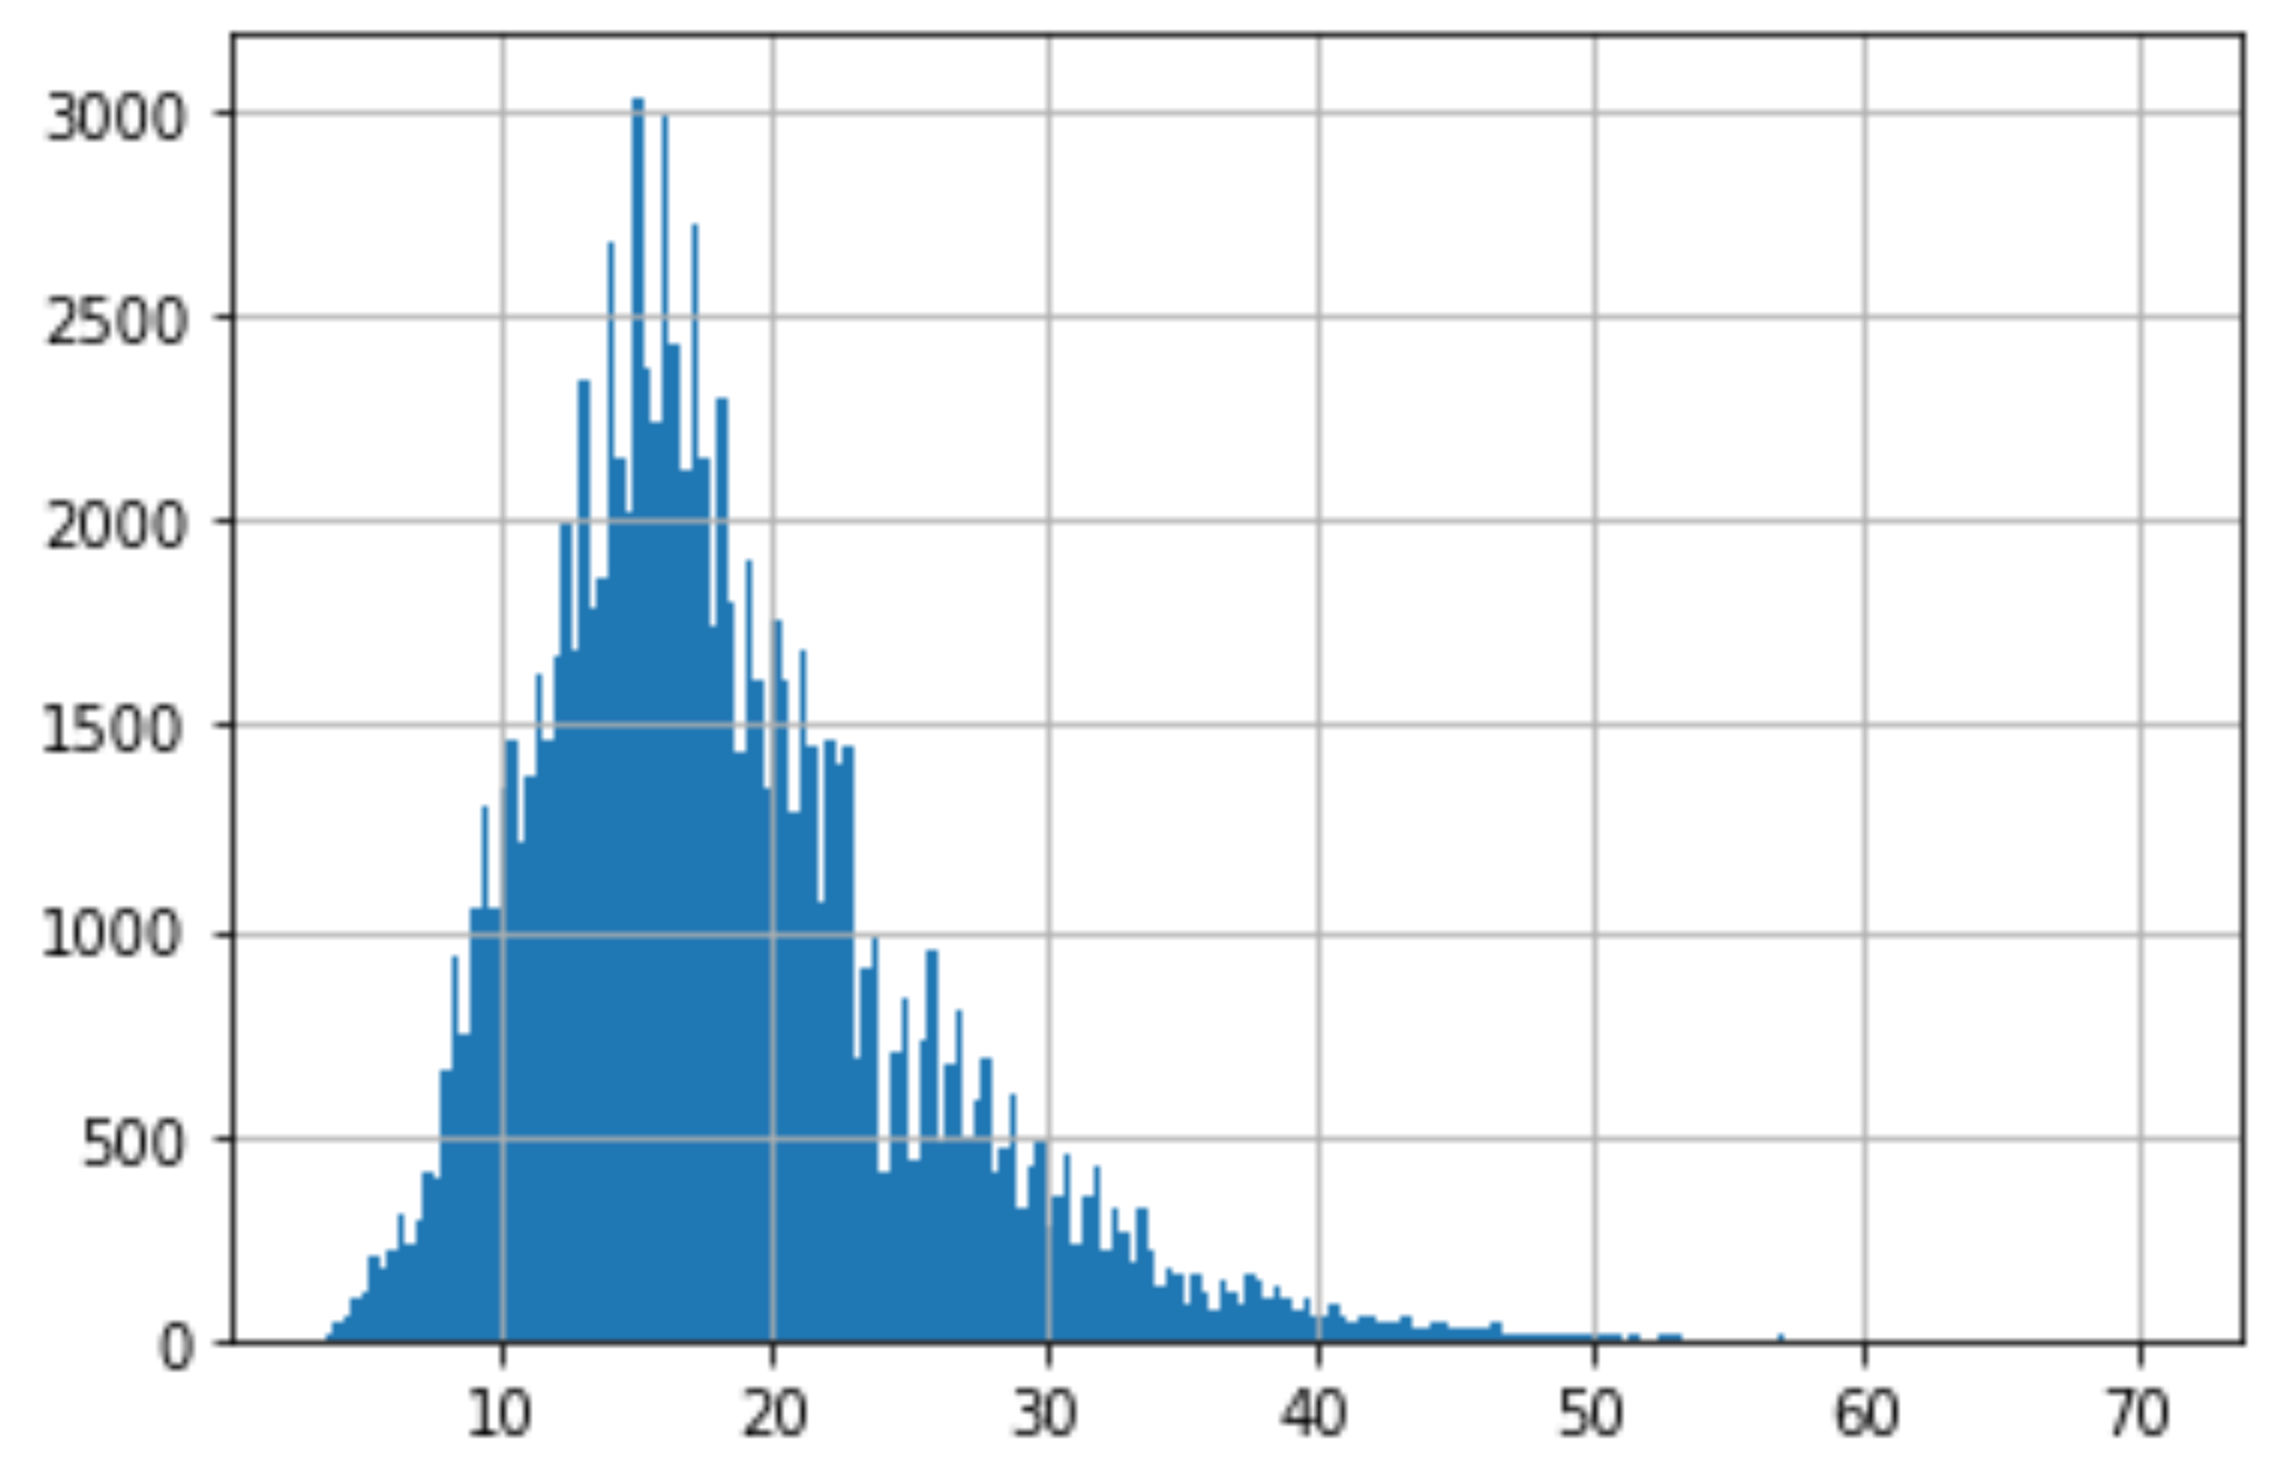
From this histogram you are able to detect if there are any outliers by seeing if it is left or right skew, and the one that we are looking at is a slight right skew.
从此直方图中,您可以通过查看它是否是左偏斜或右偏斜来检测是否存在异常值,而我们正在查看的是一个稍微偏斜的偏斜。
We ideally want our histograms for each feature to be close to a normal distribution as possible.
理想情况下,我们希望每个功能的直方图尽可能接近正态分布。
# Checking credit scoredf["Credit Score"].hist(bins=30)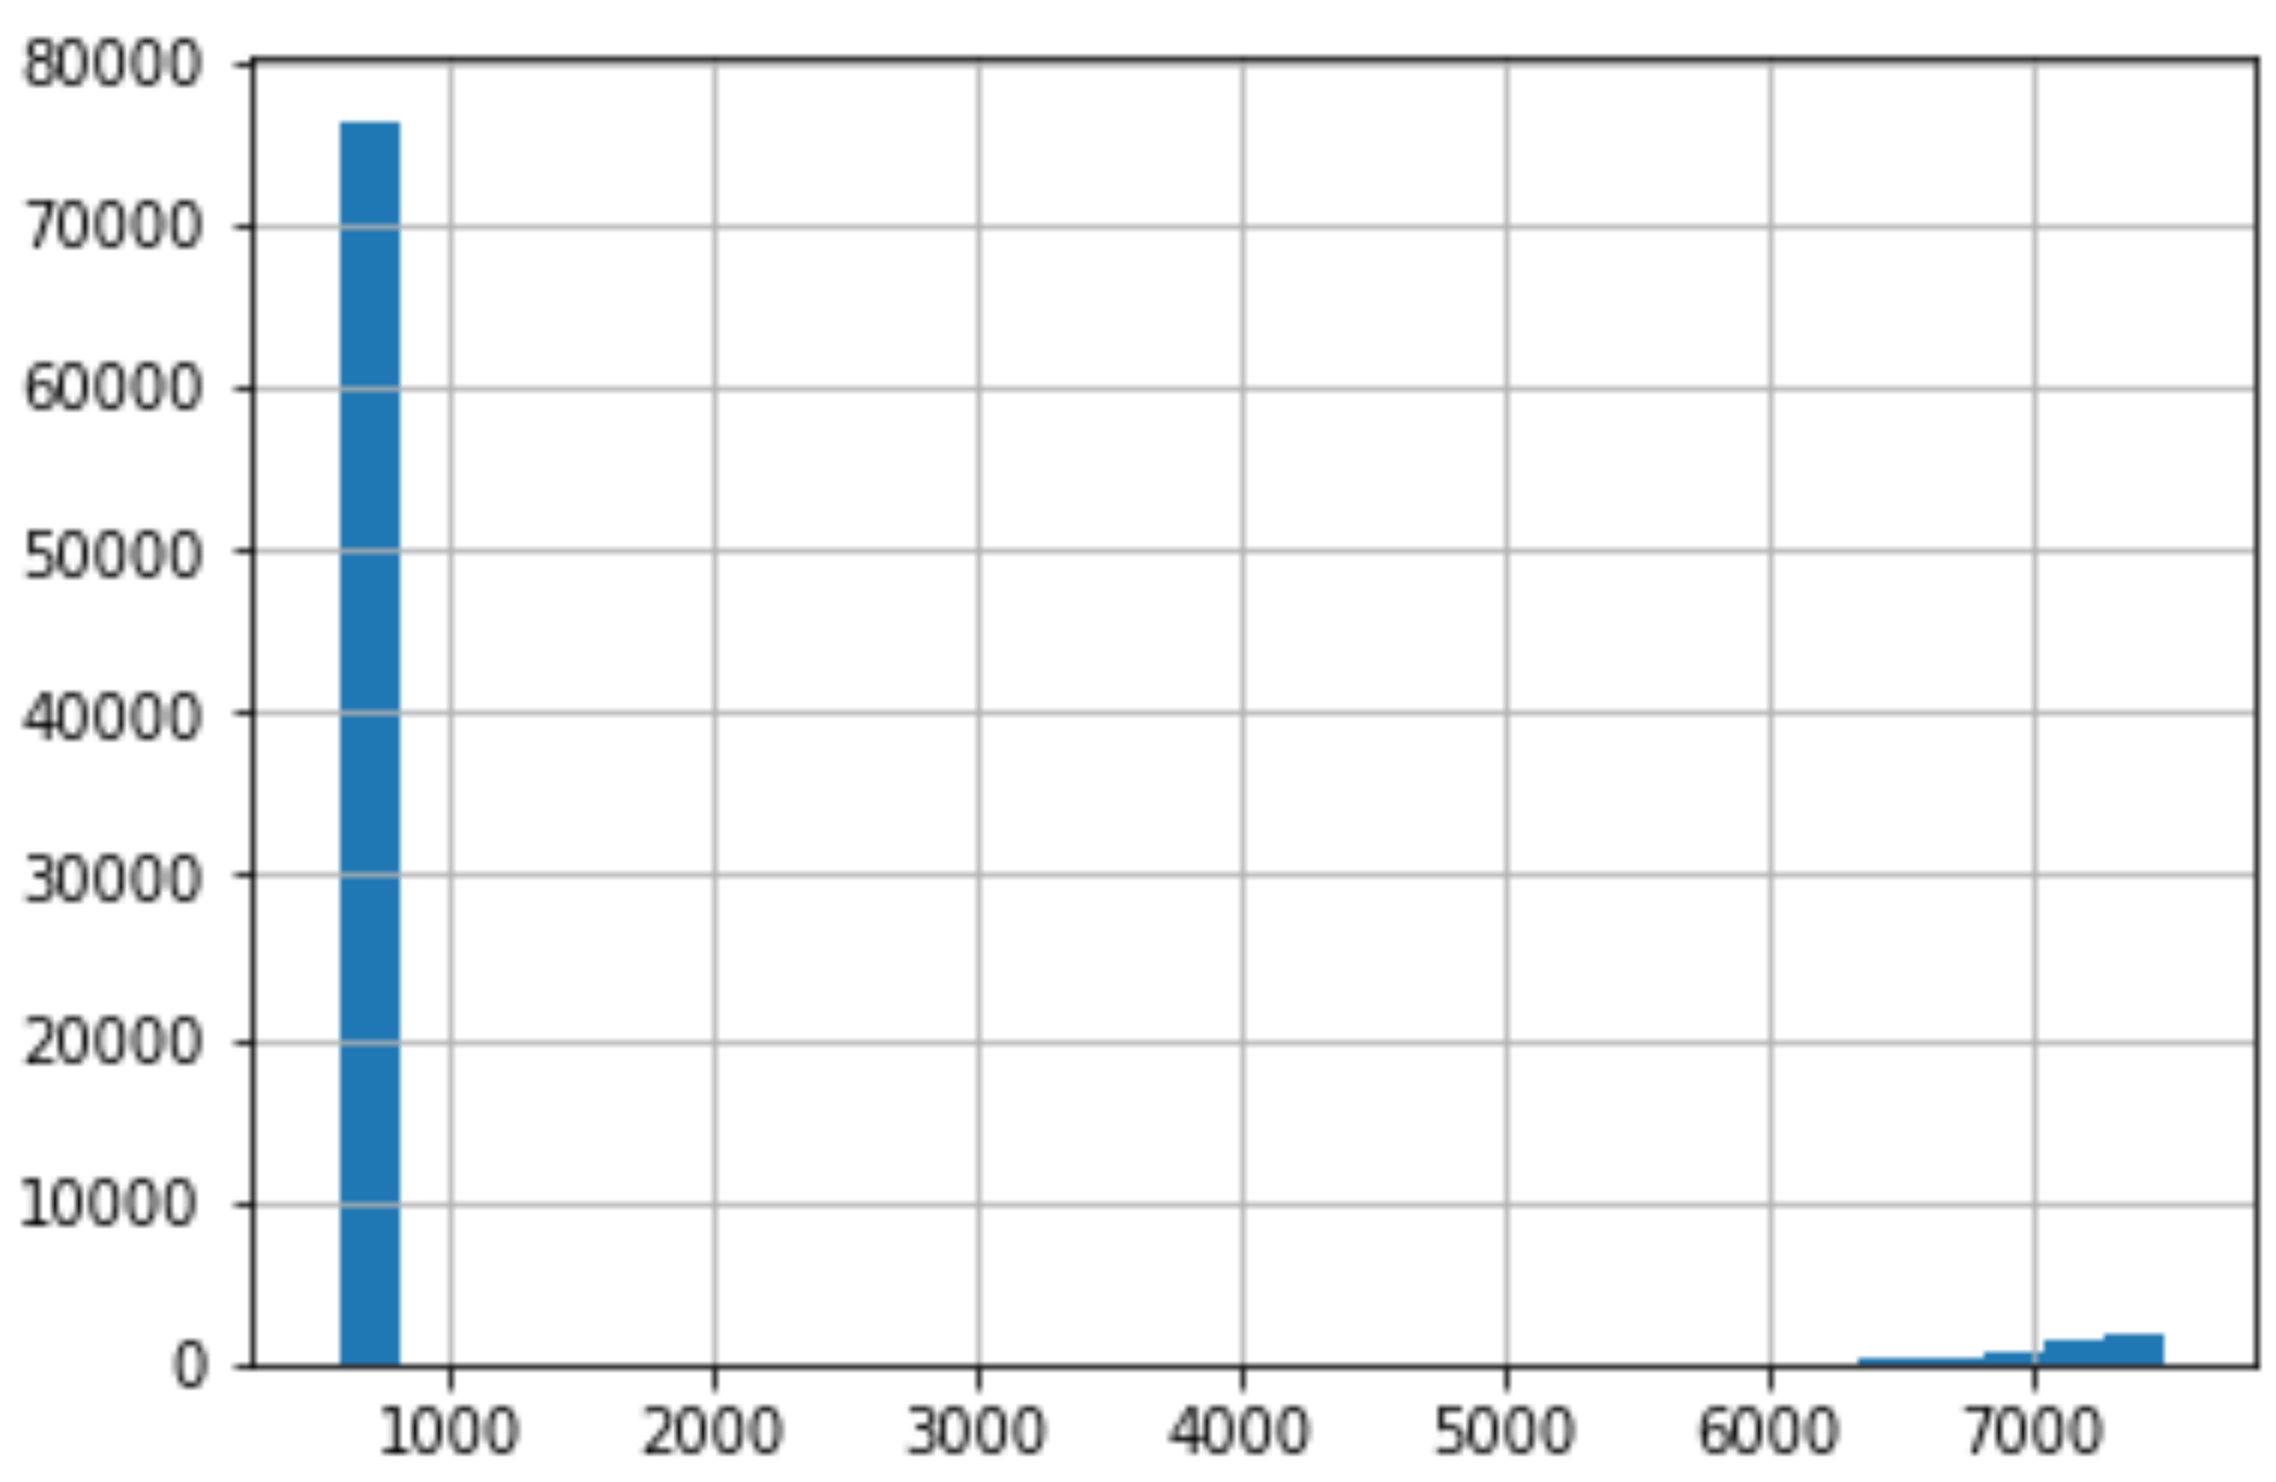
As we do the same thing for Credit Score, we can see that there is an immense right skew that rest in the thousands. This is very concerning because for our dataset, Credit Score is supposed to be at a 850 cap.
当我们对信用评分执行相同的操作时,我们可以看到存在成千上万的巨大右偏。 这非常令人担忧,因为对于我们的数据集而言,信用评分应设置为850上限。
Lets take a closer look:
让我们仔细看看:
# Rows with a credit score greater than 850, U.S. highest credit score.df.loc[df["Credit Score"] > 850]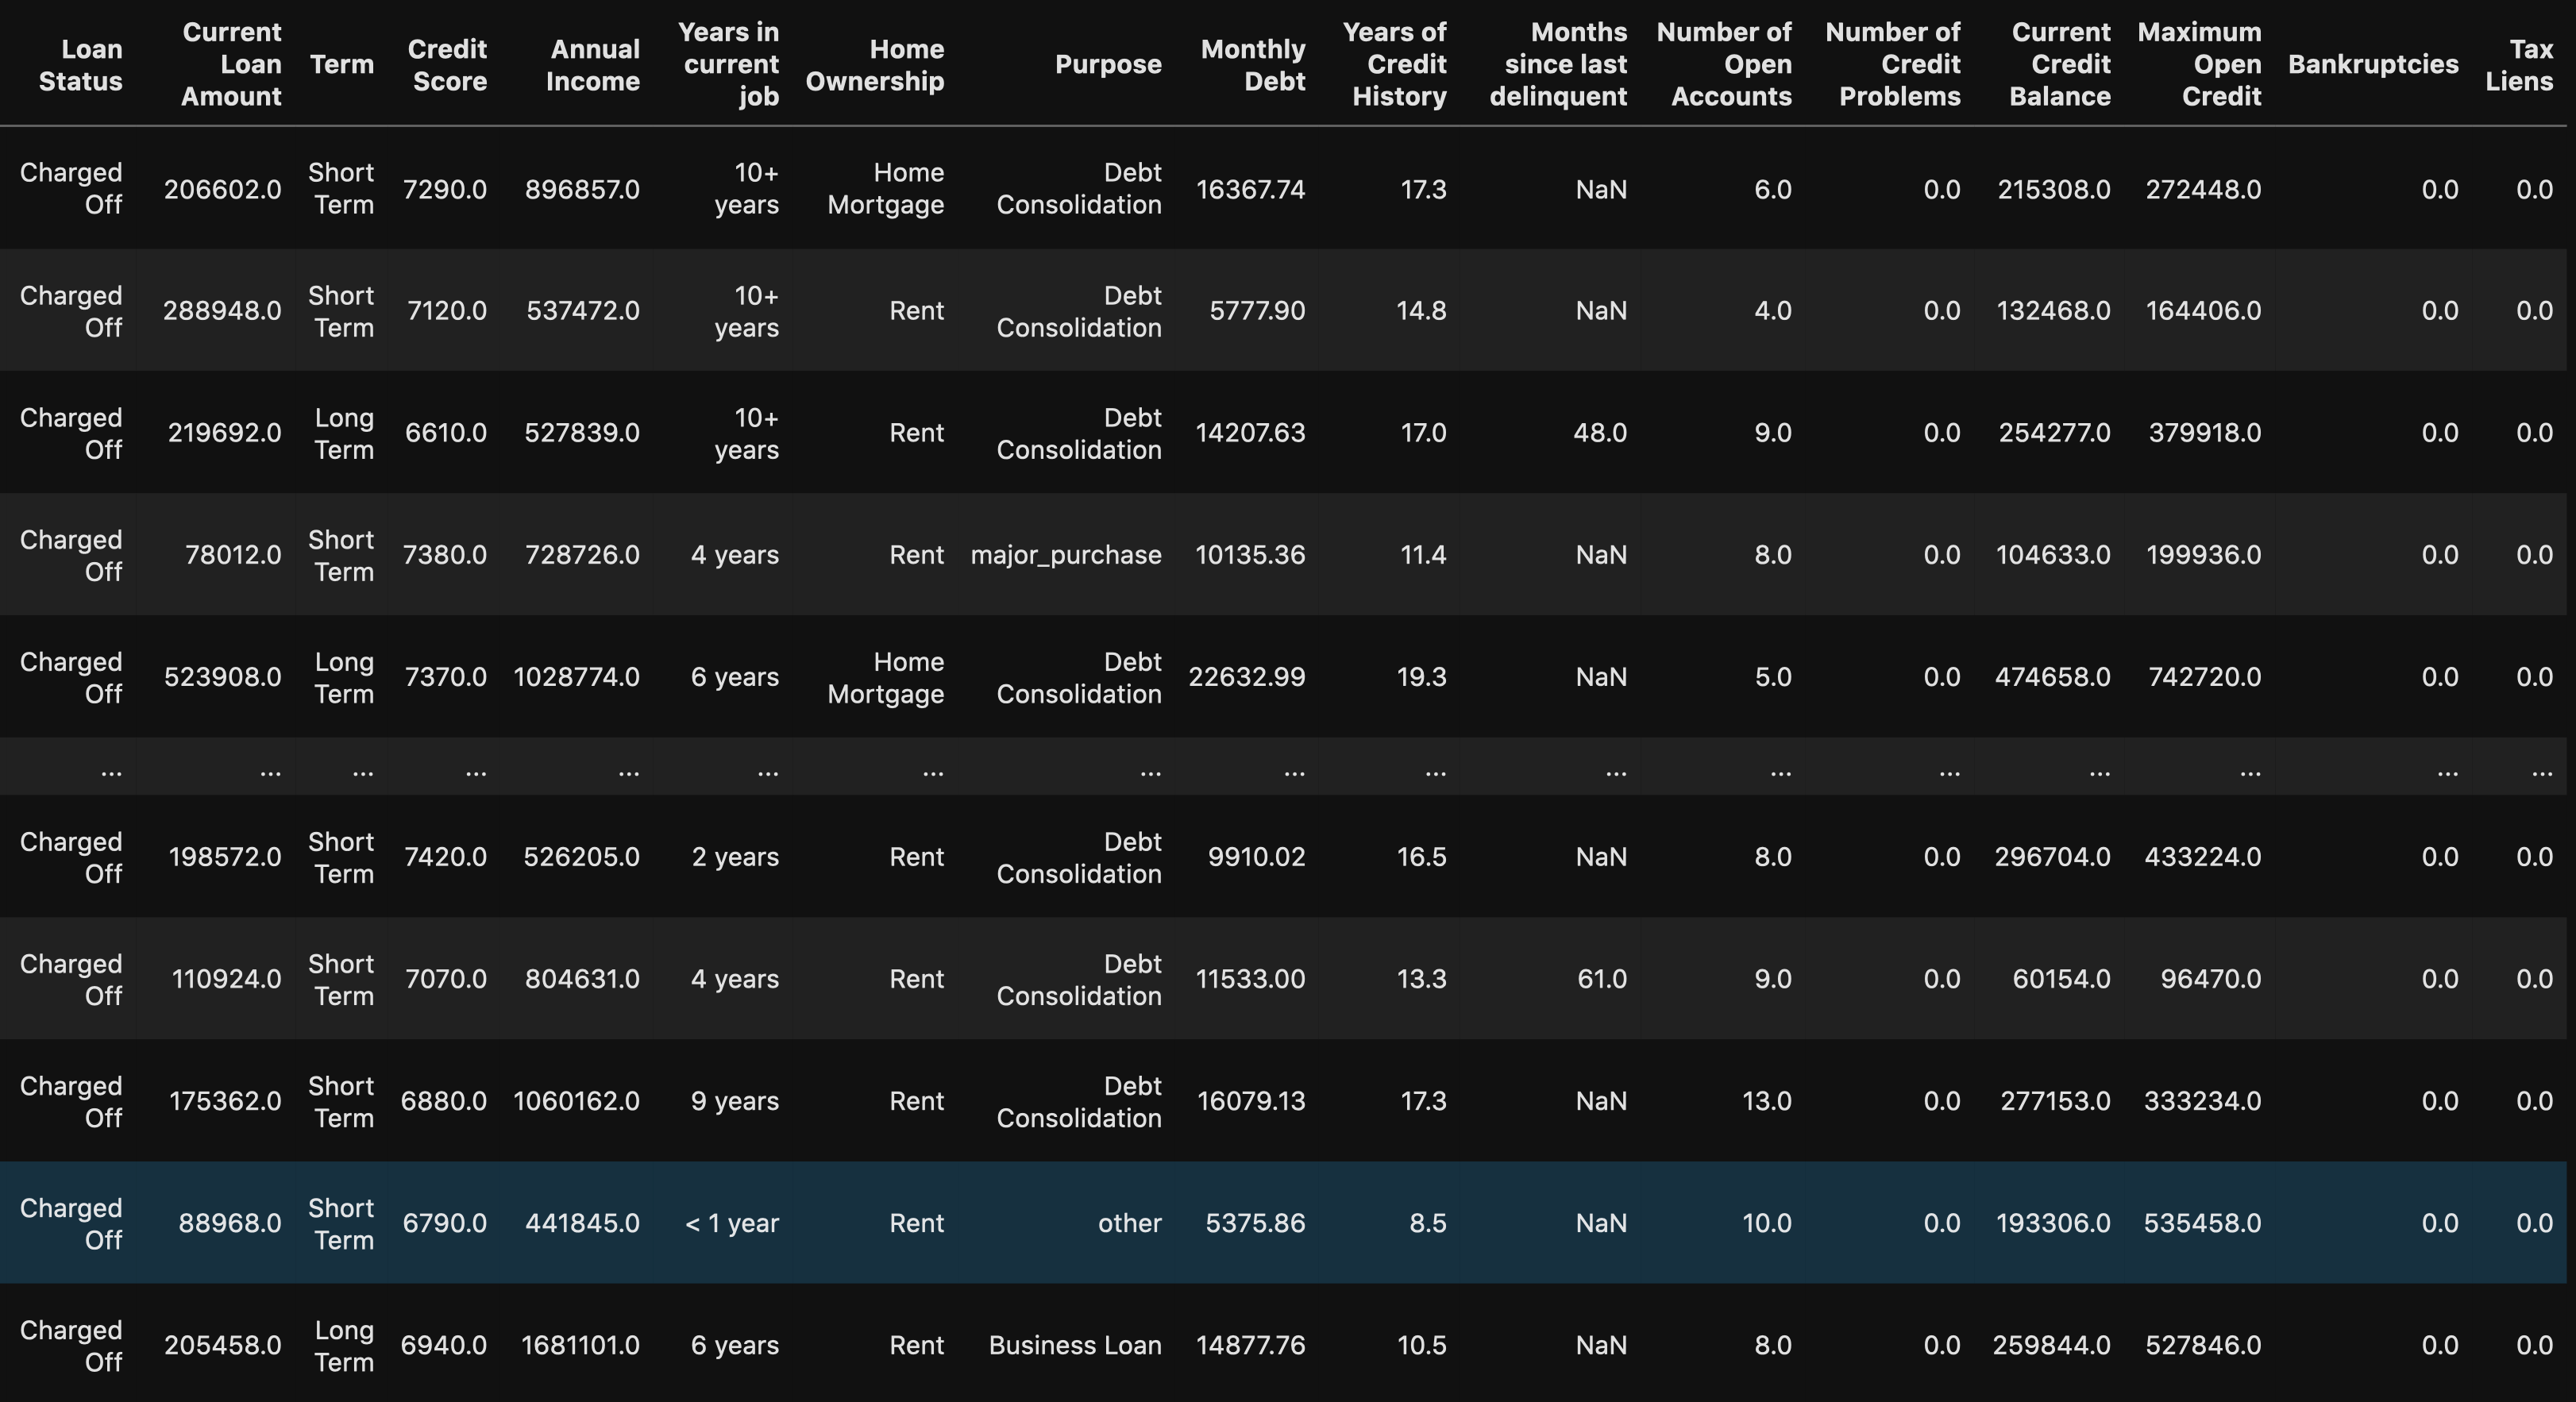
When using the loc method you are able to see all of the rows with a credit score greater than 850. We can see that this might be a human error because there are 0’s added on to the end of the values. This will be an easy fix once we get to processing the data.
使用loc方法时,您可以看到所有信用评分大于850的行。我们可以看到这可能是人为错误,因为在值的末尾添加了0。 一旦我们开始处理数据,这将是一个简单的修复。
Another way to detect outliers are to use box plots and scatter plots.
检测离群值的另一种方法是使用箱形图和散点图。
fig, ax = plt.subplots(4, 3)# Setting height and width of subplotsfig.set_figheight(15)fig.set_figwidth(30)# Adding spacing between boxesfig.tight_layout(h_pad=True, w_pad=True)sns.boxplot(bank_df["Number of Open Accounts"], ax=ax[0, 0])sns.boxplot(bank_df["Current Loan Amount"], ax=ax[0, 1])sns.boxplot(bank_df["Monthly Debt"], ax=ax[0, 2])sns.boxplot(bank_df["Years of Credit History"], ax=ax[1, 0])sns.boxplot(bank_df["Months since last delinquent"], ax=ax[1, 1])sns.boxplot(bank_df["Number of Credit Problems"], ax=ax[1, 2])sns.boxplot(bank_df["Current Credit Balance"], ax=ax[2, 0])sns.boxplot(bank_df["Maximum Open Credit"], ax=ax[2, 1])sns.boxplot(bank_df["Bankruptcies"], ax=ax[2, 2])sns.boxplot(bank_df["Tax Liens"], ax=ax[3, 0])plt.show()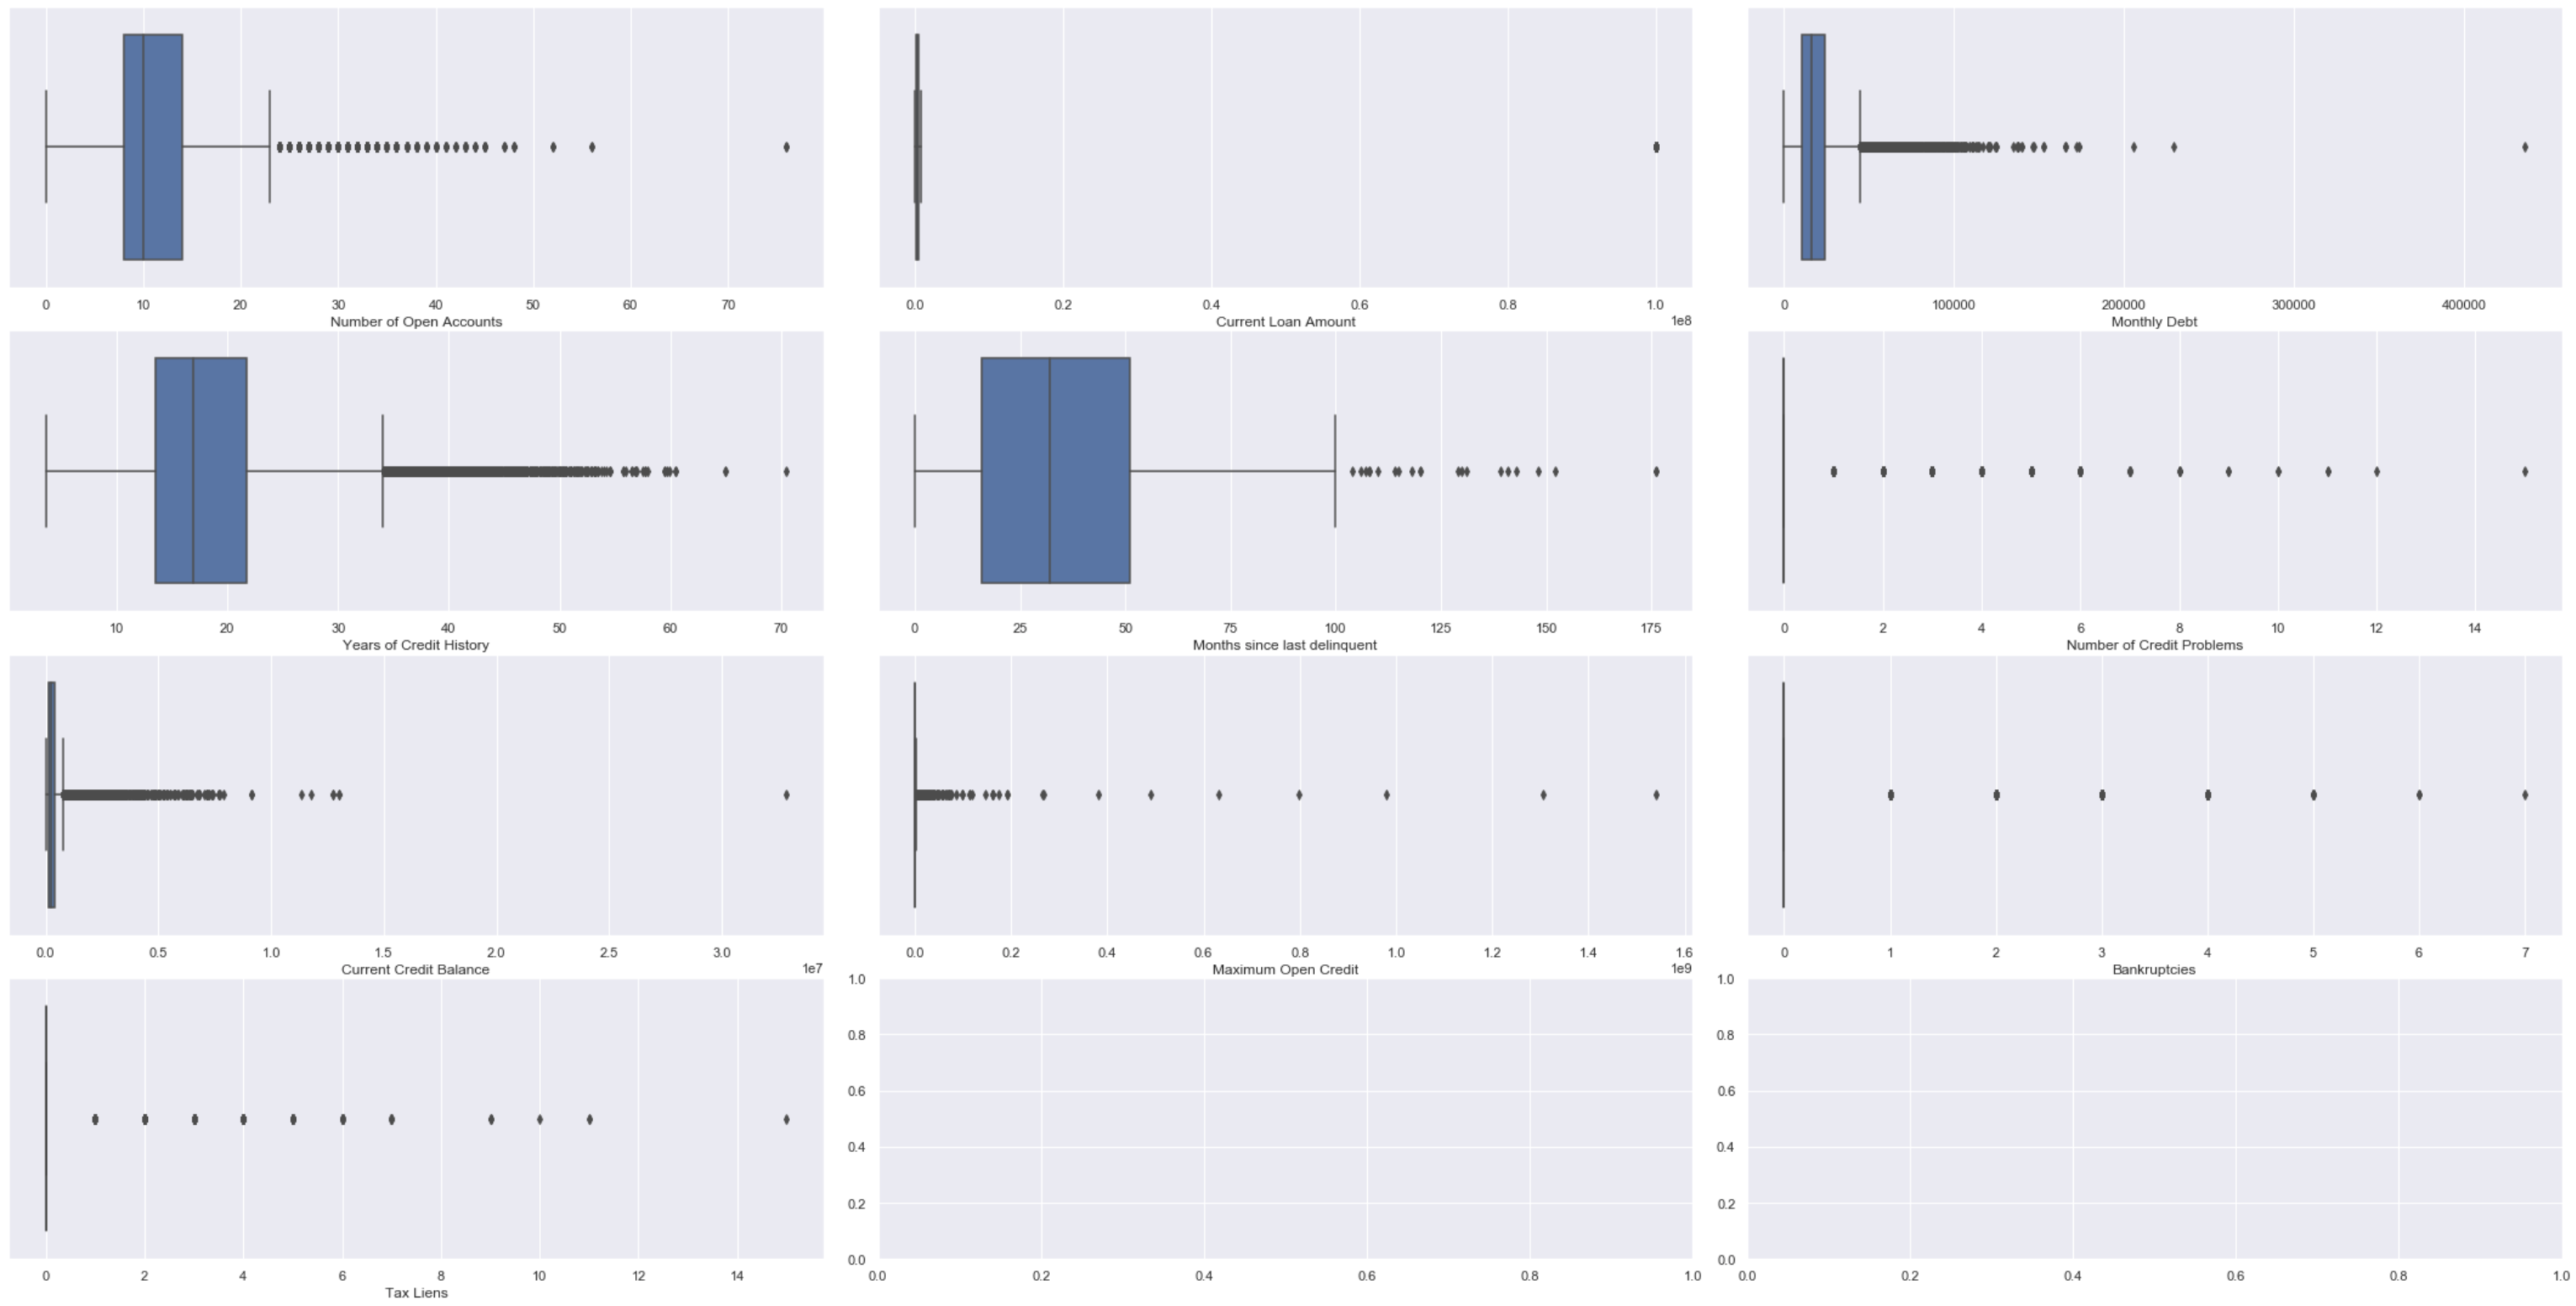
fig, ax = plt.subplots(4, 3)# Setting height and width of subplotsfig.set_figheight(15)fig.set_figwidth(30)# Adding spacing between boxesfig.tight_layout(h_pad=True, w_pad=True)sns.scatterplot(data=bank_df["Number of Open Accounts"], ax=ax[0, 0])sns.scatterplot(data=bank_df["Current Loan Amount"], ax=ax[0, 1])sns.scatterplot(data=bank_df["Monthly Debt"], ax=ax[0, 2])sns.scatterplot(data=bank_df["Years of Credit History"], ax=ax[1, 0])sns.scatterplot(data=bank_df["Months since last delinquent"], ax=ax[1, 1])sns.scatterplot(data=bank_df["Number of Credit Problems"], ax=ax[1, 2])sns.scatterplot(data=bank_df["Current Credit Balance"], ax=ax[2, 0])sns.scatterplot(data=bank_df["Maximum Open Credit"], ax=ax[2, 1])sns.scatterplot(data=bank_df["Bankruptcies"], ax=ax[2, 2])sns.scatterplot(data=bank_df["Tax Liens"], ax=ax[3, 0])plt.show()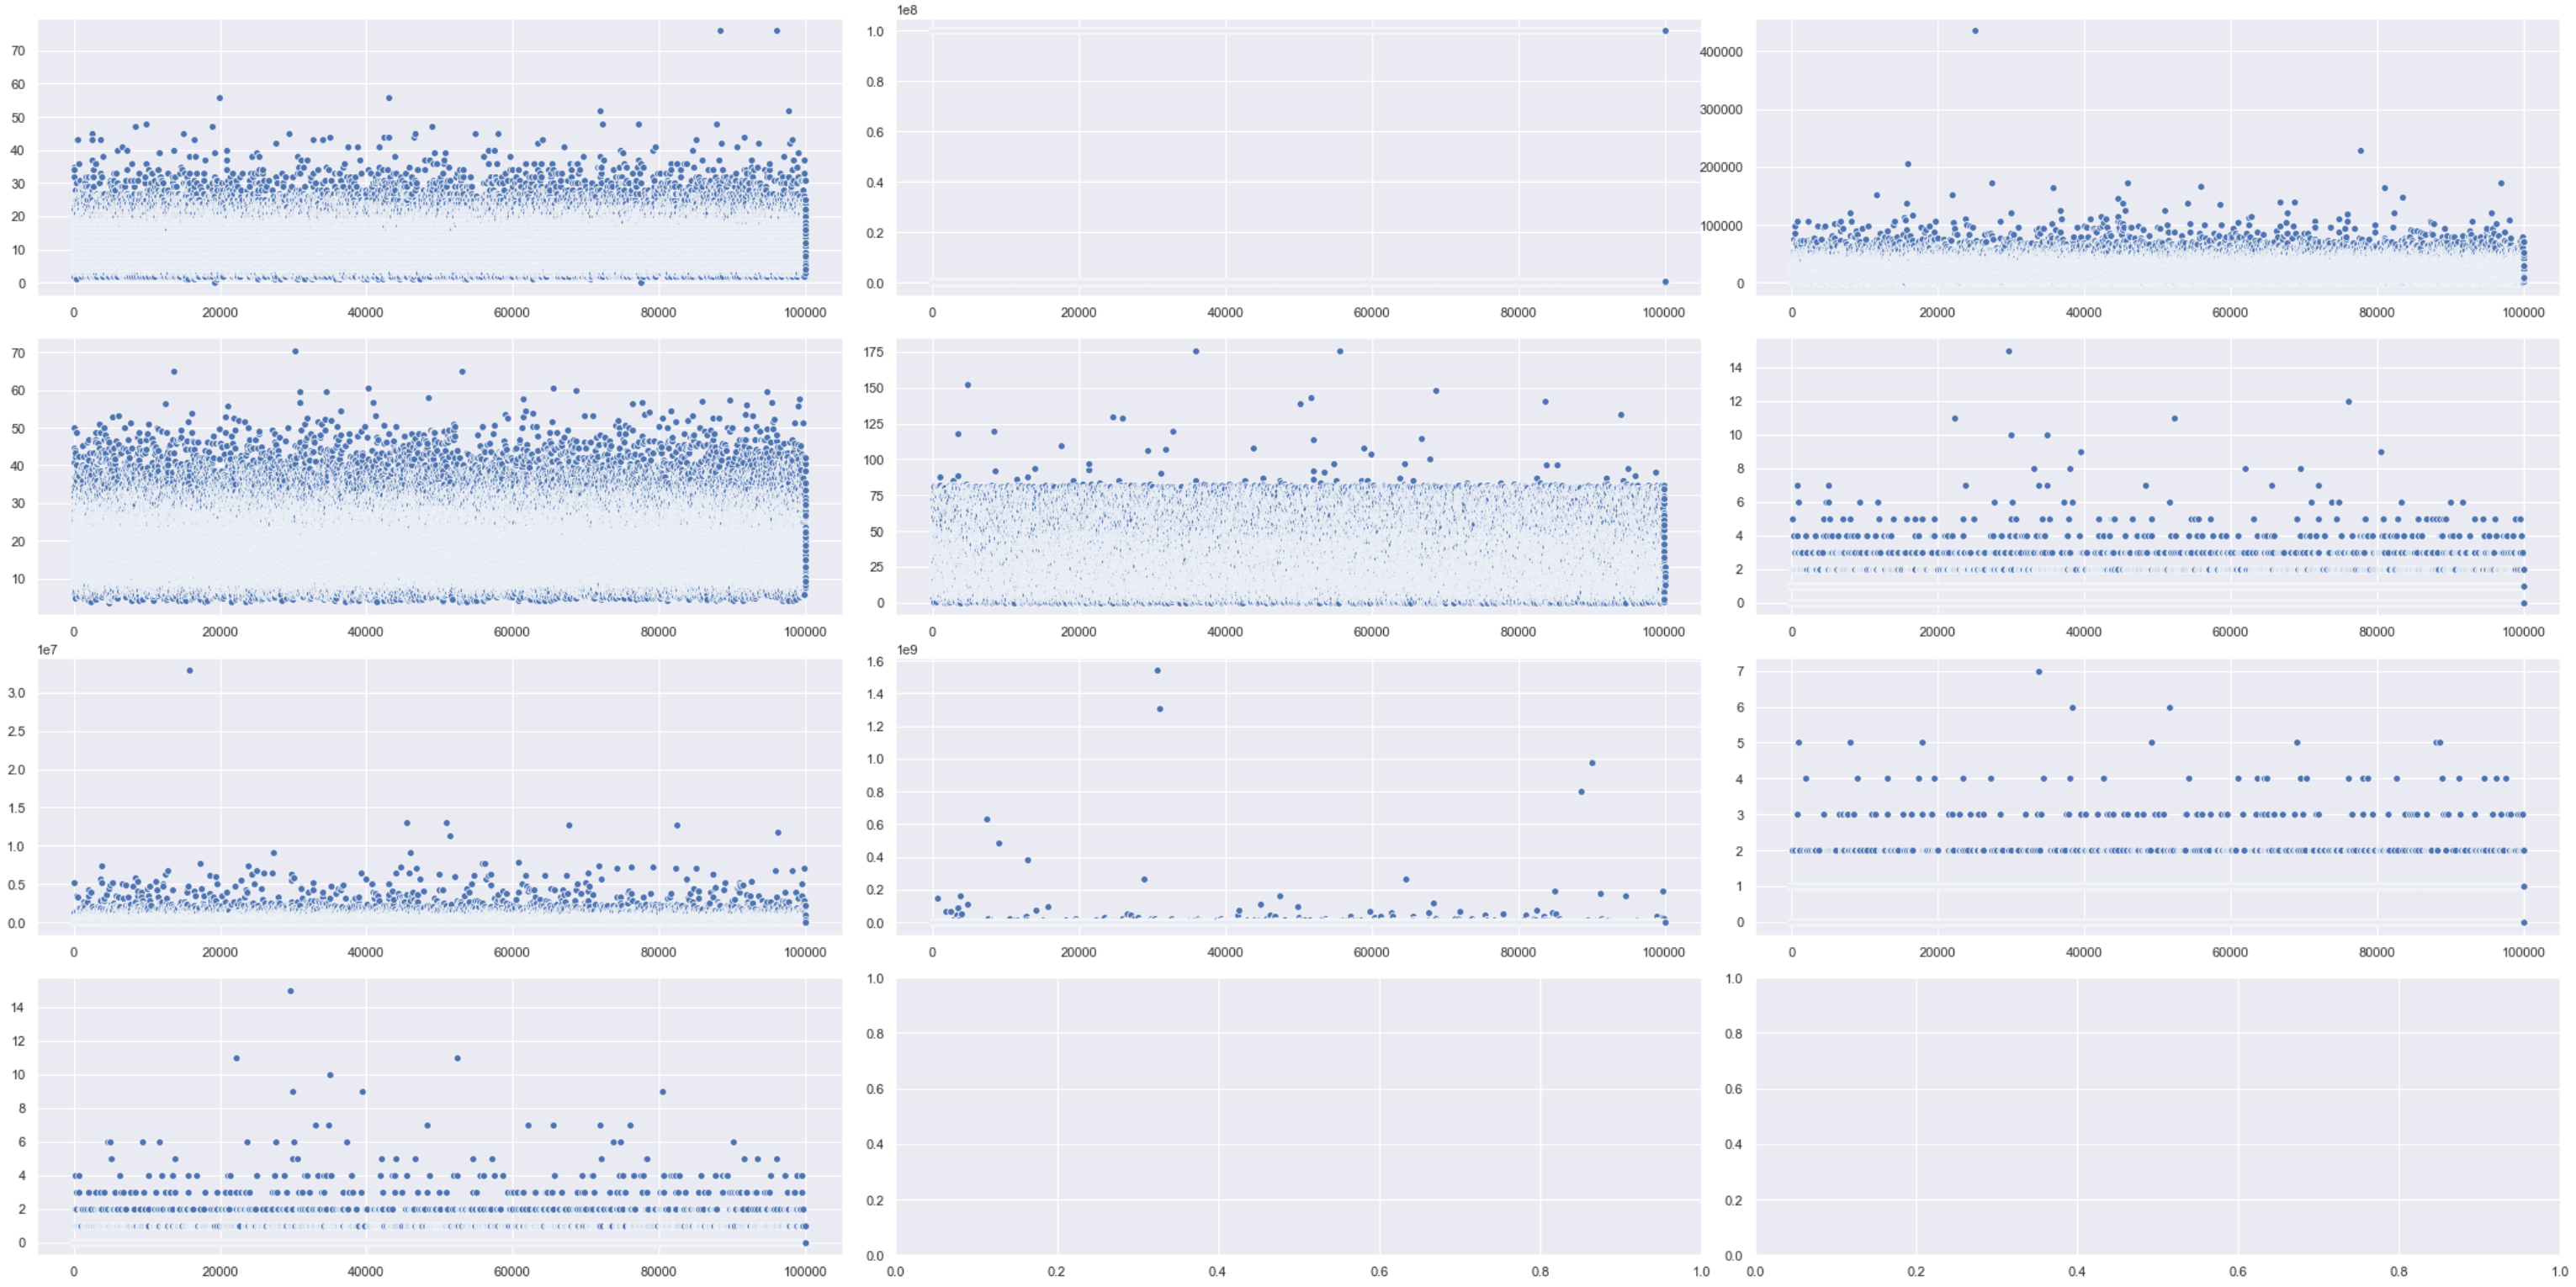
相关分析 (Correlation Analysis)
Correlation is when you want to detect how one variable reacts to another. What you don’t want is multicollinearity and to check for that you can use:
关联是当您要检测一个变量对另一个变量的React时。 您不想要的是多重共线性,并且可以使用以下方法进行检查:
# Looking at mulitcollinearitysns.heatmap(df.corr())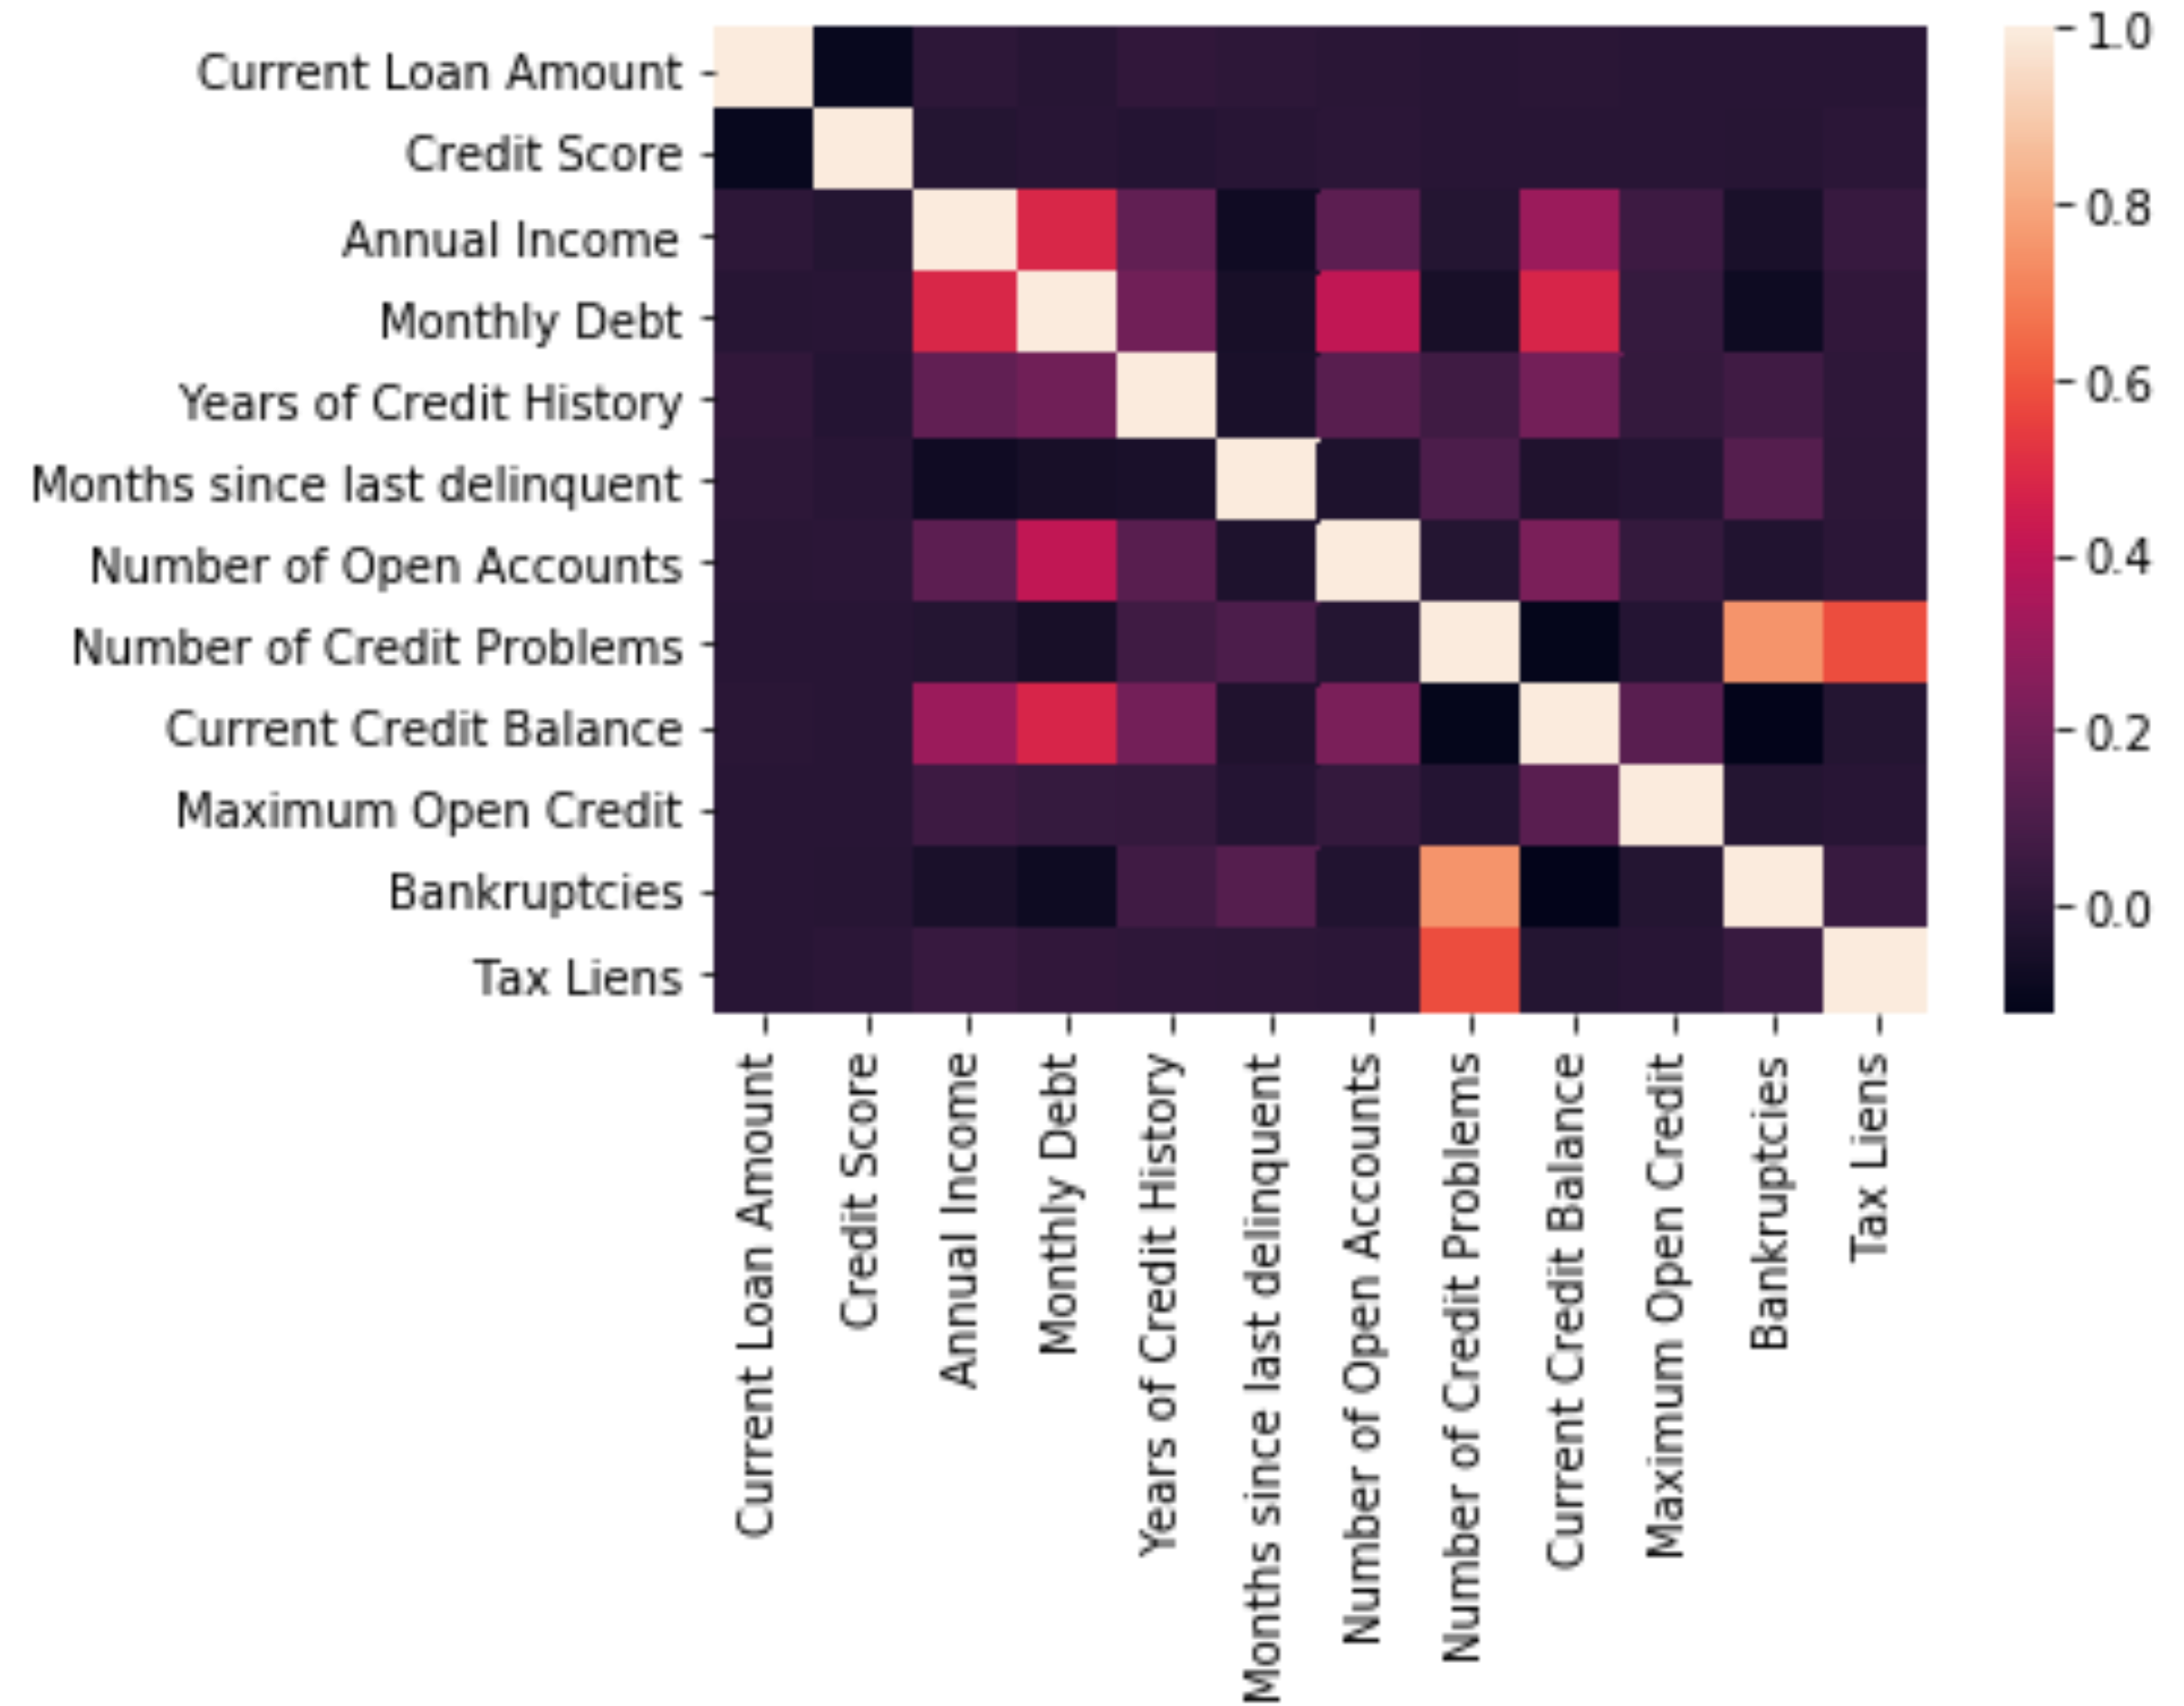
翻译自: https://medium.com/analytics-vidhya/bank-data-eda-step-by-step-67a61a7f1122
数据eda
http://www.taodudu.cc/news/show-997516.html
相关文章:
- Bigmart数据集销售预测
- dt决策树_决策树:构建DT的分步方法
- 已知两点坐标拾取怎么操作_已知的操作员学习-第3部分
- 特征工程之特征选择_特征工程与特征选择
- 熊猫tv新功能介绍_熊猫简单介绍
- matlab界area_Matlab的数据科学界
- hdf5文件和csv的区别_使用HDF5文件并创建CSV文件
- 机器学习常用模型:决策树_fairmodels:让我们与有偏见的机器学习模型作斗争
- 100米队伍,从队伍后到前_我们的队伍
- mongodb数据可视化_使用MongoDB实时可视化开放数据
- Python:在Pandas数据框中查找缺失值
- Tableau Desktop认证:为什么要关心以及如何通过
- js值的拷贝和值的引用_到达P值的底部:直观的解释
- struts实现分页_在TensorFlow中实现点Struts
- 钉钉设置jira机器人_这是当您机器学习JIRA票证时发生的事情
- 小程序点击地图气泡获取气泡_气泡上的气泡
- PopTheBubble —测量媒体偏差的产品创意
- 面向Tableau开发人员的Python简要介绍(第3部分)
- pymc3使用_使用PyMC3了解飞机事故趋势
- 吴恩达神经网络1-2-2_图神经网络进行药物发现-第2部分
- 数据图表可视化_数据可视化十大最有用的图表
- 接facebook广告_Facebook广告分析
- eda可视化_5用于探索性数据分析(EDA)的高级可视化
- css跑道_如何不超出跑道:计划种子的简单方法
- 熊猫数据集_为数据科学拆箱熊猫
- matplotlib可视化_使用Matplotlib改善可视化设计的5个魔术技巧
- 感知器 机器学习_机器学习感知器实现
- 快速排序简便记_建立和测试股票交易策略的快速简便方法
- 美剧迷失_迷失(机器)翻译
- 我如何预测10场英超联赛的确切结果
数据eda_银行数据EDA:逐步相关推荐
- python 银行数据_Kmeans 银行数据聚类分析
K-MEANS聚类分析银行数据分析记录 调用的包 import seaborn as sns import numpy as np import pandas as pd from matplotli ...
- 数字经济的核心是对大数据_大数据崛起为数字世界的核心润滑剂
数字经济的核心是对大数据 "Information is the oil of the 21st century, and analytics is the combustion engin ...
- 银行数据中台的数据价值,银行数据中台建设实践案例
在大数据.人工智能.区块链等新兴技术的驱动下,各家银行纷纷利用新技术制定数字转型改革战略,寻找差异化经营的可行模式. "中台概念"早期是由美军的作战体系演化而来的,技术上说的&q ...
- 数据治理展示血缘关系的工具_Nebula Graph 在微众银行数据治理业务的实践
本文为微众银行大数据平台:周可在 nMeetup 深圳场的演讲这里文字稿,演讲视频参见:B站 自我介绍下,我是微众银行大数据平台的工程师:周可,今天给大家分享一下 Nebula Graph 在微众银行 ...
- 大型银行数据中心用户安全管理
大型银行数据中心IT治理课题组 随着信息技术日新月异,银行业务高度信息化并稳步迈入大数据时代.数据中心作为银行信息化.大数据的核心基础,其IT系统庞杂,多则上千,涉及用户过万.面对如此规模的系统,如何 ...
- 上海银行数据中心迎来智能机器“巡检员”
近日,上海银行张江数据中心迎来一位特别的巡检员--智能巡检机器人,它在机房内进行常规巡检包括记录机房温湿度等环境参数等操作,成为一道移动的新景观. 智能巡检机器人的使用,有助于提高上海银行运维自动化和 ...
- 《大数据》2015年第2期“动态”——大数据发现银行贷款风险
大数据发现银行贷款风险 曾伟1,孔新川2,陈威1,周涛1 1.电子科技大学 2.杭州迈宁数据科技有限公司 doi:10.11959/j.issn.2096-0271.2015024 Uncoverin ...
- 我花600小时,调研30家银行,为你讲透银行数据架构,小白都能懂
如果一个系统,没有数据架构,那肯定是在吹牛,今天就来讲讲银行的数据架构.这是我花了600多小时,调研了30+银行,得出来的方法论. 狭义的数据仓库数据架构用来特指数据分布,广义的数据仓库数据架构还包括 ...
- 银行数据部门如何管理跟使用数据?来围观星球中老师的答案
关注 "番茄风控大数据",获取更多数据分析与风控大数据的实用干货 大家好,我是小番.昨天趁着陈Sir不在,我曝光了星球中不少干货.但仍有同学反馈,昨天截取的内容仍不够多. 为了再 ...
最新文章
- parquet java_Apache Parquet Java API的文档?
- windows程序消息机制(Winform界面更新有关)--转
- NeurIPS 2020 | 利用像素级别循环一致性解决领域自适应语义分割问题
- 光伏发电项目将全面摸底复核
- 一份对过去120年奥运数据的可视化分析报告
- RocketMQ集成SpringBoot
- 最简单24点算法,可任意实现n数n点,一看就明!
- 中国防卫科技学院计算机,2014高考专业介绍:科技防卫
- 三种迭代法解方程组(雅可比Jacobi、高斯-赛德尔Gaisi_saideer、逐次超松弛SOR)
- IP-guard功能详解—即时通讯监控
- 联想电脑重装系统总结
- 跳过数据准备,下秒数据让飞书维格表数据应用更高效
- 机器学习之神经网络图解,生动形象
- dns改成什么网速快_简单几步DNS设置,让你手机的WiFi速度提升几倍
- DiDi for Android协议分析
- 罗尔(Rolle)定理
- wince蓝屏_Windows7更新补丁蓝屏错误代码6B的暂时解决方法
- springboot学习(四十) springboot下rsocket的使用
- mysql 时间戳加减_mysql加减时间-函数-时间加减
- C语言large函数的作用,LARGE函数是什么
