matplotlib布局_Matplotlib多列,行跨度布局
matplotlib布局
For Visualization in Python, Matplotlib library has been the workhorse for quite some time now. It has held its own even after more nimble rivals with easier code interface and capabilities like seaborn, plotly, bokeh etc. have arrived on the scene. Though Matplotlib may lack the interactive capabilities of the new kids on the block, it does a more than adequate job of visualizing our data exploration tasks in Exploratory Data Analysis(EDA).
对于Python中的可视化而言,Matplotlib库已经成为相当长一段时间的主力军。 即使具有更灵活的代码界面的更灵活的竞争对手以及诸如seaborn,plot,bokeh等功能已经出现在现场,它也保持了自己的地位。 尽管Matplotlib可能缺少新手的互动功能,但它在可视化探索性数据分析(EDA)中可视化我们的数据探索任务所做的工作远远不够。
During EDA, one may come across situations where we want to display a group of related plots as part of a larger picture to drive home our insight. The subplot function of matplotlib does the job for us. However, in certain situations, we may want to combine several subplots and want to have different aspect ratios for each subplot. How can we achieve this layout, where, essentially some subplots span across several rows/columns of the overall figure?
在EDA期间,我们可能会遇到一些情况,在这些情况下,我们希望将一组相关的图显示为大图的一部分,以推动我们的洞察力。 matplotlib的subplot功能为我们完成了工作。 但是,在某些情况下,我们可能希望合并多个子图,并希望每个子图具有不同的纵横比。 我们如何才能实现这种布局,在此布局中,实际上有些子图跨越了整个图形的几行/几列?
Enter gridspec submodule of Matplotlib.
输入gridspec子模块。

We first need to create an instance of GridSpec which allows us to specify the total number of rows and columns as arguments in the overall figure along with a figure object.
首先,我们需要创建一个GridSpec实例,该实例允许我们指定行和列的总数作为整体图形中的参数以及figure对象。

We store the GridSpec instance in a variable called gs and specify that we want to have 4 rows and 4 columns in the overall figure.
我们将GridSpec实例存储在名为gs的变量中,并指定我们希望在整个图中有4行4列。
Now, we need to specify the details of how each subplot will span the rows and columns in the overall figure. It is useful to make a rough sketch on paper as to how you want the subplots to be laid out, so that they don't overlap. Once done, we convey this information through the GridSpec object we created. The row/column span info is passed in the same index notation we use for subsetting arrays/dataframes with rows and column index numbers starting from zero and using the : to specify range. The GridSpec object with the index is passed to the add_subplot function of the figure object.
现在,我们需要指定每个子图将如何跨越整个图中的行和列的详细信息。 在纸上粗略地绘制草图,以了解子图的布局方式是有用的,这样子图就不会重叠。 完成后,我们将通过创建的GridSpec对象传达此信息。 行/列跨度信息以相同的索引符号传递,该索引符号用于设置数组和数据框,其中行和列的索引号从零开始,并使用:指定范围。 所述GridSpec与索引对象被传递到add_subplot所述的功能figure的对象。

We add an overall title for the figure and remove the ticks to visualize the layout better as the objective here is to demonstrate how we can achieve subplots spanning multiple rows /columns. When you implement this, obviously you will want to add your axis ticks, labels etc. from your dataframe and tweak the spacing and figure size to accommodate these plot elements.
我们为图形添加一个整体标题,并删除刻度线以更好地显示布局,因为此处的目的是演示如何实现跨越多行/列的子图。 当您实现此功能时,显然您会希望从数据框中添加轴刻度,标签等,并调整间距和图形大小以容纳这些绘图元素。
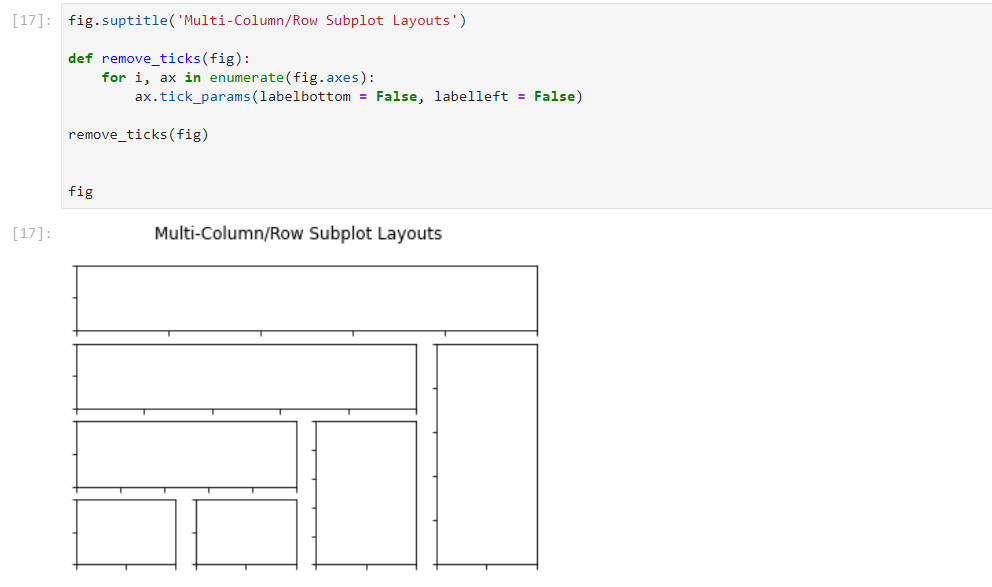
Boom! This may come in handy in multi-variable time series plots where we may want to show the time series plot stretching across the columns in the top row and other uni-variate, multi-variate visualization in the other subplots below. You can customize how your jigsaw looks like by specifying your row/columns in the overall figure and spans of your individual subplots.
繁荣! 这在多变量时间序列图中可能会派上用场,在这里我们可能想要显示跨越顶部行中各列的时间序列图,并在下面的其他子图中显示其他单变量,多变量可视化。 您可以通过在整体图形中指定行/列以及各个子图的跨度来自定义拼图的外观。
In R, achieving the above is ridiculously easy with the patchwork package in a single line of code with nothing more than + and / operators and ( ) to even have nested subplots if you want to go bonkers. Click on the below link to see how you can get this done in R.
在R语言中,使用单行代码中的patchwork程序包就可以轻松地实现上述目标,而只需要+和/运算符和( )甚至嵌套嵌套的子图就可以了。 单击下面的链接,查看如何在R中完成此操作。
Thanks for reading. If you liked this article, you may also like the one below on how to do EDA with minimal lines of code with maximum output.
谢谢阅读。 如果您喜欢这篇文章,那么您可能也喜欢以下关于如何用最少的代码行和最大的输出量进行EDA的文章。
Would love to hear your feedback and comments. Thanks!
很想听听您的反馈和意见。 谢谢!
翻译自: https://towardsdatascience.com/matplotlib-multi-column-row-spanning-layouts-f026eb7c3c27
matplotlib布局
http://www.taodudu.cc/news/show-997368.html
相关文章:
- 回归分析_回归
- 线性回归算法数学原理_线性回归算法-非数学家的高级数学
- Streamlit —使用数据应用程序更好地测试模型
- lasso回归和岭回归_如何计划新产品和服务机会的回归
- 贝叶斯 定理_贝叶斯定理实际上是一个直观的分数
- 文本数据可视化_如何使用TextHero快速预处理和可视化文本数据
- 真实感人故事_您的数据可以告诉您真实故事吗?
- k均值算法 二分k均值算法_使用K均值对加勒比珊瑚礁进行分类
- 衡量试卷难度信度_我们可以通过数字来衡量语言难度吗?
- 视图可视化 后台_如何在单视图中可视化复杂的多层主题
- python边玩边学_边听边学数据科学
- 边缘计算 ai_在边缘探索AI!
- 如何建立搜索引擎_如何建立搜寻引擎
- github代码_GitHub启动代码空间
- 腾讯哈勃_用Python的黑客统计资料重新审视哈勃定律
- 如何使用Picterra的地理空间平台分析卫星图像
- hopper_如何利用卫星收集的遥感数据轻松对蚱hopper中的站点进行建模
- 华为开源构建工具_为什么我构建了用于大数据测试和质量控制的开源工具
- 数据科学项目_完整的数据科学组合项目
- uni-app清理缓存数据_数据清理-从哪里开始?
- bigquery_如何在BigQuery中进行文本相似性搜索和文档聚类
- vlookup match_INDEX-MATCH — VLOOKUP功能的升级
- flask redis_在Flask应用程序中将Redis队列用于异步任务
- 前馈神经网络中的前馈_前馈神经网络在基于趋势的交易中的有效性(1)
- hadoop将消亡_数据科学家:适应还是消亡!
- 数据科学领域有哪些技术_领域知识在数据科学中到底有多重要?
- 初创公司怎么做销售数据分析_为什么您的初创企业需要数据科学来解决这一危机...
- r软件时间序列分析论文_高度比较的时间序列分析-一篇论文评论
- selenium抓取_使用Selenium的网络抓取电子商务网站
- 裁判打分_内在的裁判偏见
matplotlib布局_Matplotlib多列,行跨度布局相关推荐
- css布局:多列等高布局
多列等高布局是在一个容器里面,并排的多列,如果内容的高度无法在一开始确定(例如内容是动态的),又需要让各列自然地撑开(不出现每列里面的滚动条),这时候需要用css或者js的方法把各列高度设置为最高列的 ...
- 布局:多列等高布局方法
多列等高布局在实际应用中比较常见,作为面试的一个点也常遇到.做个总结. 首先想到的第一种就是 flex 和 min-height , 后朋友提醒,去掉 min-height 试试.由于align-it ...
- html设置多列布局间隙,css设置多列等高布局的方法示例
1.真实等高布局 flex技术点:弹性盒子布局flex,默认值就是自带等高布局的特点. 定义flex布局的时候,有一些默认值. flex-direction属性定义主轴的方向.默认值为row,一般是水 ...
- CSS布局代码:两列布局实例
CSS两列布局,右侧固定,左侧自适应宽度 <div style="width:90%; margin:0 auto;"> <div style="wid ...
- 一个超酷的横向多列响应式布局效果
日期:2013-1-26 来源:GBin1.com 在线演示 还记得上周介绍的一个超酷的星际争霸2视差滚动效果吧,如果你希望生成一个类似ipad效果的漂亮横向多列响应式滚动效果的话,那么你可以考虑使 ...
- 利用CSS的三列等高布局
以前自己都是用JS去处理,原来用CSS也是很方便的,可以少写代码^_^ <html xmlns="http://www.w3.org/1999/xhtml"><h ...
- css 列 布局,CSS二列三列布局
本篇文章主要介绍本人最近在CSS学习中总结出的常用的二列&三列布局的几种方法 二列&三列布局: image.png 二列布局的特征通常是侧栏固定宽度,主栏自适应宽度 三列布局的特征通常 ...
- 两列布局、三列适应布局、两列等高适应布局。
一. 两列布局:左侧定宽.右侧自适应. 四种方法 :flex .position.float和负外边距.外边距 1. 使用flex. <!DOCTYPE html> <html> ...
- html 三列布局(两列自适应,一列固定宽度)
不做过多解释:主要是记录一个完整的布局样式,实现页面大致三列其中左右两列是自适应宽度,中间固定宽度效果. 不多少代码奉上: CSS样式代码: /******************** *公共标签样式 ...
最新文章
- spring mvc相关问题
- lua的面向对象编程,封装,继承,多态的实现
- 如何:在Spring中使用@Conditional和Condition注册组件
- j@2ff4f00f_J4F的完整形式是什么?
- POJ1958 Strange Towers of Hanoi [递推]
- Java基础知识——异常处理
- mongodb java 地理位置_MongoDB的地理位置索引
- 【数据结构笔记11】二叉搜索树,动态查找,删除操作
- PCDJ DEX 3 for mac(DJ混音打碟工具)
- 【算法笔记HDU4825】Xor Sum(01字典树模版)
- RHCE红帽考试认证考试模拟题(与真题区别是一些名称不同) 答案见下个博文
- windows server 2019 安装CA-证书服务器
- mac Error: EACCES: permission denied, mkdir './cache'
- 【大学生辩论赛】如何练习自己的辩论口才
- 【python】OpenCV—Video to Imag / Image to Video
- SolidWorks工装 焊接 夹具 治具 检具 3D图档-350套(9.2G)
- java运行时跟编译时的区别,欢迎大家指正
- string拼接时去掉最后一个逗号
- OpenStack 性能测试工具Rally使用
- 2022 前端常用的开发工具、组件库等等~持续整理,待你分享~