使用Prometheus+Alertmanager告警JVM异常情况
本文介绍如何使用Prometheus+Alertmanager来对JVM的某些情况作出告警。
本文所提到的脚本可以在这里下载。
摘要
用到的工具:
- Docker,本文大量使用了Docker来启动各个应用。
- Prometheus,负责抓取/存储指标信息,并提供查询功能,本文重点使用它的告警功能。
- Grafana,负责数据可视化(本文重点不在于此,只是为了让读者能够直观地看到异常指标)。
- Alertmanager,负责将告警通知给相关人员。
- JMX exporter,提供JMX中和JVM相关的metrics。
- Tomcat,用来模拟一个Java应用。
先讲一下大致步骤:
- 利用JMX exporter,在Java进程内启动一个小型的Http server
- 配置Prometheus抓取那个Http server提供的metrics。
- 配置Prometheus的告警触发规则
- heap使用超过最大上限的50%、80%、90%
- instance down机时间超过30秒、1分钟、5分钟
- old gc时间在最近5分钟里超过50%、80%
- 配置Grafana连接Prometheus,配置Dashboard。
- 配置Alertmanager的告警通知规则
告警的大致过程如下:
- Prometheus根据告警触发规则查看是否触发告警,如果是,就将告警信息发送给Alertmanager。
- Alertmanager收到告警信息后,决定是否发送通知,如果是,则决定发送给谁。
第一步:启动几个Java应用
1) 新建一个目录,名字叫做prom-jvm-demo。
2) 下载JMX exporter到这个目录。
3) 新建一个文件simple-config.yml内容如下:
---
blacklistObjectNames: ["*:*"]
4) 运行以下命令启动3个Tomcat,记得把<path-to-prom-jvm-demo>替换成正确的路径(这里故意把-Xmx和-Xms设置的很小,以触发告警条件):
docker run -d \--name tomcat-1 \-v <path-to-prom-jvm-demo>:/jmx-exporter \-e CATALINA_OPTS="-Xms32m -Xmx32m -javaagent:/jmx-exporter/jmx_prometheus_javaagent-0.3.1.jar=6060:/jmx-exporter/simple-config.yml" \-p 6060:6060 \-p 8080:8080 \tomcat:8.5-alpinedocker run -d \--name tomcat-2 \-v <path-to-prom-jvm-demo>:/jmx-exporter \-e CATALINA_OPTS="-Xms32m -Xmx32m -javaagent:/jmx-exporter/jmx_prometheus_javaagent-0.3.1.jar=6060:/jmx-exporter/simple-config.yml" \-p 6061:6060 \-p 8081:8080 \tomcat:8.5-alpinedocker run -d \--name tomcat-3 \-v <path-to-prom-jvm-demo>:/jmx-exporter \-e CATALINA_OPTS="-Xms32m -Xmx32m -javaagent:/jmx-exporter/jmx_prometheus_javaagent-0.3.1.jar=6060:/jmx-exporter/simple-config.yml" \-p 6062:6060 \-p 8082:8080 \tomcat:8.5-alpine5) 访问http://localhost:8080|8081|8082看看Tomcat是否启动成功。
6) 访问对应的http://localhost:6060|6061|6062看看JMX exporter提供的metrics。
备注:这里提供的simple-config.yml仅仅提供了JVM的信息,更复杂的配置请参考JMX exporter文档。
第二步:启动Prometheus
1) 在之前新建目录prom-jvm-demo,新建一个文件prom-jmx.yml,内容如下:
crape_configs:- job_name: 'java'static_configs:- targets:- '<host-ip>:6060'- '<host-ip>:6061'- '<host-ip>:6062'# alertmanager的地址
alerting:alertmanagers:- static_configs:- targets:- '<host-ip>:9093'# 读取告警触发条件规则
rule_files:- '/prometheus-config/prom-alert-rules.yml'
2) 新建文件prom-alert-rules.yml,该文件是告警触发规则:
# severity按严重程度由高到低:red、orange、yello、blue
groups:- name: jvm-alertingrules:# down了超过30秒- alert: instance-downexpr: up == 0for: 30slabels:severity: yellowannotations:summary: "Instance {{ $labels.instance }} down"description: "{{ $labels.instance }} of job {{ $labels.job }} has been down for more than 30 seconds."# down了超过1分钟- alert: instance-downexpr: up == 0for: 1mlabels:severity: orangeannotations:summary: "Instance {{ $labels.instance }} down"description: "{{ $labels.instance }} of job {{ $labels.job }} has been down for more than 1 minutes."# down了超过5分钟- alert: instance-downexpr: up == 0for: 5mlabels:severity: blueannotations:summary: "Instance {{ $labels.instance }} down"description: "{{ $labels.instance }} of job {{ $labels.job }} has been down for more than 5 minutes."# 堆空间使用超过50%- alert: heap-usage-too-muchexpr: jvm_memory_bytes_used{job="java", area="heap"} / jvm_memory_bytes_max * 100 > 50for: 1mlabels:severity: yellowannotations:summary: "JVM Instance {{ $labels.instance }} memory usage > 50%"description: "{{ $labels.instance }} of job {{ $labels.job }} has been in status [heap usage > 50%] for more than 1 minutes. current usage ({{ $value }}%)"# 堆空间使用超过80%- alert: heap-usage-too-muchexpr: jvm_memory_bytes_used{job="java", area="heap"} / jvm_memory_bytes_max * 100 > 80for: 1mlabels:severity: orangeannotations:summary: "JVM Instance {{ $labels.instance }} memory usage > 80%"description: "{{ $labels.instance }} of job {{ $labels.job }} has been in status [heap usage > 80%] for more than 1 minutes. current usage ({{ $value }}%)"# 堆空间使用超过90%- alert: heap-usage-too-muchexpr: jvm_memory_bytes_used{job="java", area="heap"} / jvm_memory_bytes_max * 100 > 90for: 1mlabels:severity: redannotations:summary: "JVM Instance {{ $labels.instance }} memory usage > 90%"description: "{{ $labels.instance }} of job {{ $labels.job }} has been in status [heap usage > 90%] for more than 1 minutes. current usage ({{ $value }}%)"# 在5分钟里,Old GC花费时间超过30%- alert: old-gc-time-too-muchexpr: increase(jvm_gc_collection_seconds_sum{gc="PS MarkSweep"}[5m]) > 5 * 60 * 0.3for: 5mlabels:severity: yellowannotations:summary: "JVM Instance {{ $labels.instance }} Old GC time > 30% running time"description: "{{ $labels.instance }} of job {{ $labels.job }} has been in status [Old GC time > 30% running time] for more than 5 minutes. current seconds ({{ $value }}%)"# 在5分钟里,Old GC花费时间超过50%        - alert: old-gc-time-too-muchexpr: increase(jvm_gc_collection_seconds_sum{gc="PS MarkSweep"}[5m]) > 5 * 60 * 0.5for: 5mlabels:severity: orangeannotations:summary: "JVM Instance {{ $labels.instance }} Old GC time > 50% running time"description: "{{ $labels.instance }} of job {{ $labels.job }} has been in status [Old GC time > 50% running time] for more than 5 minutes. current seconds ({{ $value }}%)"# 在5分钟里,Old GC花费时间超过80%- alert: old-gc-time-too-muchexpr: increase(jvm_gc_collection_seconds_sum{gc="PS MarkSweep"}[5m]) > 5 * 60 * 0.8for: 5mlabels:severity: redannotations:summary: "JVM Instance {{ $labels.instance }} Old GC time > 80% running time"description: "{{ $labels.instance }} of job {{ $labels.job }} has been in status [Old GC time > 80% running time] for more than 5 minutes. current seconds ({{ $value }}%)"
3) 启动Prometheus:
docker run -d \--name=prometheus \-p 9090:9090 \-v <path-to-prom-jvm-demo>:/prometheus-config \prom/prometheus --config.file=/prometheus-config/prom-jmx.yml4) 访问http://localhost:9090/alerts应该能看到之前配置的告警规则:
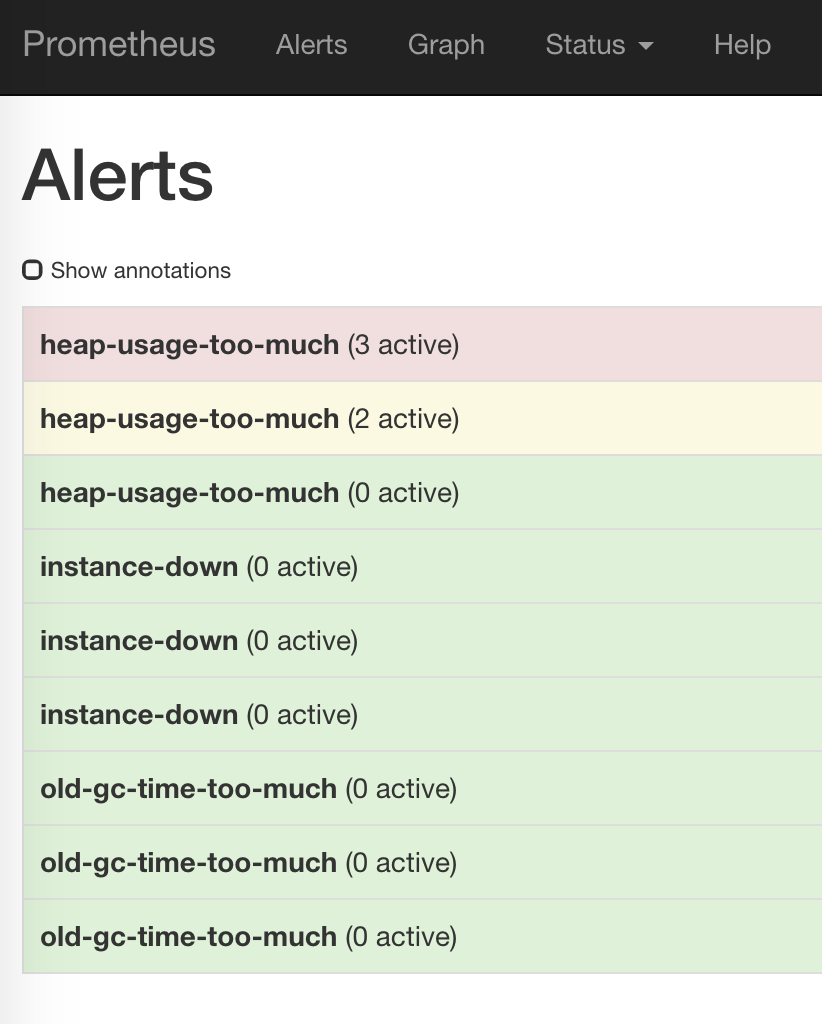
如果没有看到三个instance,那么等一会儿再试。
第三步:配置Grafana
参考使用Prometheus+Grafana监控JVM
第四步:启动Alertmanager
1) 新建一个文件alertmanager-config.yml:
global:smtp_smarthost: '<smtp.host:ip>'smtp_from: '<from>'smtp_auth_username: '<username>'smtp_auth_password: '<password>'# The directory from which notification templates are read.
templates:
- '/alertmanager-config/*.tmpl'# The root route on which each incoming alert enters.
route:# The labels by which incoming alerts are grouped together. For example,# multiple alerts coming in for cluster=A and alertname=LatencyHigh would# be batched into a single group.group_by: ['alertname', 'instance']# When a new group of alerts is created by an incoming alert, wait at# least 'group_wait' to send the initial notification.# This way ensures that you get multiple alerts for the same group that start# firing shortly after another are batched together on the first # notification.group_wait: 30s# When the first notification was sent, wait 'group_interval' to send a batch# of new alerts that started firing for that group.group_interval: 5m# If an alert has successfully been sent, wait 'repeat_interval' to# resend them.repeat_interval: 3h # A default receiverreceiver: "user-a"# Inhibition rules allow to mute a set of alerts given that another alert is
# firing.
# We use this to mute any warning-level notifications if the same alert is
# already critical.
inhibit_rules:
- source_match:severity: 'red'target_match_re:severity: ^(blue|yellow|orange)$# Apply inhibition if the alertname and instance is the same.equal: ['alertname', 'instance']
- source_match:severity: 'orange'target_match_re:severity: ^(blue|yellow)$# Apply inhibition if the alertname and instance is the same.equal: ['alertname', 'instance']
- source_match:severity: 'yellow'target_match_re:severity: ^(blue)$# Apply inhibition if the alertname and instance is the same.equal: ['alertname', 'instance']receivers:
- name: 'user-a'email_configs:- to: '<user-a@domain.com>'修改里面关于smtp_*的部分和最下面user-a的邮箱地址。
备注:因为国内邮箱几乎都不支持TLS,而Alertmanager目前又不支持SSL,因此请使用Gmail或其他支持TLS的邮箱来发送告警邮件,见这个issue
2) 新建文件alert-template.tmpl,这个是邮件内容模板:
{{ define "email.default.html" }}
<h2>Summary</h2><p>{{ .CommonAnnotations.summary }}</p><h2>Description</h2><p>{{ .CommonAnnotations.description }}</p>
{{ end}}
3) 运行下列命令启动:
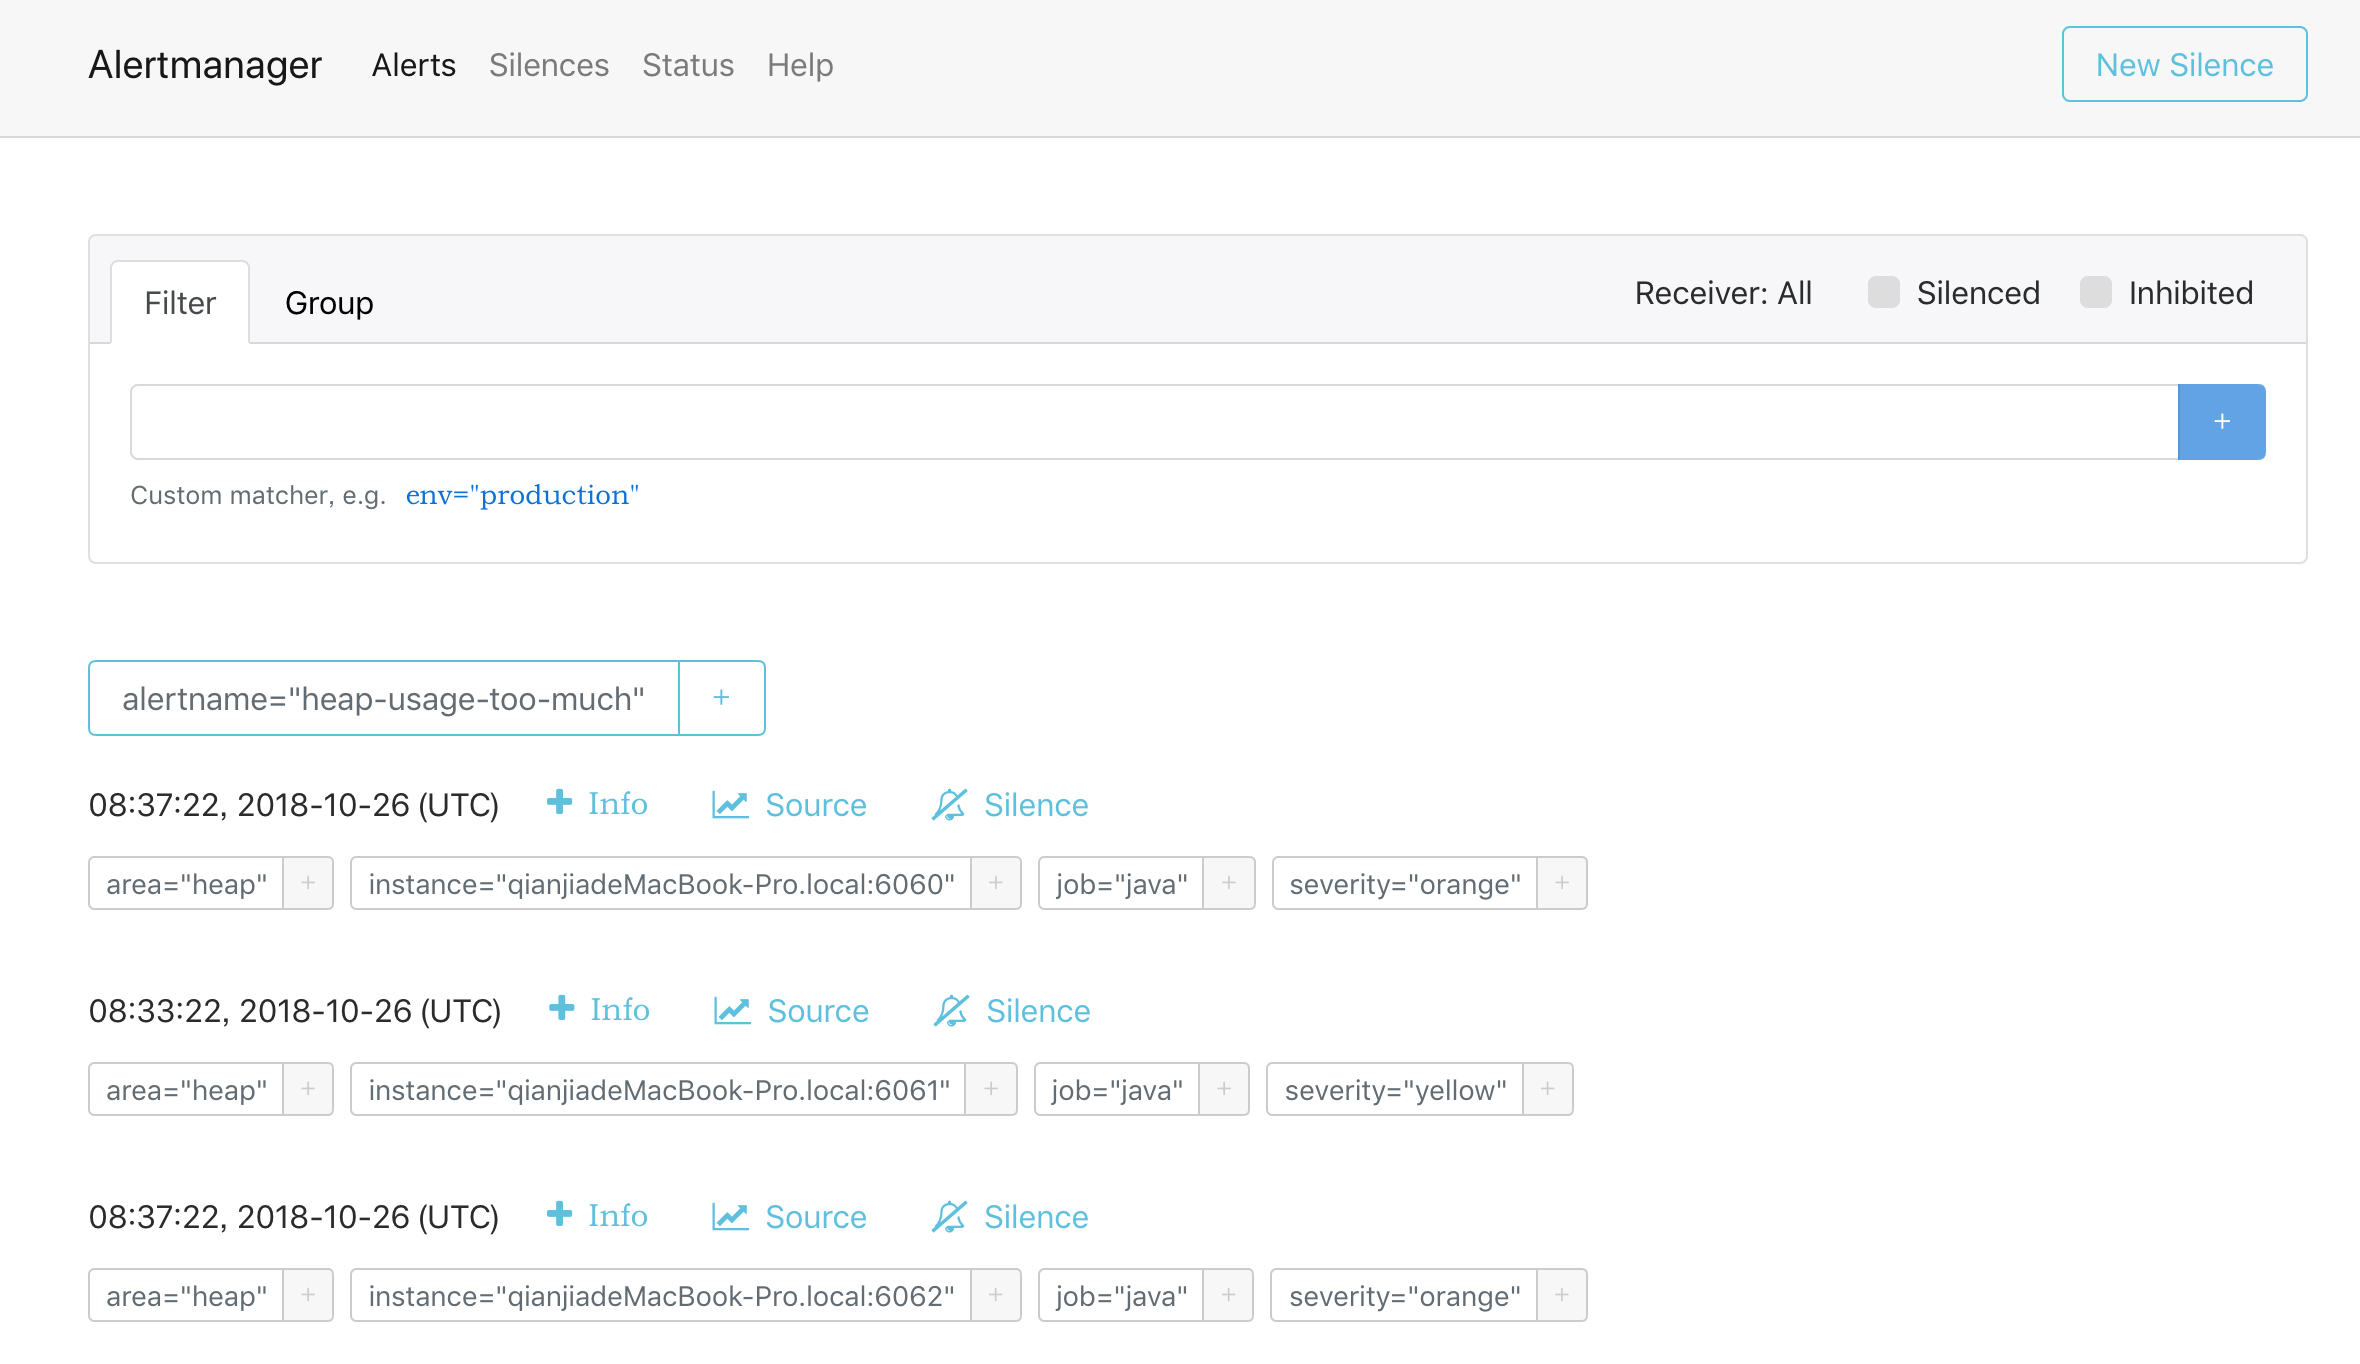
docker run -d \--name=alertmanager \-v <path-to-prom-jvm-demo>:/alertmanager-config \-p 9093:9093 \prom/alertmanager --config.file=/alertmanager-config/alertmanager-config.yml4) 访问http://localhost:9093,看看有没有收到Prometheus发送过来的告警(如果没有看到稍等一下):
第五步:等待邮件
等待一会儿(最多5分钟)看看是否收到邮件。如果没有收到,检查配置是否正确,或者docker logs alertmanager看看alertmanager的日志,一般来说都是邮箱配置错误导致。
使用Prometheus+Alertmanager告警JVM异常情况相关推荐
- prometheus alertmanager告警pending
prometheus alertmanager告警在配置了for标签后 指标达到告警阈值一直处于pending状态 无法变成firing状态 配置如下 最后定位问题是因为将 value字段放到了lab ...
- 【Prometheus】Alertmanager告警全方位讲解
Prometheus告警简介 告警能力在Prometheus的架构中被划分成两个独立的部分.如下所示,通过在Prometheus中定义AlertRule(告警规则),Prometheus会周期性的对告 ...
- Prometheus 之 Alertmanager告警抑制与静默
一.告警级别 在rules告警规则中,根据不同的阈值制定不同的告警等级. 告警严重度 关键字 严重 critical.disaster.blocker.immediate.fatal.crit.sev ...
- Prometheus之Alertmanager告警
文章目录 告警流程 部署Alertmanager Alertmanager配置介绍 Prometheus rule文件配置 邮件告警 开启邮箱授权 配置Alertmanager 验证 钉钉告警 钉钉创 ...
- 通过Alertmanager实现Prometheus的告警告警配置(邮箱加钉钉)
通过Alertmanager实现Prometheus的告警 告警配置 Prometheus本身不支持的告警功能,主要通过插件Alertmanager来实现告警.Alertmanager用于接收Prom ...
- Prometheus+Alertmanager+webhook-dingtalk实现钉钉告警
文章目录 一.前提准备及规划 二.安装及启动 2.1 Prometheus安装启动 2.2 Node_export安装启动 2.3 Alertmanager安装启动 2.4 Webhook-dingt ...
- 搞搞 Prometheus 的告警原理
通俗易懂的一篇文章,主要介绍了 Prometheus 什么时候告警,什么时候不会告警.同时介绍了 Prometheus 告警原理. 警报是监控系统中必不可少的一块, 当然了, 也是最难搞的一块. 我们 ...
- prometheus+grafana告警,监控部署展示
服务器信息 监控服务器 目录:/home/monitor/ nginx代理服务器 配置文件:/home/nginx/con.d/monitor 被监控服务器服务部署 数据采集 #客户端 #node-e ...
- 服务器运维监控指标,运维体系~指标监控~Prometheus监控告警与日志
一 Prometheus 入门 1.1 入门介绍 运维体系~指标监控 先来一张图,说明一下Prometheus监控相关的软件和知识点. 1: 首先要安装:Prometheus, 负责收集各种监控指标, ...
最新文章
- CS架构和BS架构的发展趋势即在图像处理软件中的应用
- Windows下Nginx+Tomcat整合的安装与配置
- 【机器学习算法专题(蓄力计划)】十四、机器学习中逻辑回归
- [导入]关于复制目录架构
- linux的基础知识——CS模型流程图
- linuxoracle查看用户权限_权限管理系统设计过程
- setTimeOut传参数
- 从零开始徒手撸一个vue的toast弹窗组件
- 我选择 wxWidgets 而不是 Qt 作为图形用户界面框架的一些想法
- ajax请求sql数据库数据类型,ajax请求mysql文件数据库
- 算法精解:C语言描述(递归)
- 使用FMEA来分析系统的可用性
- 利用python脚本将微信聊天信息提取到txt文件
- 利用python进行数据分析第二版pdf百度云_利用Python进行数据分析(原书第2版) 中文翻译pdf高清版...
- Liunx 切换用户This account is currently not available
- Mothur3进阶_Mothur扩增子基因序列处理_数据比对、聚类及其处理评估
- 计算机编程abs是什么意思,VB编程中的“Abs”是什么意思?
- 范莎学院计算机专业,范莎学院会不会不容易毕业?
- Charles 连接 雷电模拟器(模拟器下载证书)
- 我的Android进阶之旅------经典的大客推荐(排名不分先后)!!