vue 图表组件_基于Vue.js中可用的JUI图表的Vue组件
vue 图表组件
可视图 (vue-graph)
A vue component library based on the JUI charts available in vuejs.
基于vuejs中可用的JUI图表的vue组件库。
安装 (Installation)
NPM (NPM)
npm install --save vue-graph浏览器 (Browser)
Just download dist/vue-graph.js and include it in your HTML file:
只需下载dist/vue-graph.js并将其包含在您HTML文件中:
<script src="https://cdnjs.cloudflare.com/ajax/libs/vue/2.5.16/vue.js"></script>
<script src="https://cdn.rawgit.com/juijs/vue-graph/2216ae2f/dist/vue-graph.js"></script>
ES模块 (ES Modules)
插入 (Plug-In)
import Vue from 'vue'
import VueGraph from 'vue-graph'Vue.use(VueGraph)
组件 (Components)
import Vue from 'vue'
import GraphLine3D from 'node_modules/vue-graph/src/components/line3d.js'
import NoteWidget from 'node_modules/vue-graph/src/components/widgets/note.js'
import LegendWidget from 'node_modules/vue-graph/src/components/widgets/legends.js'Vue.component(GraphLine3D.name, GraphLine3D);
Vue.component(NoteWidget.name, NoteWidget);
Vue.component(LegendWidget.name, LegendWidget);
用法 (Usage)
Unlike other chart components, vue-graph have child nodes in the chart called widgets. The widget is used as an additional function of charts such as chart title, legend, tooltip.
与其他图表组件不同,vue-graph在图表中具有称为小部件的子节点。 该小部件用作图表的附加功能,例如图表标题,图例,工具提示。
The following is a link you can test with CodePen.
以下是您可以使用CodePen测试的链接。
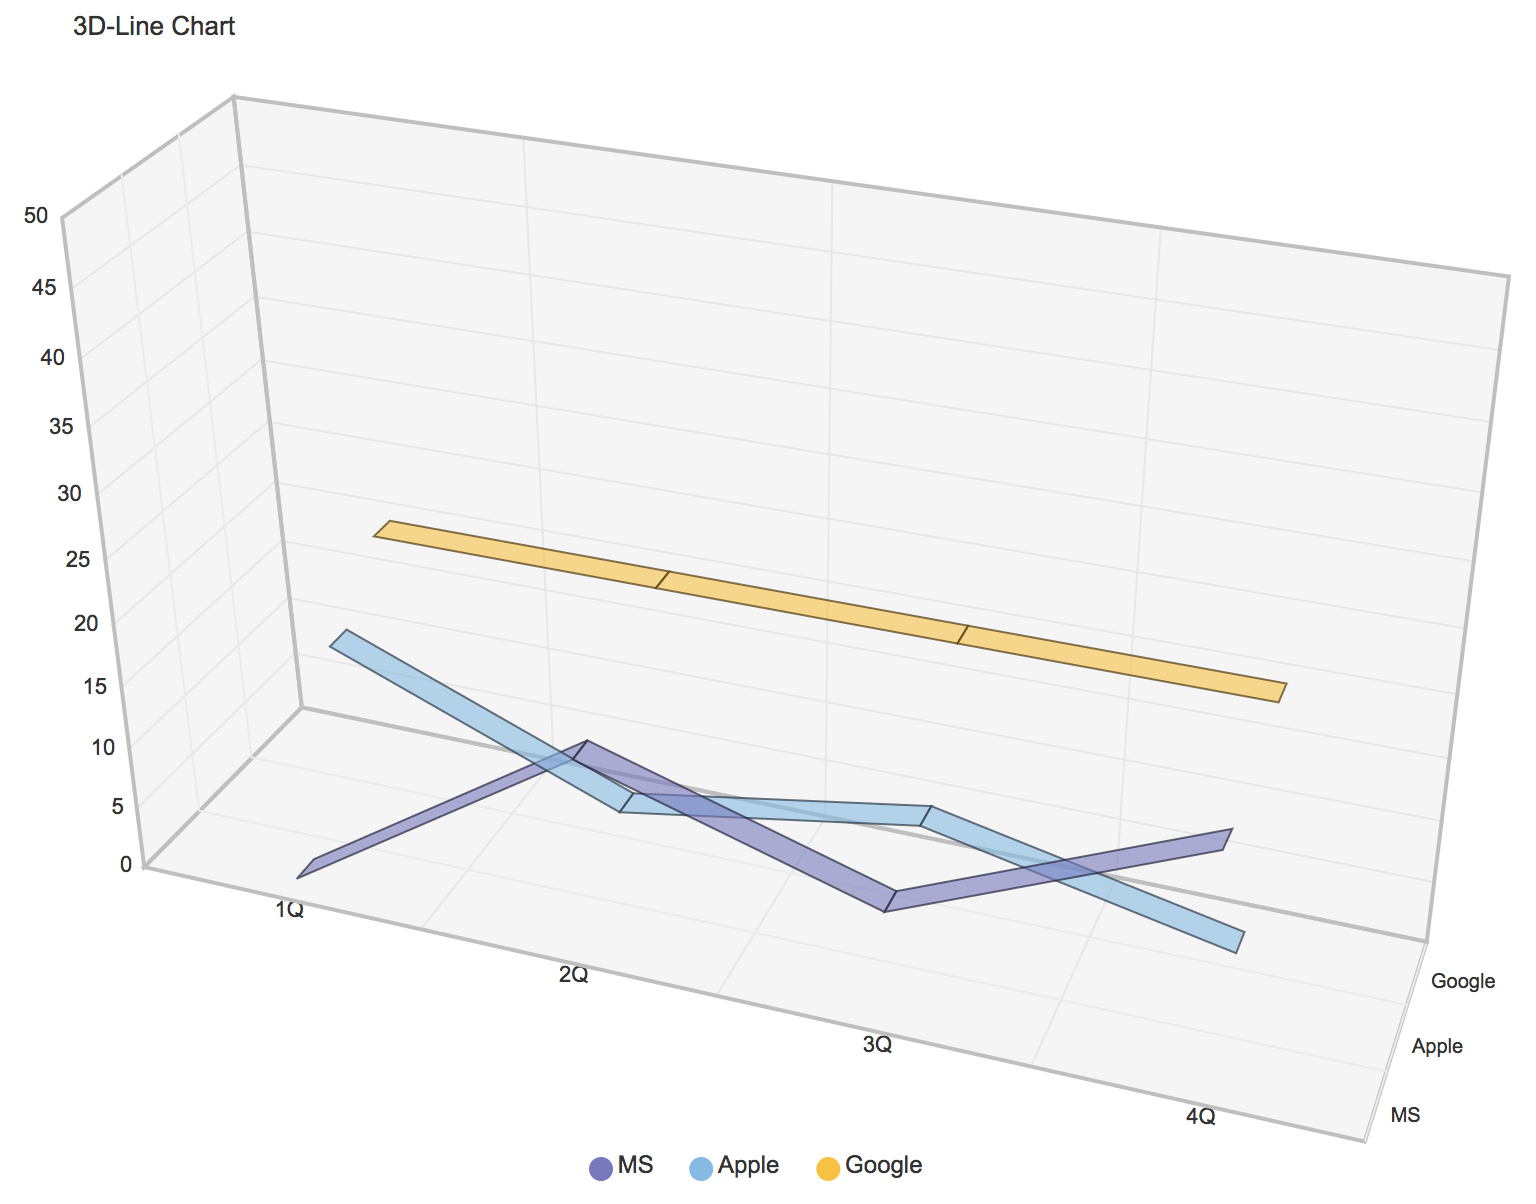
<div id="app"><graph-line3d:width="800":height="600":axis-min="0":axis-max="50":padding-top="100":padding-bottom="100":depth="180":labels="[ '1Q', '2Q', '3Q', '4Q' ]":names="names":values="values"><note :text="'3D-Line Chart'" :align="'left'"></note><legends :names="names"></legends></graph-line3d>
</div>
In the following code, the chart is prefixed with 'graph-' for each type. The widget can be added as a child node of the chart, unlike a chart, was named without a prefix.
在以下代码中,每种类型的图表都以“ graph-”为前缀。 可以将小部件添加为图表的子节点,与图表不同的是,该小部件的命名没有前缀。
The vue-graph can be combined with charts and widgets for a variety of visualizations. This is a very flexible and scalable structure.
Vue图形可以与图表和小部件结合使用,以实现各种可视化效果。 这是一个非常灵活和可扩展的结构。
var vm = new Vue({el: "#app",data: {names: [ "MS", "Apple", "Google" ],values: [[ 0, 15, 8, 18 ],[ 15, 6, 10, 5 ],[ 20, 20, 20, 20 ]]}
});
实施图表清单 (Implemented chart list)
There are many charts that have not yet been migrated. We are going to continue.
许多图表尚未迁移。 我们将继续。
Bar Chart
条形图
Bar Chart (Reverse)
条形图(反向)
Stack Bar Chart
堆叠条形图
Stack Bar Chart (Reverse)
堆叠条形图(反向)
Stack Bar Cahrt (Full Mode)
Stack Bar Cahrt(全模式)
Line Chart
折线图
Line Chart (Reverse)
折线图(反向)
Line Chart (Date+Block)
折线图(日期+块)
Line Chart (Time+Range)
折线图(时间+范围)
3D-Bar Chart
3D条形图
3D-Line Chart
3D折线图
Scatter Chart
散点图
Bubble Chart
气泡图
Area Chart
面积图
Pie Chart
饼形图
Pie Chart (Donut)
饼图(甜甜圈)
道具 (Props)
共同 (Common)
| Name | Type | Required | Watch | Default | Description |
|---|---|---|---|---|---|
| theme | String | false | false |
jennifer
|
Supports a total of five themes (jennifer, dark, pastel, gradient, pattern) |
| styles | Object | false | false |
undefined
|
Options to customize chart theme properties (Style Tab) |
| colors | Array, Function | false | false |
undefined
|
Options to change the list of colors defined by chart theme (Style Tab) |
| clip | Boolean | false | false | false | Option to cut if the drawing element is out of the chart range |
| format | Function | false | true |
undefined
|
A callback function that allows you to customize the axis values of the chart |
| width | Number | true | true |
undefined
|
The width of the chart |
| height | Number | true | true |
undefined
|
The height of the chart |
| paddingTop | Number | false | false | 50 | Top padding of the chart |
| paddingRight | Number | false | false | 50 | Right padding of the chart |
| paddingBottom | Number | false | false | 50 | Bottom padding of the chart |
| paddingLeft | Number | false | false | 50 | Left padding of the chart |
| labels | Array | false | true |
undefined
|
Label of chart data |
| values | Array | false | true |
undefined
|
It is a chart data value, and the format may be different for each chart type |
| 名称 | 类型 | 需要 | 看 | 默认 | 描述 |
|---|---|---|---|---|---|
| 主题 | 串 | 假 | 假 |
jennifer
|
总共支持五个主题( 詹妮弗 , 黑暗 , 粉彩 , 渐变 , 图案 ) |
| 样式 | 目的 | 假 | 假 |
undefined
|
自定义图表主题属性的选项 (“ 样式”选项卡 ) |
| 颜色 | 数组,函数 | 假 | 假 |
undefined
|
更改图表主题定义的颜色列表的选项 (“ 样式”选项卡 ) |
| 夹 | 布尔型 | 假 | 假 | 假 | 如果绘图元素不在图表范围内,则可以选择剪切 |
| 格式 | 功能 | 假 | 真正 |
undefined
|
允许您自定义图表的轴值的回调函数 |
| 宽度 | 数 | 真正 | 真正 |
undefined
|
图表的宽度 |
| 高度 | 数 | 真正 | 真正 |
undefined
|
图表的高度 |
| paddingTop | 数 | 假 | 假 | 50 | 图表的顶部填充 |
| paddingRight | 数 | 假 | 假 | 50 | 图表的右填充 |
| 底部填充 | 数 | 假 | 假 | 50 | 图表的底部填充 |
| paddingLeft | 数 | 假 | 假 | 50 | 图表的左填充 |
| 标签 | 数组 | 假 | 真正 |
undefined
|
图表数据标签 |
| 价值观 | 数组 | 假 | 真正 |
undefined
|
它是一个图表数据值,每种图表类型的格式可能不同 |
通用(XY轴) (Common (X-Y Axis))
| Name | Type | Required | Watch | Default | Description |
|---|---|---|---|---|---|
| axisMin | Number | false | false | 0 | Miniimum value for the chart axis |
| axisMax | Number | false | false | 0 | Maximum value for the chart axis |
| axisStep | Number | false | false | 10 | Display interval of chart axis value |
| axisXStyle | String | false | false |
solid
|
Line style for chart x-axis area (solid, dotted, gradient, hidden) |
| axisYStyle | String | false | false |
solid
|
Line style for chart y-axis area (solid, dotted, gradient, hidden) |
| axisXPosition | String | false | false |
bottom
|
Chart x-axis position (bottom, top) |
| axisYPosition | String | false | false |
left
|
Chart y-axis position (left, right) |
| axisReverse | Boolean | false | false | false | Replace the x and y axis positions |
| axisFullMode | Boolean | false | false | false | Draw a chart drawing element full of the axis label area. |
| axisInterval | Number | false | false | 1000 * 60 * 60 | It is the label value display interval of the date type (Unit: ms) |
| axisFormat | String, Function | false | false |
HH
|
It is the label value display format of the date type |
| 名称 | 类型 | 需要 | 看 | 默认 | 描述 |
|---|---|---|---|---|---|
| 轴最小值 | 数 | 假 | 假 | 0 | 图表轴的最小值 |
| axisMax | 数 | 假 | 假 | 0 | 图表轴的最大值 |
| axisStep | 数 | 假 | 假 | 10 | 图表轴值的显示间隔 |
| axisXStyle | 串 | 假 | 假 |
solid
|
图表x轴区域的线条样式( 实心 , 点划线 , 渐变 , 隐藏 ) |
| axisYStyle | 串 | 假 | 假 |
solid
|
图表y轴区域的线条样式( 实心 , 点划线 , 渐变 , 隐藏 ) |
| axisXPosition | 串 | 假 | 假 |
bottom
|
图表x轴位置( 底部 , 顶部 ) |
| axisYPosition | 串 | 假 | 假 |
left
|
图表y轴位置( 左 , 右 ) |
| axisReverse | 布尔型 | 假 | 假 | 假 | 替换x和y轴位置 |
| axisFullMode | 布尔型 | 假 | 假 | 假 | 绘制一个充满轴标签区域的图表图形元素。 |
| axisInterval | 数 | 假 | 假 | 1000 * 60 * 60 | 它是日期类型的标签值显示间隔(单位:毫秒) |
| axisFormat | 字符串,函数 | 假 | 假 |
HH
|
是日期类型的标签值显示格式 |
图表道具 (Props by charts)
图形栏 (graph-bar)
| Name | Type | Required | Watch | Default | Description |
|---|---|---|---|---|---|
| fixedSize | Number | false | false | 0 | Fixed width of bar (or height) |
| minValue | Number | false | false | 0 | When the value is very small, the minimum size of the bar |
| barMargin | Number | false | false | 2 | Margins between bars and bars |
| barPadding | Number | false | false | 1 | Inside padding inside the bar |
| activeIndex | Number | false | false |
undefined
|
The index of the bar to activate |
| activeEvent | String | false | false |
undefined
|
Event type to activate the bar |
| display | String | false | false |
undefined
|
Options that display the value of the bar (max, min, all) |
| 名称 | 类型 | 需要 | 看 | 默认 | 描述 |
|---|---|---|---|---|---|
| fixedSize | 数 | 假 | 假 | 0 | 固定杆宽度(或高度) |
| 最小值 | 数 | 假 | 假 | 0 | 当值很小时,最小尺寸条形 |
| barMargin | 数 | 假 | 假 | 2 | 条和条之间的边距 |
| barPadding | 数 | 假 | 假 | 1个 | 栏内的内部填充 |
| activeIndex | 数 | 假 | 假 |
undefined
|
激活栏的索引 |
| activeEvent | 串 | 假 | 假 |
undefined
|
活动类型以激活酒吧 |
| 显示 | 串 | 假 | 假 |
undefined
|
显示条形值的选项( max , min , all ) |
graph-bar3d (graph-bar3d)
| Name | Type | Required | Watch | Default | Description |
|---|---|---|---|---|---|
| names | Array | true | false |
undefined
|
Name of the z-axis data key |
| barPadding | Number | false | false | 20 | Inside padding inside the bar |
| 名称 | 类型 | 需要 | 看 | 默认 | 描述 |
|---|---|---|---|---|---|
| 名字 | 数组 | 真正 | 假 |
undefined
|
z轴数据键的名称 |
| barPadding | 数 | 假 | 假 | 20 | 栏内的内部填充 |
图栈条 (graph-stackbar)
| Name | Type | Required | Watch | Default | Description |
|---|---|---|---|---|---|
| fixedSize | Number | false | false | 0 | Fixed width of bar (or height) |
| barMargin | Number | false | false | 2 | Margins between bars and bars |
| barPadding | Number | false | false | 1 | Inside padding inside the bar |
| activeIndex | Number | false | false |
undefined
|
The index of the bar to activate |
| activeEvent | String | false | false |
undefined
|
Event type to activate the bar |
| display | String | false | false |
undefined
|
Options that display the value of the bar (max, min, all) |
| connectedLine | Boolean | false | false | false | Options that show the line connecting the bars and bars |
| fullMode | Boolean | false | false | false | Option to change to full stack bar |
| showText | Boolean | false | false | false | Options to show the percentage value in the bar |
| 名称 | 类型 | 需要 | 看 | 默认 | 描述 |
|---|---|---|---|---|---|
| fixedSize | 数 | 假 | 假 | 0 | 固定杆宽度(或高度) |
| barMargin | 数 | 假 | 假 | 2 | 条和条之间的边距 |
| barPadding | 数 | 假 | 假 | 1个 | 栏内的内部填充 |
| activeIndex | 数 | 假 | 假 |
undefined
|
激活栏的索引 |
| activeEvent | 串 | 假 | 假 |
undefined
|
活动类型以激活酒吧 |
| 显示 | 串 | 假 | 假 |
undefined
|
显示条形值的选项( max , min , all ) |
| 连接线 | 布尔型 | 假 | 假 | 假 | 显示连接条形图和条形图的线的选项 |
| fullMode | 布尔型 | 假 | 假 | 假 | 更改为全栈条的选项 |
| showText | 布尔型 | 假 | 假 | 假 | 在栏中显示百分比值的选项 |
图线 , 图线日期块 , 图线时间范围 (graph-line, graph-line-dateblock, graph-line-timerange)
| Name | Type | Required | Watch | Default | Description |
|---|---|---|---|---|---|
| shape | String | false | false |
normal
|
It is the shape of the line (normal, curve, step) |
| activeIndex | Number | false | false |
undefined
|
The index of the line to activate |
| activeEvent | String | false | false |
undefined
|
Event type to activate the line |
| display | String | false | false |
undefined
|
Options that display the value of the line (max, min, all) |
| opacity | Number | false | false |
undefined
|
The transparency of the line (Value between 0 and 1) |
| 名称 | 类型 | 需要 | 看 | 默认 | 描述 |
|---|---|---|---|---|---|
| 形状 | 串 | 假 | 假 |
normal
|
它是线的形状( 法线 , 曲线 , 台阶 ) |
| activeIndex | 数 | 假 | 假 |
undefined
|
要激活的行的索引 |
| activeEvent | 串 | 假 | 假 |
undefined
|
事件类型以激活线路 |
| 显示 | 串 | 假 | 假 |
undefined
|
显示行值的选项( max , min , all ) |
| 不透明 | 数 | 假 | 假 |
undefined
|
线的透明度(0到1之间的值) |
图line3d (graph-line3d)
| Name | Type | Required | Watch | Default | Description |
|---|---|---|---|---|---|
| names | Array | true | false |
undefined
|
Name of the z-axis data key |
| linePadding | Number | false | false | 20 | Inside padding inside the line |
| 名称 | 类型 | 需要 | 看 | 默认 | 描述 |
|---|---|---|---|---|---|
| 名字 | 数组 | 真正 | 假 |
undefined
|
z轴数据键的名称 |
| linePadding | 数 | 假 | 假 | 20 | 行内填充 |
图泡沫 (graph-bubble)
| Name | Type | Required | Watch | Default | Description |
|---|---|---|---|---|---|
| minSize | Number | false | false | 5 | Minimum size of bubble |
| maxSize | Number | false | false | 30 | Maximum size of bubble |
| showText | Boolean | false | false | false | Options to show the percentage value in the bubble |
| activeEvent | String | false | false |
undefined
|
Event type to activate the bubble |
| 名称 | 类型 | 需要 | 看 | 默认 | 描述 |
|---|---|---|---|---|---|
| 最小尺寸 | 数 | 假 | 假 | 5 | 气泡的最小尺寸 |
| maxSize | 数 | 假 | 假 | 30 | 气泡最大尺寸 |
| showText | 布尔型 | 假 | 假 | 假 | 在气泡中显示百分比值的选项 |
| activeEvent | 串 | 假 | 假 |
undefined
|
事件类型以激活气泡 |
图形区域 (graph-area)
| Name | Type | Required | Watch | Default | Description |
|---|---|---|---|---|---|
| shape | String | false | false |
normal
|
It is the shape of the area (normal, curve, step) |
| opacity | Number | false | false |
undefined
|
The transparency of the area (Value between 0 and 1) |
| borderLine | Boolean | false | false | true | Show lines on the border of the area |
| 名称 | 类型 | 需要 | 看 | 默认 | 描述 |
|---|---|---|---|---|---|
| 形状 | 串 | 假 | 假 |
normal
|
它是区域的形状( 法线 , 曲线 , 台阶 ) |
| 不透明 | 数 | 假 | 假 |
undefined
|
区域的透明度(值介于0和1之间) |
| 边缘 | 布尔型 | 假 | 假 | 真正 | 在区域边界上显示线条 |
图散点图 (graph-scatter)
| Name | Type | Required | Watch | Default | Description |
|---|---|---|---|---|---|
| shape | String | false | false |
circle
|
It is the shape of the scatter (circle, triangle, rectangle, cross) |
| activeEvent | String | false | false |
undefined
|
Event type to activate the scatter |
| display | String | false | false |
undefined
|
Options that display the value of the scatter (max, min, all) |
| opacity | Number | false | false |
undefined
|
The transparency of the scatter (Value between 0 and 1) |
| size | Number | false | false | 7 | Size of scatter (Value between 0 and 1) |
| hideZero | Boolean | false | false | false | Option to hide scatter when the value is 0 |
| 名称 | 类型 | 需要 | 看 | 默认 | 描述 |
|---|---|---|---|---|---|
| 形状 | 串 | 假 | 假 |
circle
|
它是散点图的形状( 圆形 , 三角形 , 矩形 , 十字形 ) |
| activeEvent | 串 | 假 | 假 |
undefined
|
事件类型以激活散点图 |
| 显示 | 串 | 假 | 假 |
undefined
|
显示散点值的选项( max , min , all ) |
| 不透明 | 数 | 假 | 假 |
undefined
|
散点图的透明度(值介于0和1之间) |
| 尺寸 | 数 | 假 | 假 | 7 | 散点大小(值介于0和1之间) |
| hideZero | 布尔型 | 假 | 假 | 假 | 当值为0时隐藏散点图的选项 |
图饼 (graph-pie)
| Name | Type | Required | Watch | Default | Description |
|---|---|---|---|---|---|
| shape | String | false | false |
pie
|
It is the shape of the pie (pie, donut) |
| activeIndex | Number, Array | false | false |
undefined
|
The index of the pie to activate |
| activeEvent | String | false | false |
undefined
|
Event type to activate the pie |
| showTextType | String | false | false |
undefined
|
Options that display the value of the pie (inside, outside) |
| dataFormat | Function | false | true |
undefined
|
Pie data format function |
| showTotalValue | Boolean | false | false |
undefined
|
Options that show total value in the center when the shape is donut |
| strokeWidth | Number | false | false | 50 | When the shape is donut, set the stroke width |
| 名称 | 类型 | 需要 | 看 | 默认 | 描述 |
|---|---|---|---|---|---|
| 形状 | 串 | 假 | 假 |
pie
|
它是馅饼的形状( 派 , 甜甜圈 ) |
| activeIndex | 数字,数组 | 假 | 假 |
undefined
|
激活饼图的索引 |
| activeEvent | 串 | 假 | 假 |
undefined
|
事件类型以激活饼图 |
| showTextType | 串 | 假 | 假 |
undefined
|
显示饼图值的选项( inside , outside ) |
| 数据格式 | 功能 | 假 | 真正 |
undefined
|
Pie数据格式功能 |
| showTotalValue | 布尔型 | 假 | 假 |
undefined
|
形状为甜甜圈时在中心显示总价值的选项 |
| strokeWidth | 数 | 假 | 假 | 50 | 当形状为甜甜圈时,设置笔触宽度 |
小部件的道具 (Props by widgets)
注意 (note)
A widget that can display text in a chart.
可以在图表中显示文本的小部件。
| Name | Type | Required | Watch | Default | Description |
|---|---|---|---|---|---|
| text | String | true | true | Text to display | |
| align | String | false | false |
center
|
Horizontal alignment (center, left, right) |
| verticalAlign | String | false | false |
top
|
Vertical alignment (top, bottom, middle) |
| dx | Number | false | false | 0 | x-axis position adjustment value |
| dy | Number | false | false | 0 | y-axis position adjustment value |
| size | Number | false | false |
undefined
|
Font size |
| color | String | false | false |
undefined
|
Font color |
| 名称 | 类型 | 需要 | 看 | 默认 | 描述 |
|---|---|---|---|---|---|
| 文本 | 串 | 真正 | 真正 | 显示文字 | |
| 对齐 | 串 | 假 | 假 |
center
|
水平对齐( 中心 , 左 , 右 ) |
| verticalAlign | 串 | 假 | 假 |
top
|
垂直对齐( 顶部 , 底部 , 中间 ) |
| dx | 数 | 假 | 假 | 0 | x轴位置调整值 |
| dy | 数 | 假 | 假 | 0 | y轴位置调整值 |
| 尺寸 | 数 | 假 | 假 |
undefined
|
字体大小 |
| 颜色 | 串 | 假 | 假 |
undefined
|
字体颜色 |
工具提示 (tooltip)
Widget showing chart element values.
显示图表元素值的小部件。
| Name | Type | Required | Watch | Default | Description |
|---|---|---|---|---|---|
| names | String | true | false | Name to map to value type | |
| position | String | false | false |
top
|
Vertical alignment (top, bottom, left, right) |
| showAnchor | Boolean | false | false | true | Options to display anchor |
| 名称 | 类型 | 需要 | 看 | 默认 | 描述 |
|---|---|---|---|---|---|
| 名字 | 串 | 真正 | 假 | 要映射到值类型的名称 | |
| 位置 | 串 | 假 | 假 |
top
|
垂直对齐( 顶部 , 底部 , 左侧 , 右侧 ) |
| showAnchor | 布尔型 | 假 | 假 | 真正 | 显示锚点的选项 |
传说 (legends)
Widget that represents the chart legend.
代表图表图例的小部件。
| Name | Type | Required | Watch | Default | Description |
|---|---|---|---|---|---|
| names | String | true | false | Name to map to value type | |
| align | String | false | false |
center
|
Horizontal alignment (center, start, end) |
| position | String | false | false |
bottom
|
Vertical alignment (top, bottom, left, right) |
| dx | Number | false | false | 0 | x-axis position adjustment value |
| dy | Number | false | false | 0 | y-axis position adjustment value |
| filter | Boolean | false | false | false | Options to filter elements of a specific name |
| colors | Array | false | false |
undefined
|
Filtering element color by name |
| 名称 | 类型 | 需要 | 看 | 默认 | 描述 |
|---|---|---|---|---|---|
| 名字 | 串 | 真正 | 假 | 要映射到值类型的名称 | |
| 对齐 | 串 | 假 | 假 |
center
|
水平对齐( 中心 , 开始 , 结束 ) |
| 位置 | 串 | 假 | 假 |
bottom
|
垂直对齐( 顶部 , 底部 , 左侧 , 右侧 ) |
| dx | 数 | 假 | 假 | 0 | x轴位置调整值 |
| dy | 数 | 假 | 假 | 0 | y轴位置调整值 |
| 过滤 | 布尔型 | 假 | 假 | 假 | 用于过滤特定名称的元素的选项 |
| 颜色 | 数组 | 假 | 假 |
undefined
|
按名称过滤元素颜色 |
指导方针 (guideline)
Widget to help you see x-y axis values easily.
帮助您轻松查看xy轴值的小部件。
| Name | Type | Required | Watch | Default | Description |
|---|---|---|---|---|---|
| tooltipX | Boolean | false | false | false | Guidelines for displaying x-axis values |
| tooltipY | Boolean | false | false | true | Guidelines for displaying y-axis values |
| 名称 | 类型 | 需要 | 看 | 默认 | 描述 |
|---|---|---|---|---|---|
| 工具提示X | 布尔型 | 假 | 假 | 假 | 显示x轴值的准则 |
| 工具提示 | 布尔型 | 假 | 假 | 真正 | 显示y轴值的准则 |
大事记 (Events)
There are three types of events for the drawing object, outside and inside the axis area.
轴区域的外部和内部有三种类型的图形对象事件。
Bar Chart (+Event)
条形图(+事件)
<div id="app"><graph-bar:width="600":height="400":axis-min="0":axis-max="50":labels="[ '1Q', '2Q', '3Q', '4Q' ]":values="values":active-event="'click'"@click="onClickBar"@outside#click="onClickOutside"@inside#click="onClickInside"><note :text="'Bar Chart (+Event)'"></note></graph-bar>
</div>
<script>
var vm = new Vue({el: "#app",data: {values: [[ 10, 5, 5, 5 ],[ 40, 10, 10, 10 ],[ 30, 30, 30, 30 ]]},methods: {onClickBar: function() {console.log(arguments);alert("onClickBar");},onClickOutside: function() {console.log(arguments);alert("onClickOutside");},onClickInside: function() {console.log(arguments);alert("onClickInside");}}
});
</script>
Common events are shown in the table below.
常见事件如下表所示。
| Outside axis | Inside axis | Drawing object | Description |
|---|---|---|---|
| outside#click | inside#click | click | |
| outside#dblclick | inside#dblclick | dblclick | |
| outside#rclick | inside#rclick | rclick |
contextmenu
|
| outside#mouseover | inside#mouseover | mouseover | |
| outside#mouseout | inside#mouseout | mouseout | |
| outside#mousemove | inside#mousemove | mousemove | |
| outside#mousedown | inside#mousedown | mousedown | |
| outside#mouseup | inside#mouseup | mouseup |
| 外轴 | 内轴 | 绘图对象 | 描述 |
|---|---|---|---|
| 外部#click | 内部#点击 | 点击 | |
| outside#dblclick | 内部#dblclick | dblclick | |
| outside#rclick | 内部#rclick | 单击 |
contextmenu
|
| 外部#鼠标悬停 | 内部#鼠标悬停 | 鼠标移到 | |
| outside#mouseout | inside#mouseout | 鼠标移出 | |
| outside#mousemove | 内部#mousemove | 鼠标移动 | |
| outside#mousedown | 内部#mousedown | 按下鼠标 | |
| outside#mouseup | 内部#mouseup | 鼠标向上 |
翻译自: https://vuejsexamples.com/vue-components-based-on-the-jui-chart-available-in-vue-js/
vue 图表组件
vue 图表组件_基于Vue.js中可用的JUI图表的Vue组件相关推荐
- vue族谱架构_基于 Vue 实现动态家谱图/组织结构图
Vue-Tree-Chart 最近一个项目里有个前端绘制家谱图的需求,大概是下面这个样子: 点击节点会弹出操作菜单,实现增删改查等操作,查阅网上资料发现,现有案例基本都是基于orgchart这个jQu ...
- seo vue 动态路由_基于Vue SEO的四种方案
前言:众所周知,Vue SPA单页面应用对SEO不友好,当然也有相应的解决方案,下面列出几种最近研究和使用过的SEO方案,SSR和静态化基于Nuxt.js来说. 关于服务器渲染:,对Vue版本有要求, ...
- 基于node.js开发环境下创建及开发vue.js项目的环境配置骤
基于node.js开发环境下创建开发vue.js项目的环境配置骤如下: 步骤一:安装node.js,安装完后运行node -v命令检安装node的查版本,判断是否安装成功.Npm是node.js包管理 ...
- vue开发案例:基于Three.js搭建三维数字化场景
0.场景涉及的关键技术点 GLTFLoader加载gltf模型,并解析模型动画: 基于worker-loader在vue中使用web worker: 基于web worker动态设置模型(鸟.牛)的移 ...
- vue可以多次导入吗_vue中同一个页面多次使用同一个组件的相互干扰问题
我们知道,vue有一个重要的理念就是组件化,即将重复使用的功能点抽提出来作为组件,需要使用的页面只需要引用该组件即可得到相应的功能点. 而组件化的一个重要特性就是作用域隔离,即一个组件实例拥有一个私有 ...
- vscode vue解决跨域_在vs code 中如何创建一个自己的 Vue 模板代码
首先,在vs code 中打开定义模板代码的地方 第一步,点击"设置"图标按钮,在弹出的菜单中点击的"用户代码片段"(也就是模板) 第二步,在弹出的框中选择新建 ...
- vue key重复_【第2112期】 import { reactive } from #39;vue#39;
前言 今日早读文章由@Anthony Fu授权分享. @Anthony Fu,是 Vue 的 Core Team 的一员,在 Vue主要负责 @vue/composition-api 这个项目的维护. ...
- js 只准输入数字_基于TensorFlow.js的JavaScript机器学习
Credits: aijs.rocks 虽然python或r编程语言有一个相对容易的学习曲线,但是Web开发人员更喜欢在他们舒适的javascript区域内做事情.目前来看,node.js已经开始向每 ...
- Three.js中引入dat.gui库实现界面组件控制动画速度变量
场景 Three.js中使用requestAnimationFrame方法实现立方体转动和小球跳动的动画: https://blog.csdn.net/BADAO_LIUMANG_QIZHI/arti ...
- 大文件分片上传前端框架_基于Node.js的大文件分片上传
基于Node.js的大文件分片上传 我们在做文件上传的时候,如果文件过大,可能会导致请求超时的情况.所以,在遇到需要对大文件进行上传的时候,就需要对文件进行分片上传的操作.同时如果文件过大,在网络不佳 ...
最新文章
- 概念的图解 —— 数学
- 皮一皮:看看地铁有多挤...
- 双网卡绑定之负载均衡高可用(bond)
- Android攻城狮Gallery和ImageSwitcher制作图片浏览器
- 机器学习线性回归算法实验报告_从零实现机器学习算法(九)线性回归
- 1000行MySQL学习笔记,人手一份,建议收藏!
- python画3d图-Python 绘制酷炫的三维图步骤详解
- 【实习招聘】创新工场首席科学家、原ACL主席、MSRA副院长周明老师领导的NLP团队招聘机器翻译方向实习生...
- wextend matlab,小波学习之三(多孔算法与MATLAB swt剖析)转载
- 国内外优秀音视频博客
- CoolFire系列讲座 第7讲
- 凸优化理论(一)数学优化问题的分类
- panabit之HTTP管控
- 凉宫春日的忧郁第二章
- linux平台使用yum安装mysql
- kettle-java代码执行hive相关ktr时报错: database type with plugin id [HIVE2] couldn‘t be found!
- 硬盘RAID5后使用的实际容量
- 丙烯颜料试用心得和丙烯绘画入门
- was not declared in this scop
- 序列(sequence)(Python入门十二)