python 特征选择 绘图 + mine
demo代码:
# _*_coding:UTF-8_*_
import numpy as np
import sys
import pandas as pd
from pandas import Series,DataFrame
import numpy as np
import sys
from sklearn import preprocessing
from sklearn.ensemble import ExtraTreesClassifier
import os
from minepy import MINEdef iterbrowse(path):for home, dirs, files in os.walk(path):for filename in files:yield os.path.join(home, filename)def get_data(filename):white_verify = []with open(filename) as f:lines = f.readlines()data = {}for line in lines:a = line.split("\t")if len(a) != 78: print(line)raise Exception("fuck")white_verify.append([float(n) for n in a[3:]])return white_verifyif __name__ == '__main__':# pdb.set_trace()neg_file = "cc_data/black_all.txt"pos_file = "cc_data/white_all.txt"X = []y = []if os.path.isfile(pos_file):if pos_file.endswith('.txt'):pos_set = np.genfromtxt(pos_file)elif pos_file.endswith('.npy'):pos_set = np.load(pos_file)X.extend(pos_set)y += [0] * len(pos_set)if os.path.isfile(neg_file):if neg_file.endswith('.txt'):neg_set = np.genfromtxt(neg_file)elif neg_file.endswith('.npy'):neg_set = np.load(neg_file)'''X.extend(list(neg_set) * 5)y += [1] * (5 * len(neg_set))'''X.extend(neg_set)y += [1] * len(neg_set)print("len of X:", len(X))print("X sample:", X[:3])print("len of y:", len(y))print("y sample:", y[:3])X = [x[3:] for x in X]print("filtered X sample:", X[:3])cols = [str(i + 6) for i in range(len(X[0]))]clf = ExtraTreesClassifier()clf.fit(X, y)print (clf.feature_importances_)print "Features sorted by their score:"print sorted(zip(clf.feature_importances_, cols), reverse=True)black_verify = []for f in iterbrowse("todo/top"):print(f)black_verify += get_data(f)# ValueError: operands could not be broadcast together with shapes (1,74) (75,) (1,74)print(black_verify)black_verify_labels = [3] * len(black_verify)white_verify = get_data("todo/white_verify.txt")print(white_verify)white_verify_labels = [2] * len(white_verify)unknown_verify = get_data("todo/pek_feature74.txt")print(unknown_verify)# extend dataX = np.concatenate((X, black_verify))y += black_verify_labelsX = np.concatenate((X, white_verify))y += white_verify_labels#################################### plot ####################################data_train = pd.DataFrame(X)# cols = [str(i) for i in range(6, 81)]data_train.columns = cols# add label column# data_train = data_train.assign(label=pd.Series(y))data_train["label"] = pd.Series(y)print(data_train.info())print(data_train.columns)import matplotlib.pyplot as pltfor col in cols:fig = plt.figure(figsize=(20, 16), dpi=8)fig.set(alpha=0.2)plt.figure()data_train[data_train.label == 0.0][col].plot()data_train[data_train.label == 1.0][col].plot()data_train[data_train.label == 2.0][col].plot()data_train[data_train.label == 3.0][col].plot()plt.xlabel(u"sample data id")plt.ylabel(u"value")plt.title(col)plt.legend((u'white', u'black', u"white-todo", u"black-todo"), loc='best')plt.show()print "calculate MINE mic value:"for col in cols:print col,mine = MINE(alpha=0.6, c=15,est="mic_approx")  # http://minepy.readthedocs.io/en/latest/python.html#second-examplemine.compute_score(data_train[col], y)print "MIC=", mine.mic()sys.exit(-1)
extend data 表示待预测的数据
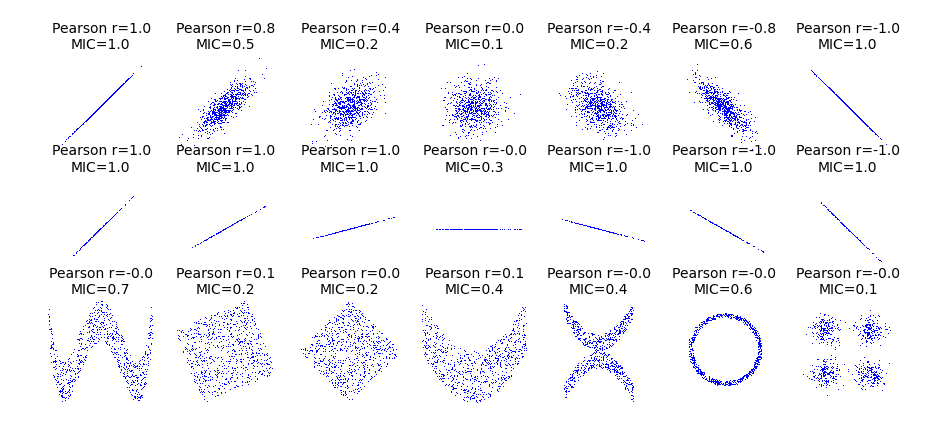
关于mic:
from __future__ import division
import numpy as np import matplotlib.pyplot as plt from minepy import MINE rs = np.random.RandomState(seed=0) def mysubplot(x, y, numRows, numCols, plotNum, xlim=(-4, 4), ylim=(-4, 4)): r = np.around(np.corrcoef(x, y)[0, 1], 1) mine = MINE(alpha=0.6, c=15, est="mic_approx") mine.compute_score(x, y) mic = np.around(mine.mic(), 1) ax = plt.subplot(numRows, numCols, plotNum, xlim=xlim, ylim=ylim) ax.set_title('Pearson r=%.1f\nMIC=%.1f' % (r, mic),fontsize=10) ax.set_frame_on(False) ax.axes.get_xaxis().set_visible(False) ax.axes.get_yaxis().set_visible(False) ax.plot(x, y, ',') ax.set_xticks([]) ax.set_yticks([]) return ax def rotation(xy, t): return np.dot(xy, [[np.cos(t), -np.sin(t)], [np.sin(t), np.cos(t)]]) def mvnormal(n=1000): cors = [1.0, 0.8, 0.4, 0.0, -0.4, -0.8, -1.0] for i, cor in enumerate(cors): cov = [[1, cor],[cor, 1]] xy = rs.multivariate_normal([0, 0], cov, n) mysubplot(xy[:, 0], xy[:, 1], 3, 7, i+1) def rotnormal(n=1000): ts = [0, np.pi/12, np.pi/6, np.pi/4, np.pi/2-np.pi/6, np.pi/2-np.pi/12, np.pi/2] cov = [[1, 1],[1, 1]] xy = rs.multivariate_normal([0, 0], cov, n) for i, t in enumerate(ts): xy_r = rotation(xy, t) mysubplot(xy_r[:, 0], xy_r[:, 1], 3, 7, i+8) def others(n=1000): x = rs.uniform(-1, 1, n) y = 4*(x**2-0.5)**2 + rs.uniform(-1, 1, n)/3 mysubplot(x, y, 3, 7, 15, (-1, 1), (-1/3, 1+1/3)) y = rs.uniform(-1, 1, n) xy = np.concatenate((x.reshape(-1, 1), y.reshape(-1, 1)), axis=1) xy = rotation(xy, -np.pi/8) lim = np.sqrt(2+np.sqrt(2)) / np.sqrt(2) mysubplot(xy[:, 0], xy[:, 1], 3, 7, 16, (-lim, lim), (-lim, lim)) xy = rotation(xy, -np.pi/8) lim = np.sqrt(2) mysubplot(xy[:, 0], xy[:, 1], 3, 7, 17, (-lim, lim), (-lim, lim)) y = 2*x**2 + rs.uniform(-1, 1, n) mysubplot(x, y, 3, 7, 18, (-1, 1), (-1, 3)) y = (x**2 + rs.uniform(0, 0.5, n)) * \ np.array([-1, 1])[rs.random_integers(0, 1, size=n)] mysubplot(x, y, 3, 7, 19, (-1.5, 1.5), (-1.5, 1.5)) y = np.cos(x * np.pi) + rs.uniform(0, 1/8, n) x = np.sin(x * np.pi) + rs.uniform(0, 1/8, n) mysubplot(x, y, 3, 7, 20, (-1.5, 1.5), (-1.5, 1.5)) xy1 = np.random.multivariate_normal([3, 3], [[1, 0], [0, 1]], int(n/4)) xy2 = np.random.multivariate_normal([-3, 3], [[1, 0], [0, 1]], int(n/4)) xy3 = np.random.multivariate_normal([-3, -3], [[1, 0], [0, 1]], int(n/4)) xy4 = np.random.multivariate_normal([3, -3], [[1, 0], [0, 1]], int(n/4)) xy = np.concatenate((xy1, xy2, xy3, xy4), axis=0) mysubplot(xy[:, 0], xy[:, 1], 3, 7, 21, (-7, 7), (-7, 7)) plt.figure(facecolor='white') mvnormal(n=800) rotnormal(n=200) others(n=800) plt.tight_layout() plt.show()

转载于:https://www.cnblogs.com/bonelee/p/9081328.html
python 特征选择 绘图 + mine相关推荐
- 通过构建DCA(Decision Curve Analysis)模型、获取模型数据并使用python进行绘图
通过构建DCA(Decision Curve Analysis)模型.获取模型数据并使用python进行绘图 关于DCA(Decision Curve Analysis)的基本概念以及绘图方法参考 在 ...
- python turtle循环图案-有趣的Python turtle绘图
原标题:有趣的Python turtle绘图 Python Turtle是Python的一个编程教育类库,越来越受到教育者的关注,近日,以"智能时代,逐梦成长"为主题的第5届全国青 ...
- 编程软件python图片-python Plotly绘图工具的简单使用
1.plotly库的相关介绍 1)相关说明 plotly是一个基于javascript的绘图库,plotly绘图种类丰富,效果美观: 易于保存与分享plotly的绘图结果,并且可以与Web无缝集成: ...
- python画图三维-Python三维绘图之Matplotlib库的使用方法
前言 在遇到三维数据时,三维图像能给我们对数据带来更加深入地理解.python的matplotlib库就包含了丰富的三维绘图工具. 1.创建三维坐标轴对象Axes3D 创建Axes3D主要有两种方式, ...
- python画三维平面-Python三维绘图--Matplotlib
编辑推荐: 本文主要介绍如何用python的matplotlib库中丰富的三维绘图工具进行绘图,运用三维图给我们对数据带来更加深入地理解,希望对大家有帮助. 本文来自于csdn ,由火龙果软件Alic ...
- 用python的turtle画圆-(python海龟绘图怎么增加每次画圆的半径)
Python 如何调用graphics库画圆弧,半圆等 import turtle turtle.left(135) turtle.circle(120,90) turtle.done() pytho ...
- python turtle 绘图速度用函数会快吗_有趣的Python turtle绘图
专 题 Feature Story 16 \ China Science & Technology Education 文 _ 毛京宇/北京师范大学第三附属中学 魏云靖/北京市师达中学 有趣的 ...
- python画图显示不了中文_完美解决Python matplotlib绘图时汉字显示不正常的问题
Matplotlib是一个很好的作图软件,但是python下默认不支持中文,所以需要做一些修改,方法如下: 1.在python安装目录的Lib目录下创建ch.py文件. 文件中代码为: 保存,以后通过 ...
- Python+matplotlib绘图时显示中文的设置方法
封面图片:<Python程序设计基础与应用>(ISBN:9787111606178),董付国,机械工业出版社 图书详情: =================== 在使用Python+mat ...
最新文章
- asp创建mysql表_创建一个数据库,用ASP怎么写?
- redis RedisTemplate实现分布式锁
- python爬虫多url_Python爬虫实战入门六:提高爬虫效率—并发爬取智联招聘
- 57、vi常见用法,tags
- 车窗上为啥总有一些小黑点?没想到居然藏着大作用!
- Spring Tools 4 for Eclipse 下载
- java-第十章-类和对象-创建管理员对象
- 可怕!CPU 竟成了黑客的帮凶!
- 笔记本插入网线接口没反应
- python有趣小程序 表白-python表白小程序
- Python文件读取
- 蔡康永的201堂情商课
- archmanjaro添加black arch及cn源
- 2022-05-14 Unity核心7——2D动画
- es6 去掉空格_ES6之字符串
- STM32 BOOT0与BOOT1 的应用原理
- 数字式竞赛抢答器(基于Quartus的原理图设计)FPGA
- 再见SpringMVC!java语言程序设计第三版答案郎波
- Java实现 LeetCode 390 消除游戏
- 广州大学大学物理练习6 振动力学
热门文章
- ngx_http_redis_module配置使用
- html5如何让保存的信息立即显示出来,如何用HTML5存储用户输入的信息
- java发红包课程设计_JAVA 实现简单的发红包案例
- python逗号运算符_x,= ... - 这个尾随逗号是逗号运算符吗?
- python list除以_扫描器篇(三)之python编写基于字典的网站目录探测脚本
- mac 查看端口_如何重置mac上的系统管理控制器smc教程
- mysql中检索以名字_【MySQL必知必会】第四章 检索数据
- 浏览器加载本地html页面,在浏览器字段中加载本地HTML文件时是否显示白屏?
- python个人博客源码_我的使用Sanic的个人博客源码开源了!
- 数据库综合设计java_JAVA程序综合设计数据库设计_
