数据中心细节_当细节很重要时数据不平衡
数据中心细节
定义不平衡数据 (Definition Imbalanced Data)
When we speak of imbalanced data, what we mean is that at least one class is underrepresented. For example, when considering the problem of building a classifier, let’s call it the Idealisstic-Voter. We give it the task of identifying politicians that the American public finds trustworthy. When looking at the dataset, we realize that almost every sample is hugely unpopular.
当我们谈到数据不平衡时,我们的意思是说至少有一个 类别 的代表性不足 。 例如,在考虑构建分类器的问题时,我们称其为Idealisstic-Voter。 我们的任务是确定美国公众认为值得信赖的政治人物。 当查看数据集时,我们意识到几乎每个样本都不受欢迎。
In classifying terminology we call the classes with very few samples the minority-classes and the ones with many the majority-classes.
在对术语进行分类时,我们将很少样本的类别称为少数类别 ,而将多数样本称为多数类别 。
那么问题是什么呢? (So what is the issue?)
Let’s assume there are 100 politicians, and only one of them is considered trustworthy by the broad public; let’s call him Abraham. We could now quickly build an Idealisstic-Voter. That achieves a Precision of 99% by simply saying “all politicians are liars,” i.e. classifying all politicians as untrustworthy. The loss will be low, and we can make an excellent presentation about how great our Idealisstic-Voter scores on the most common metrics.
假设有100位政治人物,而其中只有一位被广大公众信任。 我们叫他亚伯拉罕。 现在,我们可以快速构建理想选民。 只需说“所有政客都是骗子”,即将所有政客归类为不信任,即可达到99%的精确度。 损失将很小,我们可以就最常见的指标上的Idealisstic-Voter得分有多出色做一个很好的介绍。
PRECISION = TP / (TP+FP) = 99%ACCURACY = TP / (TP + FN) = 99 %F1 = (2*PRECISION*RECALL)/(PRECISION+RECALL) = 99.5 %But that is not the goal! What we want is to split the good from the bad, and we really did not split anything. So how can we detect that we have a problem? That we did injustice to Abraham, and we all know he does not like injustices …
但这不是目标! 我们想要的是将好事与坏事分开,而我们实际上并没有将任何事情分开。 那么,如何检测到我们有问题呢? 我们对亚伯拉罕造成了不公正,我们都知道他不喜欢不公正……
平衡指标 (Balanced Metrics)
Whenever you are working with imbalanced data, make it a habit to also look at the balanced metrics. They do the same as the ones you are familiar with, but additionally, they take the average over all classes.
每当您使用不平衡的数据时,请养成也要注意平衡的指标的习惯。 它们的作用与您熟悉的方法相同,但此外,它们取所有类的平均值。
BALANCED_PRECISION=(P_TRUSTWORTHY + P_UNTRUSTWORTHY)/2=50%Another metric that works very nicely in this context is the False Positive Rate in comparison with the True Positive Rate. In the multilabel case, you will mostly opt for some macro-averaged score.
在这种情况下,另一个非常有效的指标是误报率与误报率。 在多标签的情况下,您通常会选择一些宏观平均得分。
We realized that we have a problem, how can we solve it?
我们意识到自己有问题,如何解决?
上采样和下采样 (Upsampling and Downsampling)
Probably the simplest way you can use to make the Idealisstic-Voter solve the problem by himself is by presenting him with more reasonable options. This would mean either collecting more data or using the lovely Upsampling technique.
也许使您的Idealisstic-Voter自己解决问题的最简单方法就是为他提供更合理的选择。 这意味着要么收集更多数据,要么使用可爱的升采样技术。
This technique works such that we clone our beloved Abraham, meaning that we duplicate the members of the minority class. Once we balanced the dataset to a sufficient degree, we will notice that our model has actually to learn something to attain a good score!
这种技术的工作原理是我们克隆了我们心爱的亚伯拉罕,这意味着我们复制了少数群体的成员。 一旦我们将数据集平衡到足够的程度,我们就会注意到我们的模型实际上必须学习一些东西才能获得高分!
下采样 (Downsampling)
The opposite of Upsampling is Downsampling, aka Undersampling. This technique is great if you have more than enough data to do your job (Which never happened to me, but I assume the big data collectors of this world may sometimes be in this position).
上采样的相反是下采样,也就是欠采样。 如果您有足够多的数据来完成工作,则此技术非常有用(这对我而言从未发生过,但我认为这个世界的大数据收集者有时可能会处于这个位置)。
In this case, you can eliminate some of the instances of the majority class. You don’t have to go 50–50, but enough to make the Idealisstic-Voter motivated to learn something. The same holds for all of the techniques we are discussing today.
在这种情况下,您可以消除多数类的某些实例。 您不必走50–50,但足以使Idealisstic-Voter有动力学习一些东西。 我们今天讨论的所有技术都一样。
生成合成样本 (Generating Synthetic Samples)
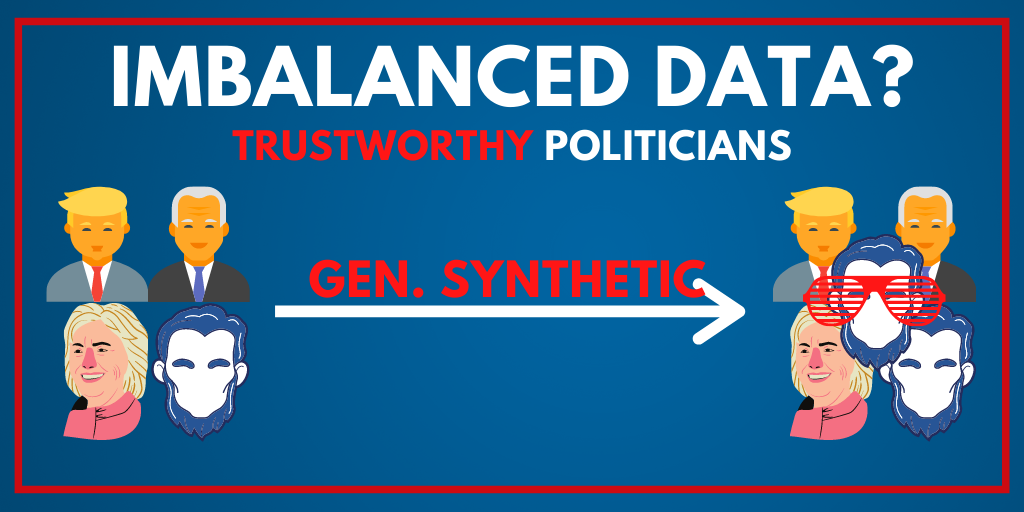
Ok, now we are getting into the cool things. How about we generate data out of thin air? How about we add some Abrahams with cool techno glasses? He’d surely be just as trustworthy and additionally win the Youth Vote!
好的,现在我们进入了很酷的事情。 我们如何凭空生成数据呢? 我们如何添加一些带有酷炫技术眼镜的亚伯拉罕呢? 他肯定会同样值得信赖,并且还会赢得青年投票!
加一点ϵps (Adding a little bit of ϵps)
Let’s say our dataset has the feature age. We can clearly see that the only trustworthy politicians are 2020–1809 = 211 years old, 1809 being Abraham’s birth year. But what about politicians that have all the same accomplishments but are 211.001 and 210.999 years old?
假设我们的数据集具有特征年龄。 我们可以清楚地看到,唯一值得信赖的政客是2020- 1809年= 211岁,而1809年是亚伯拉罕的出生年。 但是,具有相同成就但分别具有211.001和210.999岁的政治家呢?
Probably the same! But be extremely careful when using this technique since you are effectively falsifying your data. This technique can easily backfire, and you should only use it when you are very confident that it is the right choice. But this brings us to a slightly more elaborate and automated technique.
大概一样! 但是,使用此技术时要格外小心,因为您实际上是在篡改数据。 此技术很容易适得其反,只有在非常确信它是正确的选择时,才应使用它。 但这将我们带入了一种更加精细和自动化的技术。
冒烟 (SMOTE)
SMOTE stands for Synthetic Minority Over-sampling Technique. It constructs new samples by carefully observing the attributes of all samples. It then proceeds to alter the values just so that they stay within the range observed in our minority-class. Sounds complicated, let’s look at a simple example, and it should become as clear as your mouse clicks on the clap. Let’s assume we add JFK to the dataset and look again at the age of trustworthy politicians.
SMOTE代表合成少数族裔过采样技术。 它通过仔细观察所有样本的属性来构造新样本。 然后,它继续更改这些值,以使它们保持在我们的少数群体观察到的范围内。 听起来很复杂,让我们看一个简单的示例,它应该就像您的鼠标单击拍手一样清晰。 假设我们将JFK添加到数据集中,然后再次查看可信赖的政治人物的年龄。
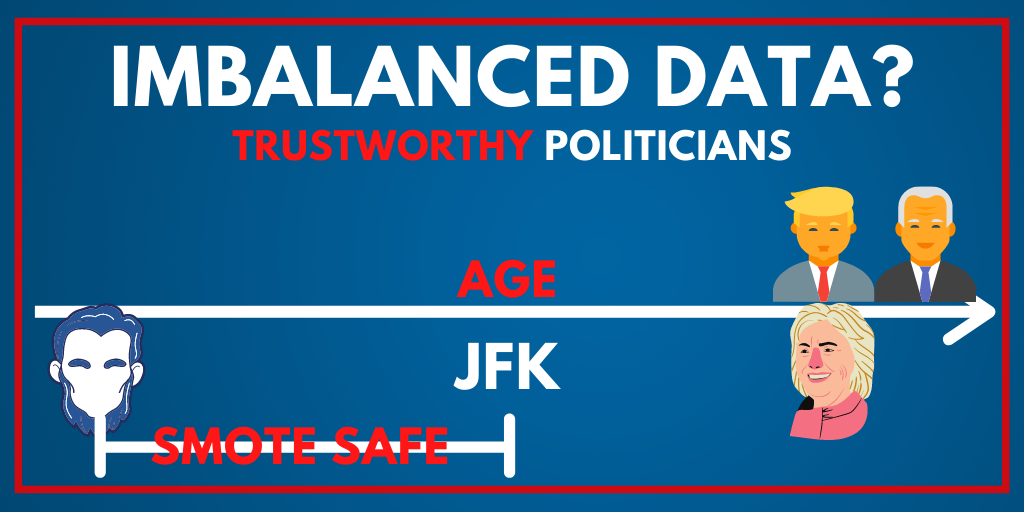
As we can see, the area indicated as SMOTE SAFE is the area in which we can freely generate new synthetic samples! You can find a more in-depth explanation here. It is fascinating, but I think it is most important to know that such methods exist.
如我们所见,标为“ SMOTE SAFE”的区域是我们可以自由生成新的合成样本的区域! 您可以在这里找到更深入的解释。 令人着迷,但是我认为最重要的是要知道这种方法的存在。
发挥创意 (Get Creative)
We can find some incredible examples of this technique in the autonomous driving scene. While all the major competitors in this field have collected several petabytes of data, conditions such as kids running in front of cars should be tested before actually encountering them. These cases may also happen so rarely that you will never find enough training data.
我们可以在自动驾驶场景中找到这种技术的一些令人难以置信的例子。 尽管该领域的所有主要竞争对手都收集了数PB的数据,但在实际遇到汽车前奔跑的孩子等情况之前,应先进行测试。 这些情况可能也很少发生,以至于您永远找不到足够的培训数据。
Generating Synthetic data to test such and various other edge cases under many different lighting and weather conditions is a must. One often uses GAN’s or similar networks to convert already existing samples into various other forms, e.g., in winter or when raining. There are multiple ways of how this can be done. A short video that illustrates this can be seen here (I am not affiliated with them nor know how good they are, but they have an excellent short video ;)
必须生成合成数据以测试在许多不同的光照和天气条件下的此类以及其他各种边缘情况。 人们经常使用GAN或类似的网络将已经存在的样本转换为其他各种形式,例如在冬天或下雨天。 有多种方法可以做到这一点。 可以在此处看到一个简短的视频来说明这一点(我不隶属于他们,也不知道他们有多棒,但是他们有一个很棒的短视频;)
更改损失函数 (Change The Loss Function)
But we do have one more thing! What if I told you that instead of dealing with the problem at the data level, we could deal with it at the heart of our algorithm, the loss function.
但是,我们还有一件事! 如果我告诉您,我们可以在算法的核心(损失函数)处处理问题,而不是在数据级别处理问题。
Over the years, many approaches have been proposed, and there truly is no one size fits all. It quite often depends heavily on how important it is to identify the minority-class, and what kind of costs occur when you misclassify a sample for the majority class.
多年以来,已经提出了许多方法,并且确实没有一种方法能适合所有情况。 通常,这在很大程度上取决于识别少数群体的重要性,以及当您对多数群体的样本进行错误分类时会产生何种成本。
Weighted Loss Function, Define It Yourself
加权损失函数,自己定义
One way of mixing such a loss is simply by multiplying the terms in which a minority-class occurs with a constant>1. What this effectively does is encourage the model to pay more attention to the instances of the minority class. In Keras this is built in an can be applied without additional hassle
混合这种损失的一种方法就是简单地将出现少数类的项与常数> 1相乘。 这实际上是在鼓励模型更加关注少数群体的情况。 在Keras中,这是内置的,可以轻松应用
class_weights = {0: 1., 1: 50.}model.fit(X_train, Y_train,class_weights=class_weights)In this particular case, it tells Keras that it should treat one occurrence of class 1 as 50 instances of class 0. In some easy python pseudo-code, we could think of it as something like this
在这种特殊情况下,它告诉Keras,应将出现的1类事件视为50个0类实例。在一些简单的python伪代码中,我们可以将其视为这样的事情
def loss_weighted(x,y_true):y_pred=model.forward(x) if y_true==1: return 50*loss(y_pred,y_true) elif y_true==0: return 1*loss(y_pred,y_true)类平衡损失 (Class Balanced Loss)
As the amount of classes becomes bigger, it is tedious to defined things explicitly, as we did above. For this, a variety of solutions have been proposed, and one of the most notable works is “Class-Balanced Loss Based on Effective Number of Samples.”
随着类数量的增加,像我们上面所做的那样,显式定义事物很繁琐。 为此,提出了多种解决方案,其中最著名的作品之一是“ 基于有效样本数的类平衡损失 ”。
What they effectively proposed is reweighting the loss function. The authors do this in such a way that the effective amount of samples per class are taken into account. To control on what side of the balancing the loss ends up, one can additionally tune it with a hyperparameter.
他们有效建议的是对损失函数进行加权。 作者这样做的方式是考虑到每类样本的有效量。 为了控制损耗的平衡方向,可以另外使用超参数对其进行调谐。
While this is a very simplistic view of their process, I feel that it grasped the most important aspects to keep in your memory. If you ever encounter a case where you have a lot of classes and significant imbalances between the classes, make sure to give this approach a go.
尽管这是他们过程的非常简单的视图,但我认为它掌握了最重要的方面,可以保留在您的记忆中。 如果遇到类别过多且类别之间存在严重不平衡的情况,请确保采取这种方法。
结论 (Conclusion)
Congratulations, you know now what you can do when you encounter imbalanced data. Several approaches exist, and choosing the right one for your problem may not always be an easy task. It will heavily depend on your business needs to decide how much time and resources you want to put into balancing things more fairly. Being aware of potential solutions is the first step to solving them!
恭喜,您现在知道遇到不平衡数据时可以做什么。 存在几种方法,为您的问题选择正确的方法可能并不总是一件容易的事。 这将在很大程度上取决于您的业务需求,以决定您要花费多少时间和资源来更公平地平衡事务。 意识到潜在的解决方案是解决它们的第一步!
翻译自: https://towardsdatascience.com/imbalanced-data-when-details-matter-16bd3ec7ef74
数据中心细节
http://www.taodudu.cc/news/show-995369.html
相关文章:
- 余弦相似度和欧氏距离_欧氏距离和余弦相似度
- 机器学习 客户流失_通过机器学习预测流失
- 预测股票价格 模型_建立有马模型来预测股票价格
- 柠檬工会_工会经营者
- 大数据ab 测试_在真实数据上进行AB测试应用程序
- 如何更好的掌握一个知识点_如何成为一个更好的讲故事的人3个关键点
- 什么事数据科学_如果您想进入数据科学,则必须知道的7件事
- 季节性时间序列数据分析_如何指导时间序列数据的探索性数据分析
- 美团骑手检测出虚假定位_在虚假信息活动中检测协调
- 回归分析假设_回归分析假设的最简单指南
- 为什么随机性是信息
- 大数据相关从业_如何在组织中以数据从业者的身份闪耀
- 汉诺塔递归算法进阶_进阶python 1递归
- 普里姆从不同顶点出发_来自三个不同聚类分析的三个不同教训数据科学的顶点...
- 荷兰牛栏 荷兰售价_荷兰的公路货运是如何发展的
- 如何成为数据科学家_成为数据科学家需要了解什么
- 个人项目api接口_5个免费有趣的API,可用于学习个人项目等
- 如何评价强gis与弱gis_什么是gis的简化解释
- 自我接纳_接纳预测因子
- python中knn_如何在python中从头开始构建knn
- tb计算机存储单位_如何节省数TB的云存储
- 数据可视化机器学习工具在线_为什么您不能跳过学习数据可视化
- python中nlp的库_用于nlp的python中的网站数据清理
- 怎么看另一个电脑端口是否通_谁一个人睡觉另一个看看夫妻的睡眠习惯
- tableau 自定义省份_在Tableau中使用自定义图像映射
- 熊猫烧香分析报告_熊猫分析进行最佳探索性数据分析
- 白裤子变粉裤子怎么办_使用裤子构建构建数据科学的monorepo
- 青年报告_了解青年的情绪
- map(平均平均精度_客户的平均平均精度
- 鲜活数据数据可视化指南_数据可视化实用指南
数据中心细节_当细节很重要时数据不平衡相关推荐
- 华为大数据中心山西_吕梁智能大数据产业技术创新研究院 、华为山西(吕梁)大数据中心吕梁职业技术学院大数据学院同日揭牌成立...
图为吕梁智能大数据产业技术创新研究院揭牌仪式现场.记者王益炜摄 在第二届"数谷吕梁·智赢未来"吕梁大数据产业发展推介会举办之际,8月18日,吕梁智能大数据产业技术创新研究院.华为山 ...
- 数据中心服务器硬盘,PCI-E固态硬盘在数据中心的机会_希捷硬盘_服务器评测与技术-中关村在线...
PCI-Express固态硬盘相比其他接口的固态盘,拥有更为高级的连接接口和成熟的内存管理技术.一方面,它采用了可靠的协议体系架构,支持设备层面的协议错误检测.校正.报告和热插拔/热替换.支持可扩展带 ...
- 数据中心网络如何发展成为无损数据中心网络?
数据中心网络如何发展成为无损数据中心网络? 作者:袁冬至 公众号:救命的药 研究方向:数据中心网络 欢迎交流,学习! 数据中心网络如何实现无丢包.低时延.高吞吐的能力? 为解决上述问题,传统原生TCP ...
- 中国数据中心市场时评—简析全国数据中心布局情况
一.国内数据中心都建在哪里 1."北上广"及周边地区机架规模仍领跑全国 受5G.人工智能.大数据.云计算.移动互联网等技术发展以及在边缘计算.工业互联网.超高清视频.VR/AR等场 ...
- 杭州市发布:印发数据中心优化布局建设意见 新建数据中心PUE值不高于1.4
日前,杭州市经信局.杭州市发改委联合发布<关于杭州市数据中心优化布局建设的意见>,将加快杭州市数据中心新型基础设施建设,统筹协调杭州市地区数据中心优化布局. 关于杭州市数据中心优化布局建设 ...
- 数据中心意义和解决方案(绿色数据中心)
什么是绿色数据中心? 绿色数据中心的意思就是最小的环境影响,完成最高效的数据中心.这包括机房辅助设务,电和IT设备(服务器,存储设备,网络设备等).对于公司来说我们关心绿色数据中心主要原因就是希望降低 ...
- 网络安全04_互联网发展史_网线+网卡+协议栈_中继器_集线器_网桥_路由器_AC/AP_防火墙_流控_家庭网络_小型创业公司网络_园区网_政务网络_数据中心网络拓扑_电信网/互联网_Mac地址
互联网发展史 如何将两个主机连接起来? 在网络诞生之前,电脑都是单机运行,没有网卡,没有网线,没有协议栈,数据传输主要靠软盘.光盘等介质. 网线+网卡+协议栈 网线:物理介质,承载比特流/电信号(类似 ...
- 华为大数据中心山西_任正非:华为愿与山西一道建立“煤矿人工智能创新实验室”...
已是古稀之年的任老最近可以说是忙前忙后的,在美国科技制裁的重压之下,华为依然在不懈的努力着,这不,任老去了能源大省山西. 12月7日,山西省委书记楼阳生与华为技术有限公司创始人.董事.CEO任正非举行 ...
- python 气候_用Python下载美国国家气候数据中心(NCDC)的气候数据
美国国家气候数据中心的官网地址是https://www.ncdc.noaa.gov/ 气候数据的下载地址是: 长格式:ftp://ftp.ncdc.noaa.gov/pub/data/noaa/,这种 ...
最新文章
- MySQL_update同一张表
- python学费多少-Python开发学费一般多少钱?
- jQuery 3.1.1 官方下载地址
- WCF与 Web Service的区别
- C++尽可能使用const
- srs推flv流_srs流媒体服务器(simple rtmp server)如何支持h265
- 576. 出界的路径数
- C++学习 高级编程
- vs2017常量文本字符串无法转换成char*
- 程序员面试金典 - 面试题 17.25. 单词矩阵(Trie树+DFS回溯,hard)
- 【TensorFlow】Win7+Anaconda+python3.6+Tensorflow1.9安装教程
- Qt: error lnk1158 无法运行rc.exe
- Python进程间通信之管道Pipe
- JavaScript创建对象的三种方式之利用new object创建对象及使用方法(2)
- HDU 6706 huntian oy(杜教筛 + 一些定理)题解
- 如何用手机实现高精度定位导航
- MTCNN人脸检测与人脸对齐
- GAN·生成对抗网络——札记2-读《生成式对抗网络 GAN 的研究进展与展望》
- EndNote 使用教程
- Kotlin开发第六天,数据存储,持久化