python lime_本地可解释模型不可知的解释– LIME in Python
python lime
When working with classification and/or regression techniques, its always good to have the ability to ‘explain’ what your model is doing. Using Local Interpretable Model-agnostic Explanations (LIME), you now have the ability to quickly provide visual explanations of your model(s).
当使用分类和/或回归技术时,总是能够“解释”模型的作用总是很不错的。 使用本地可解释模型不可知的解释(LIME),您现在可以快速提供模型的视觉解释。
Its quite easy to throw numbers or content into an algorithm and get a result that looks good. We can test for accuracy and feel confident that the classifier and/or model is ‘good’…but can we describe what the model is actually doing to other users? A good data scientist spends some of their time making sure they have reasonable explanations for what the model is doing and why the results are what they are.
将数字或内容放入算法中并获得看起来不错的结果非常容易。 我们可以测试准确性,并对分类器和/或模型“良好”充满信心……但是我们可以描述该模型对其他用户的实际作用吗? 一位优秀的数据科学家会花费一些时间来确保他们对模型的工作方式以及结果为何才是合理的做出合理的解释。
There’s always been a focus on ‘trust’ in any type of modeling methodology but with machine learning and deep learning, many people feel like the black-box approach taken with these methods isn’t as trustworthy as other methods. This topic was addressed in a paper titled Why Should I Trust You?”: Explaining the Predictions of Any Classifier, which proposes the concept of Local Interpretable Model-agnostic Explanations (LIME). According to the paper, LIME is ‘an algorithm that can explain the predictions of any classifier or regressor in a faithful way, by approximating it locally with an interpretable model.’
在任何类型的建模方法中,始终都将“信任”作为重点,但是在机器学习和深度学习中,许多人感觉这些方法所采用的黑盒方法并不像其他方法那样值得信赖。 在题为“ 为什么我应该信任您?”的论文中解决了该主题。该论文解释了任何分类器的预测 ,提出了局部可解释模型不可知性解释(LIME)的概念。 根据该论文, LIME是 “一种算法,通过使用可解释的模型在局部逼近分类器或回归变量,可以忠实地解释任何分类器或回归变量的预测。”
I’ve used the LIME approach a few times in recent projects and really like the idea. It breaks down the modeling / classification techniques and output into a form that can be easily described to non-technical people. That said, LIME isn’t a replacement for doing your job as a data scientist, but it is another tool to add to your toolbox.
在最近的项目中,我已经多次使用LIME方法,并且非常喜欢这个想法。 它分解了建模/分类技术,并将其输出为非技术人员可以轻松描述的形式。 就是说,LIME不能替代您作为数据科学家的工作,但是它是添加到工具箱中的另一种工具。
To implement LIME in python, I use this LIME library written / released by one of the authors the above paper.
为了在python中实现LIME,我使用了由上述作者之一编写/发布的LIME库 。
I thought it might be good to provide a quick run-through of how to use this library. For this post, I’m going to mimic “Using lime for regression” notebook the authors provide, but I’m going to provide a little more explanation.
我认为最好快速介绍一下如何使用此库。 对于这篇文章,我将模仿作者提供的“ 使用石灰进行回归 ”笔记本,但我将提供更多解释。
The full notebook is available in my repo here.
完整的笔记本可以在我的仓库中找到 。
不可解释的本地不可解释模型(LIME)入门 (Getting started with Local Interpretable Model-agnostic Explanations (LIME))
Before you get started, you’ll need to install Lime.
在开始之前,您需要安装Lime。
pip install lime
Next, let’s import our required libraries.
接下来,让我们导入所需的库。
from sklearn.datasets import load_boston
import sklearn.ensemble
import numpy as np
from sklearn.model_selection import train_test_split
import lime
import lime.lime_tabular
Let’s load the sklearn dataset called ‘boston’. This data is a dataset that contains house prices that is often used for machine learning regression examples.
让我们加载名为“波士顿”的sklearn数据集。 该数据是包含房价的数据集,通常用于机器学习回归示例。
boston = load_boston()
Before we do much else, let’s take a look at the description of the dataset to get familiar with it. You can do this by running the following command:
在做很多其他事情之前,让我们看一下数据集的描述以熟悉它。 您可以通过运行以下命令来执行此操作:
print boston['DESCR']
The output is:
输出为:
Boston House Prices dataset
===========================
Notes
------
Data Set Characteristics:
:Number of Instances: 506
:Number of Attributes: 13 numeric/categorical predictive
:Median Value (attribute 14) is usually the target
:Attribute Information (in order):
- CRIM     per capita crime rate by town
- ZN       proportion of residential land zoned for lots over 25,000 sq.ft.
- INDUS    proportion of non-retail business acres per town
- CHAS     Charles River dummy variable (= 1 if tract bounds river; 0 otherwise)
- NOX      nitric oxides concentration (parts per 10 million)
- RM       average number of rooms per dwelling
- AGE      proportion of owner-occupied units built prior to 1940
- DIS      weighted distances to five Boston employment centres
- RAD      index of accessibility to radial highways
- TAX      full-value property-tax rate per $10,000
- PTRATIO  pupil-teacher ratio by town
- B        1000(Bk - 0.63)^2 where Bk is the proportion of blacks by town
- LSTAT    % lower status of the population
- MEDV     Median value of owner-occupied homes in $1000's
:Missing Attribute Values: None
:Creator: Harrison, D. and Rubinfeld, D.L.
This is a copy of UCI ML housing dataset.
http://archive.ics.uci.edu/ml/datasets/Housing
This dataset was taken from the StatLib library which is maintained at Carnegie Mellon University.
The Boston house-price data of Harrison, D. and Rubinfeld, D.L. 'Hedonic
prices and the demand for clean air', J. Environ. Economics & Management,
vol.5, 81-102, 1978.   Used in Belsley, Kuh & Welsch, 'Regression diagnostics
...', Wiley, 1980.   N.B. Various transformations are used in the table on
pages 244-261 of the latter.
The Boston house-price data has been used in many machine learning papers that address regression
problems.
**References**
- Belsley, Kuh & Welsch, 'Regression diagnostics: Identifying Influential Data and Sources of Collinearity', Wiley, 1980. 244-261.
- Quinlan,R. (1993). Combining Instance-Based and Model-Based Learning. In Proceedings on the Tenth International
Conference of Machine Learning, 236-243, University of Massachusetts, Amherst. Morgan Kaufmann.
- many more! (see http://archive.ics.uci.edu/ml/datasets/Housing)
Now that we have our data loaded, we want to build a regression model to forecast boston housing prices. We’ll use random forest for this to follow the example by the authors.
现在,我们已经加载了数据,我们想建立一个回归模型来预测波士顿的房价。 我们将使用随机森林来遵循作者的示例。
First, we’ll set up the RF Model and then create our training and test data using the train_test_split module from sklearn. Then, we’ll fit the data.
首先,我们将建立RF模型,然后使用sklearn的train_test_split模块创建训练和测试数据。 然后,我们将拟合数据。
rf = sklearn.ensemble.RandomForestRegressor(n_estimators=1000)
train, test, labels_train, labels_test = train_test_split(boston.data, boston.target, train_size=0.80)
rf.fit(train, labels_train)
Now that we have a Random Forest Regressor trained, we can check some of the accuracy measures.
现在我们已经训练了随机森林回归器,我们可以检查一些准确性度量。
print('Random Forest MSError', np.mean((rf.predict(test) - labels_test) ** 2))
Tbe MSError is: 10.45. Now, let’s look at the MSError when predicting the mean.
Tbe MSError是:10.45。 现在,让我们看看预测均值时的MSError。
print('MSError when predicting the mean', np.mean((labels_train.mean() - labels_test) ** 2))
From this, we get 80.09.
由此得出80.09。
Without really knowing the dataset, its hard to say whether they are good or bad. Since we are really most interested in looking at the LIME approach, we’ll move along and assume these are decent errors.
在不真正了解数据集的情况下,很难说出它们是好是坏。 由于我们真的对研究LIME方法最感兴趣,因此我们将继续研究并假设这些都是不错的错误。
To implement LIME, we need to get the categorical features from our data and then build an ‘explainer’. This is done with the following commands:
为了实现LIME,我们需要从数据中获取分类特征,然后构建一个“解释器”。 这可以通过以下命令完成:
categorical_features = np.argwhere(
np.array([len(set(boston.data[:,x]))
for x in range(boston.data.shape[1])]) <= 10).flatten()
and the explainer:
和解释器:
explainer = lime.lime_tabular.LimeTabularExplainer(train,
feature_names=boston.feature_names,
class_names=['price'],
categorical_features=categorical_features,
verbose=True, mode='regression')
Now, we can grab one of our test values and check out our prediction(s). Here, we’ll grab the 100th test value and check the prediction and see what the explainer has to say about it.
现在,我们可以获取我们的测试值之一,并查看我们的预测。 在这里,我们将获取第100个测试值并检查预测,然后看看解释者对此有何评论。
i = 100
exp = explainer.explain_instance(test[i], rf.predict, num_features=5)
exp.show_in_notebook(show_table=True)
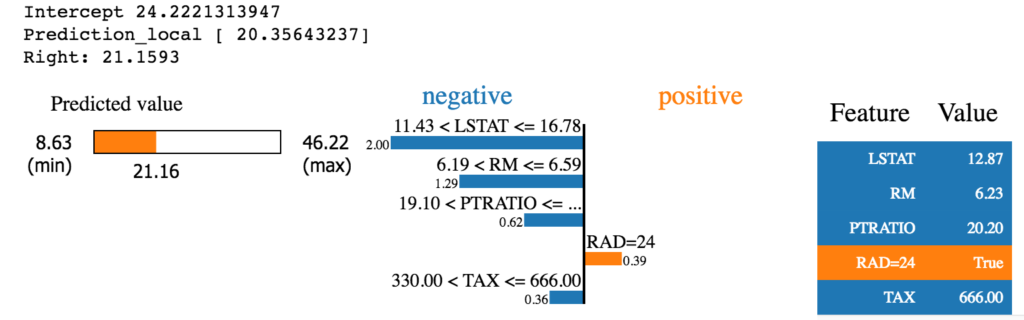
So…what does this tell us?
那么……这告诉我们什么?
It tells us that the 100th test value’s prediction is 21.16 with the “RAD=24” value providing the most positive valuation and the other features providing negative valuation in the prediction.
它告诉我们,第100个测试值的预测为21.16,其中“ RAD = 24”值提供了最大的肯定估值,而其他功能则提供了负的估值。
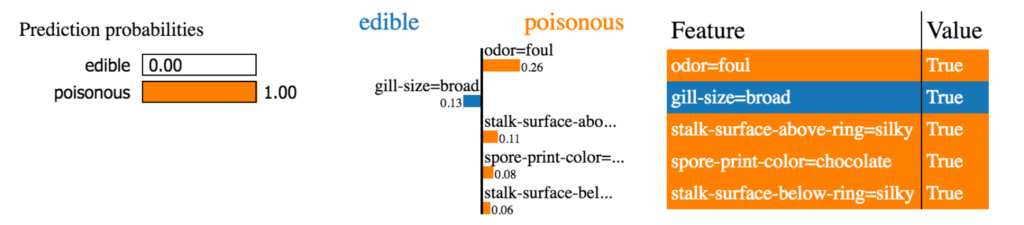
For regression, this isn’t quite as interesting (although it is useful). The LIME approach shows much more benefit (at least to me) when performing classification.
对于回归,这不是那么有趣(尽管很有用)。 LIME方法在执行分类时显示出更多的好处(至少对我而言)。
As an example, if you are trying to classify plans as edible or poisonous, LIME’s explanation is much more useful. Here’s an example from the authors.
例如,如果您试图将计划分类为可食用或有毒,则LIME的解释会更加有用。 这是作者的一个例子。
Take a look at LIME when you have some time. Its a good library to add to your toolkit, especially if you are doing a lot of classification work. It makes it much easier to ‘explain’ what the model is doing.
有空的时候看看LIME。 它是一个很好的库,可以添加到您的工具箱中,尤其是在您进行大量分类工作时。 它使“解释”模型的工作变得更加容易。
Eric D. Brown , D.Sc. has a doctorate in Information Systems with a specialization in Data Sciences, Decision Support and Knowledge Management. He writes about utilizing python for data analytics at pythondata.com and the crossroads of technology and strategy at ericbrown.com
埃里克·布朗(Eric D.Brown) 拥有信息系统博士学位,专门研究数据科学,决策支持和知识管理。 他写了关于利用数据分析Python在pythondata.com技术和战略的十字路口在ericbrown.com
翻译自: https://www.pybloggers.com/2018/01/local-interpretable-model-agnostic-explanations-lime-in-python/
python lime
python lime_本地可解释模型不可知的解释– LIME in Python相关推荐
- 【机器学习】树模型决策的可解释性与微调(Python)
一.树模型的解释性 集成学习树模型因为其强大的非线性能力及解释性,在表格类数据挖掘等任务中应用频繁且表现优异. 模型解释性对于某些领域(如金融风控)是极为看重的,对于树模型的解释性,我们常常可以通过输 ...
- python金融风控评分卡模型和数据分析
python金融风控评分卡模型和数据分析微专业课(博主录制):http://dwz.date/b9vv 作者Toby:持牌照消费金融模型专家,和中科院,中科大教授保持长期项目合作:和同盾,聚信立等外部 ...
- python金融风控评分卡模型
python金融风控评分卡模型和数据分析微专业课(博主录制): [ http://dwz.date/b9vv ](https://study.163.com/series/1202875601.htm ...
- python代码库-吐血整理!绝不能错过的24个Python库
Python有以下三个特点: 易用性和灵活性 全行业高接受度:Python无疑是业界最流行的数据科学语言 用于数据科学的Python库的数量优势 事实上,由于Python库种类很多,要跟上其发展速度非 ...
- 因果解释能够对规则进行解释吗?
来源:<哲学动态>2017年第10期 作者:初维峰(西安交通大学人文社会科学学院) 本文受中国博士后科学基金面上资助项目"当代西方因果解释理论研究"(2017M6131 ...
- 小样本学习记录————用于深度网络快速适应的模型不可知元学习(MAML)
小样本学习记录----MAML用于深度网络快速适应的模型不可知元学习 相关概念 小样本学习(Few-Shot Learning) 元学习(Meta-Learning) MAML思想 MAML算法 论文 ...
- Paper:《A Unified Approach to Interpreting Model Predictions—解释模型预测的统一方法》论文解读与翻译
Paper:<A Unified Approach to Interpreting Model Predictions-解释模型预测的统一方法>论文解读与翻译 导读:2017年11月25 ...
- mvc 视图和模型的对应_通过在酒吧订购饮料来解释模型视图控制器(MVC)
mvc 视图和模型的对应 by Kevin Kononenko 凯文·科诺年科(Kevin Kononenko) 通过在酒吧订购饮料来解释模型视图控制器(MVC) (Model-View-Contro ...
- 李宏毅的可解释模型——三个任务
1.问题 观看了李宏毅老师的机器学习进化课程之可解释的机器学习,课程中对主要是针对黑盒模型进行白盒模型转化的技巧和方法进行了简单介绍,详细细节可以参考<Interpretable Machine ...
- 手把手教程:用Python开发一个自然语言处理模型,并用Flask进行部署
截住到目前为止,我们已经开发了许多机器学习模型,对测试数据进行了数值预测,并测试了结果.实际上,生成预测只是机器学习项目的一部分,尽管它是我认为最重要的部分.今天我们来创建一个用于文档分类.垃圾过滤的 ...
最新文章
- kafka异步推送设置重试_一篇文章了解 Kafka 幂等性的原理及实践
- python opencv创建图像_使用Python中OpenCV库创建一幅图片的RGB通道图片
- Science:人工智能的发展离不开神经科学,先天结构或是下一个方向
- 【Vegas原创】导出Excel时,如何将数字格式转为文本格式?(07.12.13 Update)
- 基于spring cloud 的灰度发布实践_【收藏】基于spring cloud灰度发版方案
- 从零开始构建HTML 5 Web页面
- Android 8.0 学习(3)---Android Treble
- OpenSSH升级-无需替换旧版本文件
- 快速计算代码行小工具
- 计算机桌面提示区,win7如何把电脑桌面分成四个区域?电脑分区域显示方法
- 大华相机SDK调用——主动采图、外触发、参数
- 【uniapp小程序】—— APP项目云打包(安卓)
- 第17章 其他数据库日志【4.日志与备份篇】【MySQL高级】
- Android P Asan使用总结
- iOS8 苹果自带的毛玻璃效果
- 设计模式(四)注册模式 解决:解决全局共享和交换对象
- 运行Django项目报错解决,OSError: [WinError 123] 文件名、目录名或卷标语法不正确。
- c++system函数
- B.FRIENDit壁虎忍者GC03电竞椅,坐的舒服才能心无旁骛!
- socket.io搭建聊天室
热门文章
- 高职高考数学可以用计算机吗,高职高考数学的考察范围有哪些,有没有什么解题技巧?...
- 学计算机i58300够用嘛,酷睿i58300h处理器怎么样
- Spring boot 搭建个人博客系统(六)——文章点击量和阅读排行榜
- android rn热更新闪退,react-native 导致热更新失败的问题之一
- qq邮箱发件转发php,phpmailer 利用qq邮箱转发邮件的问题
- vue 手机h5动态银行支付密码键盘前端
- 路由器虚拟服务器 数量,tp-link1660+路由器端口映射的数量有多少
- android 开机自动启动服务,Android实现开机自动启动Service或app的方法
- angularjs pdf插件_AngularJS实战 PDF 下载
- mysql001课程成绩002,6、MySQL测试题