SQL Server数据库指标
摘要 (Summary)
There is a multitude of database metrics that we can collect and use to help us understand database and server resource consumption, as well as overall usage.
我们可以收集和使用大量数据库指标,以帮助我们了解数据库和服务器资源的消耗以及总体使用情况。
This data can include hardware statistics, such as measures of CPU or memory consumed over time. We can also examine database metadata, including row counts, waits, and deadlocks.
此数据可以包括硬件统计信息,例如随着时间推移消耗的CPU或内存的度量。 我们还可以检查数据库元数据,包括行数,等待和死锁。
At face value, this information can be useful in capacity planning and alerting when a server is low on resources. Our goal in this article an in Using Database Metrics to Predict Application Problems article will be to collect a handful of useful database metrics and then demonstrate how we can use them to benefit app development, troubleshooting, and bug hunting!
从表面上看,此信息可用于容量规划和服务器资源不足时发出警报。 本文和使用数据库度量标准来预测应用程序问题中的目标是收集一些有用的数据库度量标准,然后演示如何使用它们来使应用程序开发,故障排除和错误查找受益!
我们监视哪些数据库指标? (What Database Metrics Do We Monitor?)
There is a multitude of database metrics we can monitor that will provide insight into how our server and data are being managed. Some are more useful than others and for different applications, some metrics may be more applicable than others.
我们可以监视许多数据库指标,这些指标可以深入了解如何管理服务器和数据。 有些指标比其他指标有用,并且对于不同的应用程序,某些指标可能比其他指标更适用。
行数 (Row Counts)
For any data-driven application, row counts are likely one of the easiest and most effective database metrics to follow. They provide direct insight into the volume of data associated with an entity and can easily be trended over time.
对于任何数据驱动的应用程序,行计数可能是遵循的最简单,最有效的数据库指标之一。 它们提供对与实体相关联的数据量的直接洞察力,并且可以很容易地随时间变化。
For example, consider a table that tracks sales metrics where we typically see about 10k rows per day (each of which corresponds to a specific product sale). If we happen to notice one day that there are only 100 new rows in the table, or perhaps 10 million, we would have cause to investigate. Maybe it’s possible that a holiday or major data import project occurred, but excluding those special circumstances, we would move forward under the assumption that something is wrong and requires our attention.
例如,考虑一个跟踪销售指标的表,我们通常每天大约看到1万行(每行对应一个特定的产品销售)。 如果有一天我们注意到表中只有100个新行,或者可能有一千万行,那么我们就有理由进行调查。 也许有可能发生了假期或主要数据导入项目,但不包括那些特殊情况,我们将在出现问题并需要我们注意的前提下继续前进。
In general, we can quantify a liberal range of values as to what normal and abnormal are. If determining absolute row counts is challenging, we can operate on percentages and say that any data growth over or under a range of percentages is abnormal. We can also choose to do both and cover both scenarios: High/low point-in-time data creation and high/low rates of increase over time.
通常,我们可以量化关于正常值和异常值的自由范围。 如果确定绝对行数具有挑战性,我们可以对百分比进行操作,并说任何超过或低于一定百分比范围的数据增长都是异常的。 我们还可以选择同时做这两种情况,并涵盖两种情况:高/低时间点数据创建和高/低时间增长率。
Row counts only help us track insertions and deletions, though, and do not provide insight into updates or reads. If there is a process that is updating far more rows than necessary, then row counts will do little to help, unless we happen to audit these operations. Similarly, an app that is reading data inefficiently will not impact row counts via excessive SELECT statements.
但是,行数仅帮助我们跟踪插入和删除,而不能提供对更新或读取的深入了解。 如果有一个过程正在更新比必要多得多的行,那么除非我们碰巧审核了这些操作,否则行数将无济于事。 同样,读取效率低下的应用程序也不会通过过多的SELECT语句影响行数。
数据库文件IO (Database File IO)
Measuring IO metrics against database files provides a unique insight into how much data is being written and read by any given data file. This allows us to separate between activity against data and log files, as well as between different data files in a database that happens to have multiple data files.
针对数据库文件衡量IO指标,可以使您对任何给定数据文件正在写入和读取多少数据有独到的见解。 这使我们可以将活动与数据和日志文件分开,也可以在数据库中碰巧具有多个数据文件的不同数据文件之间分开。
This metric can help us pinpoint the general problem, though it will not tell us a specific table or code to investigate. This is still beneficial, though, as we can greatly narrow down a problem over time. In addition, this can help us measure overall database disk activity and trend it over time. By knowing these numbers, we can predict future data throughput and ensure that our hardware, storage, and network infrastructure can handle it in the future as the application grows.
尽管该度量标准不会告诉我们要研究的特定表或代码,但它可以帮助我们查明普遍存在的问题。 但是,这仍然是有益的,因为随着时间的推移,我们可以大大缩小问题的范围。 此外,这可以帮助我们衡量数据库磁盘的总体活动并随时间变化趋势。 通过了解这些数字,我们可以预测将来的数据吞吐量,并确保我们的硬件,存储和网络基础架构可以在将来随着应用程序的增长而处理。
事务日志备份大小 (Transaction Log Backup Size)
We can also measure database change over time via the transaction logs. For any database in the FULL (or bulk-logged) recovery mode, all logged changes will result in log growth that is roughly proportional to the amount of change incurred.
我们还可以通过事务日志来衡量数据库随时间的变化。 对于处于完全(或批量记录)恢复模式的任何数据库,所有记录的更改将导致日志增长,该增长与发生的更改量大致成比例。
If a database has log backup files taken hourly that are roughly 1GB in size, then we know that a transaction log backup size of 1TB would be anomalous and worth investigating.
如果数据库每小时收集一次大约1GB的日志备份文件,那么我们知道1TB的事务日志备份大小是异常的,值得研究。
This provides us another monitoring angle as we can analyze database metrics about database backups either via SQL Server metadata or via the files on disk. If transaction log backups are unusually high or low, then we know that database write activity is unusually high or low. This may correspond to a planned maintenance event and be expected, but it may also be the result of a runaway process, broken component, or some other problem that needs investigation.
这为我们提供了另一个监视角度,因为我们可以通过SQL Server元数据或磁盘上的文件来分析有关数据库备份的数据库指标。 如果事务日志备份异常高或异常低,那么我们知道数据库写入活动异常高或异常低。 这可能与计划的维护事件相对应并且是预期的,但也可能是过程失控,组件损坏或需要调查的其他问题的结果。
阻止/等待 (Blocking/Waits)
When queries take a long time to execute, either because they are slow or because they are waiting for other processes to complete, we may identify an app problem that requires attention.
当查询需要很长时间才能执行时,要么是因为查询速度慢,要么是因为它们正在等待其他进程完成,因此我们可能会发现需要注意的应用程序问题。
Waits can be easily snapshotted and monitored at any point in time and repeated regularly. We can then look for long-running waits that exceed what we believe to be normal or crunch our data to trend over time any processes that get significantly slower and require attention.
可以在任何时间点轻松地对快照进行快照和监视,并定期重复。 然后,我们可以寻找长时间运行的等待时间,这些等待时间会超过我们认为正常的等待时间,或者处理数据,以便随着时间的流逝而趋于缓慢,并需要注意。
Alternatively, wait stats can provide a useful research mechanism when an issue is identified via other means and further investigation is required. Wait stats can be associated with SPID, query text, execution plan XML, and more, allowing us to collect quite a bit of detail on what became slow and why.
另外,当通过其他方式发现问题并需要进一步调查时,等待统计信息可以提供有用的研究机制。 等待统计信息可以与SPID,查询文本,执行计划XML等相关联,从而使我们可以收集有关变慢的原因及其原因的详细信息。
跟踪数据库指标 (Tracking Database Metrics)
The remainder of this article will focus on details: How do we collect and track these metrics? The goal will be to keep the queries simple and applicable to the largest audience possible so that the most value can be gained from them.
本文的其余部分将集中在细节上:我们如何收集和跟踪这些指标? 目的是使查询简单易行,并适用于尽可能多的受众,以便从中获得最大价值。
行数 (Row Counts)
There are multiple ways to collect row counts, and the method you choose should be based on data size and how accurate you need the data to be. The simplest way to get a row count from a table is as follows:
收集行计数有多种方法,您选择的方法应基于数据大小和所需数据的准确性。 从表中获取行计数的最简单方法如下:
SELECTCOUNT(*)
FROM sales.SalesOrderDetail;
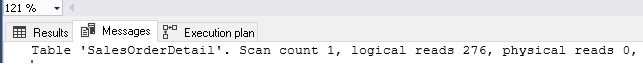
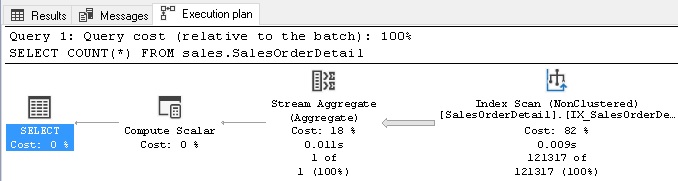
This method is quick & dirty, but requires an index scan of the clustered index to execute. This can be slow and resource-intensive for a large table. While the results are guaranteed to be accurate and return an exact row count, executing a COUNT against a table with millions or billions of rows will be painful and not worth the effort. The following shows the IO stats and execution plan for this operation:
这种方法既快速又肮脏,但是需要对聚集索引进行索引扫描才能执行。 对于大型表,这可能很慢并且占用大量资源。 虽然可以保证结果是准确的并返回准确的行数,但是对具有数百万或数十亿行的表执行COUNT会很痛苦,不值得付出努力。 下面显示了此操作的IO状态和执行计划:
This clearly is not scalable for any large data set and we should steer clear of using COUNT(*) unless we can apply a very limiting WHERE clause against it.
显然,这对于任何大型数据集都是不可扩展的,除非我们可以对其应用非常有限的WHERE子句,否则我们应避免使用COUNT(*)。
Another way to collect row count metrics is to query the view sys.sm_db_partition_stats:
收集行计数指标的另一种方法是查询sys.sm_db_partition_stats视图:
SELECTdm_db_partition_stats.row_count
FROM sys.dm_db_partition_stats
INNER JOIN sys.objects
ON objects.object_id = dm_db_partition_stats.object_id
WHERE objects.is_ms_shipped = 0
AND objects.type_desc = 'USER_TABLE'
AND objects.name = 'SalesOrderDetail'
AND dm_db_partition_stats.index_id IN (0,1);
This is a far more efficient method of collecting row counts. Besides, the view contains a variety of other useful database metrics, such as page counts, reserved vs. used pages, and in-row vs. overflow data. It is critical to note that these data points are approximations based on data in memory from underlying system tables. If you require precise row counts, do not use this view! For our purposes, though, we will often be looking for an order of magnitude of growth. For example, the difference between 1,000,000 rows and 999,975 is trivial for measuring overall growth metrics.
这是一种收集行计数的更有效的方法。 此外,该视图还包含各种其他有用的数据库指标,例如页数,保留页与已用页以及行内数据与溢出数据。 重要的是要注意,这些数据点是基于基础系统表中内存中数据的近似值。 如果您需要精确的行数,请不要使用此视图! 但是,出于我们的目的,我们经常会寻找增长的数量级。 例如,1,000,000行与999,975之间的差异对于衡量总体增长指标而言微不足道。
Here is the IO stats and execution plan for the above query:
以下是上述查询的IO状态和执行计划:
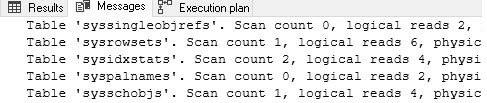
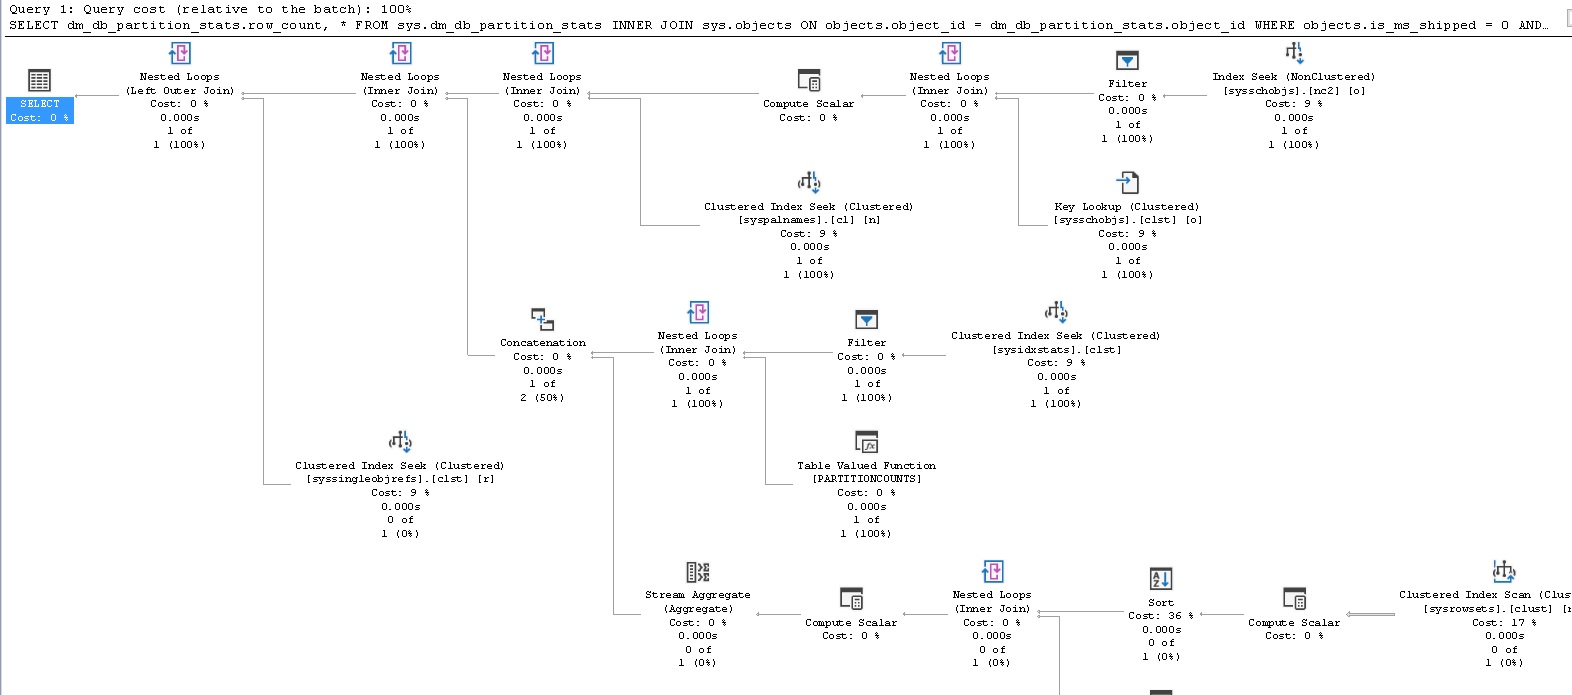
We can see that while the execution plan is far more complex, we need only read smaller system tables to get the data we need. As a result, reads are a fraction of what they were previously. More importantly, as our table grows, performance will not get worse! Using this system view also provides the bonus of being able to quickly save all row counts to a database metrics table directly from this query, without the need to iterate through tables using a loop or dynamic SQL:
我们可以看到,尽管执行计划要复杂得多,但我们只需要读取较小的系统表即可获得所需的数据。 结果,读取只是以前的一小部分。 更重要的是,随着我们表的增长,性能不会变差! 使用该系统视图还可以直接从该查询快速将所有行计数保存到数据库指标表,而无需使用循环或动态SQL遍历表:
SELECTschemas.name AS SchemaName,objects.name AS TableName,CASE WHEN dm_db_partition_stats.index_id = 1 THEN 'Clustered Index' ELSE 'Heap' END AS TableType,dm_db_partition_stats.row_count
FROM sys.dm_db_partition_stats
INNER JOIN sys.objects
ON objects.object_id = dm_db_partition_stats.object_id
INNER JOIN sys.schemas
ON schemas.schema_id = objects.schema_id
WHERE objects.is_ms_shipped = 0
AND objects.type_desc = 'USER_TABLE'
AND dm_db_partition_stats.index_id IN (0,1);
This query returns row counts for all tables in a database, along with the schema name, table name, and whether it is a heap or not.
该查询返回数据库中所有表的行数,以及模式名,表名以及是否为堆。
Another way to get row counts can be to rely on timestamps within the table. If there is a create time or last modified time column that is indexed, we can query against it on a regular basis, getting a count of rows since the last time we checked. This is a great way to get an accurate count without having to read an entire table repeated.
获取行计数的另一种方法可以是依赖表中的时间戳。 如果有索引的创建时间或上次修改时间列,我们可以定期对其进行查询,以获取自上次检查以来的行数。 这是获得准确计数的好方法,而不必重复读取整个表。
The function APPROX_COUNT_DISTINCT can also be a useful tool as it can pull a distinct count of values for a column much faster than COUNT. This function is also an approximation, and is guaranteed to return a count that is at least 97% accurate. We can observe its accuracy by placing it in a query alongside COUNT:
函数APPROX_COUNT_DISTINCT也可以是一个有用的工具,因为它可以比COUNT更快地提取列的不同值计数。 此函数也是一个近似值,可以保证返回至少97%的准确计数。 我们可以通过将其放在与COUNT一起的查询中来观察其准确性:
SELECTCOUNT(DISTINCT SalesOrderDetailID) AS actual_count,APPROX_COUNT_DISTINCT(SalesOrderDetailID) AS approximate_count
FROM sales.salesorderdetail;
The results show counts that are more than close enough for our purposes:
结果显示,计数对于我们的目的而言足够接近:
Lastly, if a table has any sort of auditing, tracking, or logging against it, then we can interrogate the log for details, rather than the table itself. If you are already going to the trouble of auditing a table’s activity, then there is no downside to leveraging that data for our own metrics-gathering purposes.
最后,如果表具有任何形式的审核,跟踪或日志记录,那么我们可以查询日志以获取详细信息,而不是表本身。 如果您已经麻烦审核表的活动,那么利用该数据进行我们自己的指标收集就没有任何不利之处。
Once we have row counts collected and available over a period of time, we can compare past values to present values and measure metrics of note, such as:
在一段时间内收集并可用的行计数之后,我们可以将过去的值与当前的值进行比较,并衡量笔记的度量标准,例如:
- Has a table grown by more than 10% in the past N days? 在过去的N天中,桌子的增长率是否超过10%?
- Has a table grown by more than 2% for more than N days straight? 桌子连续N天增长了2%以上吗?
- Has a table not grown at all in more than N days? 桌子超过N天根本没有长出来吗?
- Has a table shrunk by more than 10%? 桌子缩水了10%以上吗?
- Is a table’s row count approaching the maximum allowed by its primary key data type? 表的行数是否接近其主键数据类型所允许的最大值?
These and many more questions can be answered by collecting row count metrics and then automating a script against them daily that inspects recent data for any changes that are significant enough to alert on.
通过收集行计数指标,然后每天针对它们进行自动化脚本,可以回答这些问题以及更多问题,该脚本检查最近的数据以查找足以引起警告的任何更改。
数据库文件IO (Database File IO)
Knowing how much data is being written to each database file can help isolate and quantify the overall database write activity. It can also be used to pinpoint a specific database or file where the activity is significantly higher than normal.
知道要向每个数据库文件写入多少数据可以帮助隔离和量化整个数据库的写入活动。 它也可以用于查明活动明显高于正常水平的特定数据库或文件。
File IO is tracked in the dynamic management view sys.dm_io_virtual_file_stats. This handy view provides database metrics for the number of reads and writes against a database file, as well as a variety of other useful details. One important note: This view is reset when SQL Server restarts! As a result, this data must be captured regularly and saved in order for it to be meaningful. Collecting this data hourly is a typical application of it, though more or less frequent polling may be desirable in different applications. All database metrics stored in this view are cumulative and tell us the total reads or total writes since the SQL Server service last started.
在动态管理视图sys.dm_io_virtual_file_stats中跟踪文件IO。 这个方便的视图提供了针对数据库文件的读写次数的数据库指标,以及各种其他有用的细节。 重要说明:SQL Server重新启动时将重置此视图! 因此,必须定期捕获并保存此数据,以使其有意义。 每小时收集一次此数据是它的典型应用,尽管在不同应用中可能需要或多或少的频繁轮询。 此视图中存储的所有数据库指标都是累积的,可告诉我们自上次启动SQL Server服务以来的总读取次数或总写入次数。
To gather this data, we can query the view and join it to sys.master_files, which provides details about the file itself, and sys.databases to get the name of the database that the file belongs to.
要收集此数据,我们可以查询视图并将其加入sys.master_files ,该文件提供有关文件本身以及sys.databases的详细信息,以获取文件所属数据库的名称。
SELECTdatabases.name AS DatabaseName,master_files.name AS DatabaseFileName,master_files.type_desc AS FileType,master_files.physical_name,dm_io_virtual_file_stats.num_of_reads,dm_io_virtual_file_stats.num_of_bytes_read,dm_io_virtual_file_stats.num_of_writes,dm_io_virtual_file_stats.num_of_bytes_written,dm_io_virtual_file_stats.size_on_disk_bytes
FROM sys.master_files
INNER JOIN sys.dm_io_virtual_file_stats(NULL, NULL)
ON master_files.database_id = dm_io_virtual_file_stats.database_id
INNER JOIN sys.databases
ON databases.database_id = master_files.database_id
AND master_files.file_id = dm_io_virtual_file_stats.file_id;
The results of this query are as follows:
该查询的结果如下:
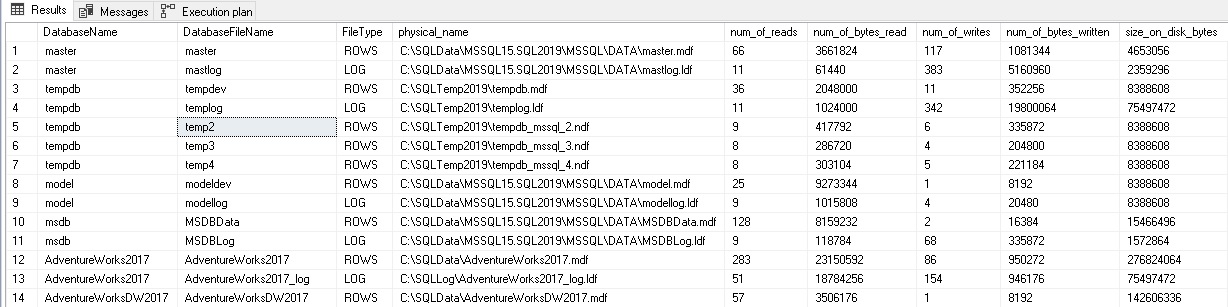
This tells us the database, file, and how much data has been written and read against each file. If we run the query again, the numbers will have increased by however much additional IO activity has taken place since our initial run:
这将告诉我们数据库,文件以及已针对每个文件写入和读取了多少数据。 如果我们再次运行查询,则自首次运行以来,这些数字将会增加,但是发生了很多额外的IO活动:
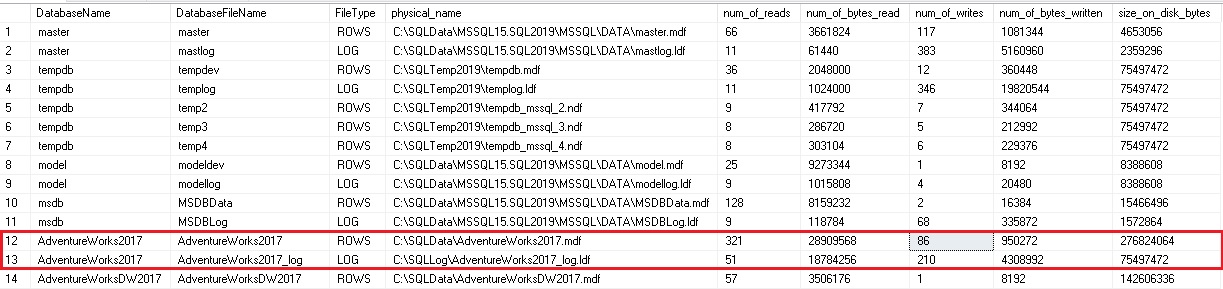
Note that numbers have gone up in AdventureWorks2017, as well as the master database. Since this query pulls data for all databases and files on a SQL Server, we can collect it quite quickly and easily, with little impact on the server via this operation.
请注意,AdventureWorks2017和主数据库中的数字都有所增加。 由于此查询提取SQL Server上所有数据库和文件的数据,因此我们可以非常快速,轻松地收集数据,而通过此操作对服务器的影响很小。
Once we have IO file stats, we can answer questions like these:
获得IO文件状态后,我们可以回答以下问题:
- Are there more reads or writes against a database than we would expect? 是否有比我们预期更多的对数据库的读写?
- Are the reads or writes significantly high for a file given its size? 在给定文件大小的情况下,文件的读写量是否很高?
- Have reads or writes increased dramatically over time? 随着时间的流逝,读写次数是否急剧增加?
- Are reads or writes far higher at a specific time of the day? If so, can we correlate those database metrics to a job, app, or process that may be causing it? 在一天中的特定时间,读写次数是否更高? 如果是这样,我们可以将那些数据库指标与可能导致该指标的作业,应用程序或流程相关联吗?
- Is the total IO approaching the limits of the storage system? 总IO是否已接近存储系统的极限?
These questions (and more) allow us to get ahead of potential IO-related problems, isolate them, and investigate further. We can determine what database or file is overconsuming storage bandwidth and use the timing of the data to track down what process is responsible for excessive resource consumption. Similarly, excessively low usage can also be indicative of an application problem where actions are not taking place, but should be.
这些问题(以及更多问题)使我们能够提前解决与IO相关的潜在问题,将其隔离出来,并进行进一步调查。 我们可以确定哪个数据库或文件正在占用过多的存储带宽,并使用数据的时间来跟踪哪个进程导致了过多的资源消耗。 同样,使用率过低也可能表示应用程序问题,在该问题中没有发生动作,但应该采取行动。
事务日志备份大小 (Transaction Log Backup Size)
Whenever a write operation completes, the details of that operation are logged by the transaction log. Checkpoints are issued periodically that commit that data to the physical transaction log from memory. When a transaction log backup is taken, all data in the transaction log will be committed to the database files and all transactions prior to the backup removed from the log.
只要写操作完成,该操作的详细信息就会由事务日志记录。 定期发出检查点,这些检查点将这些数据从内存中提交到物理事务日志。 进行事务日志备份时,事务日志中的所有数据都将提交到数据库文件,并且备份中的所有事务将从日志中删除。
The result of this process is that the transaction log backups will be sized to roughly reflect the amount of database activity that generated them. A small transaction log backup is indicative of less database activity than a large backup. There are a variety of outliers and exceptions to this guideline, such as minimally logged transactions, but those exceptions have little bearing on our conversation here.
此过程的结果是,将调整事务日志备份的大小以大致反映生成它们的数据库活动的数量。 小型事务日志备份表示数据库活动少于大型备份。 该指南存在许多异常情况和例外情况,例如最少记录的交易,但这些例外情况与我们在此处的讨论关系不大。
We have two options available for measuring transaction log backup sizes:
我们有两个选项可用于测量事务日志备份大小:
- Track backup sizes using Powershell or tool/service that collects and records file sizes 使用Powershell或收集/记录文件大小的工具/服务跟踪备份大小
- Use data in MSDB to track backup file sizes 使用MSDB中的数据来跟踪备份文件的大小
For our purposes, the second option is more convenient as it uses built-in SQL Server features and is therefore readily accessible and free. It is limited by our retention policy for MSDB backup data. A SQL server should always have a retention policy that cleans up data older than N days from MSDB’s logs to ensure that the database does not get bloated over time. That being said, it’s unlikely that a server will retain less than a day of data. We can pull this backup history data and join it to some of the data we have already worked with to paint a clear picture of backup activity:
出于我们的目的,第二个选项更方便,因为它使用内置SQL Server功能,因此易于访问且免费。 它受我们对MSDB备份数据的保留策略的限制。 SQL Server应该始终具有保留策略,该策略会从MSDB的日志中清除早于N天的数据,以确保数据库不会随着时间的流逝而膨胀。 话虽如此,一台服务器保留不到一天的数据的可能性很小。 我们可以提取此备份历史记录数据并将其加入我们已经使用过的一些数据中,以清晰地描绘备份活动:
SELECTbackupset.database_name,CAST(8.0 * master_files.size/1024.0 AS DECIMAL(18, 0)) AS database_file_size_in_MB,CAST(backupset.backup_size/1024.0/1024.0 AS DECIMAL(18, 2)) AS BackupSizeMB,CAST(backupset.compressed_backup_size/1024.0/1024.0 AS DECIMAL(18, 2)) AS CompressedSizeMB,backupset.backup_start_date AS BackupStartDate,backupset.backup_finish_date AS BackupEndDate,CAST(backupset.backup_finish_date - backupset.backup_start_date AS TIME) AS AmtTimeToBkup,backupmediafamily.physical_device_name AS BackupDeviceName
FROM msdb.dbo.backupset
INNER JOIN msdb.dbo.backupmediafamily
ON backupset.media_set_id = backupmediafamily.media_set_id
INNER JOIN sys.databases
ON databases.name = backupset.database_name
INNER JOIN sys.master_files
ON master_files.database_id = databases.database_id
AND master_files.type_desc = 'ROWS'
WHERE backupset.type = 'L';
On my local server, this query returns 3 results, indicating that 3 transaction log backups have been taken since the last MSDB cleanup occurred:
在我的本地服务器上,此查询返回3个结果,表明自上一次MSDB清除以来已进行了3个事务日志备份:
By adding in the database size, we can better measure how large or small the transaction log backup really is. If we save and trend this data over time, then we can better understand how backup sizes change as app activity varies. In the example data above, none of the backups appear to be too large. If a transaction log backup for AdventureWorksDW2017 was 5GB, though, I’d be concerned as this is almost 5000 times larger than the database itself. For a log backup to be so large would indicate significantly more data changed than exists in the database. This can be true if the database contains a significant amount of rolling log data, but for most standard OLTP/OLAP tables, a log backup that is that much larger than the data would be unusual.
通过增加数据库大小,我们可以更好地衡量事务日志备份的实际大小。 如果我们随时间保存并趋势化这些数据,那么我们可以更好地了解备份大小如何随应用程序活动的变化而变化。 在上面的示例数据中,没有一个备份看起来太大。 但是,如果AdventureWorksDW2017的事务日志备份为5GB,我会担心,因为这比数据库本身大了将近5000倍。 如果日志备份太大,则表明更改的数据多于数据库中存在的数据。 如果数据库包含大量的滚动日志数据,则可能是这样,但是对于大多数标准OLTP / OLAP表而言,比数据大得多的日志备份将是不寻常的。
The analytics that we can run based on transaction log backup sizes are similar to, and help justify what we see in IO file stats data. If writes are high and the transaction log increased significantly in size during a given time, then we have a good reason to dig further and find out what is causing so much IO, and is it normal?
我们可以基于事务日志备份大小运行的分析类似于,并有助于证明我们在IO文件统计数据中看到的内容是合理的。 如果写入量很高,并且在给定时间内事务日志的大小显着增加,那么我们有充分的理由进一步挖掘并找出造成如此多IO的原因,这是否正常?
One example of a common cause of this can be no-op churn. An app regularly updates data when changes are detected by a stored procedure or process, but accidentally always updates the data, regardless of whether a change has occurred or not. Updating a column and setting it equal to its existing value will result in transaction log growth, as odd as it may sound. This is important as a no-op update is still a transaction and its execution needs to be recorded in the transaction log for completeness’ sake, even if the resulting data is the same as its initial values.
造成这种情况的常见原因之一就是无人搅动。 当存储过程或过程检测到更改时,应用程序会定期更新数据,但意外地总是更新数据,无论是否发生更改。 更新列并将其设置为等于其现有值将导致事务日志增长,听起来可能很奇怪。 这很重要,因为无操作更新仍然是事务,并且出于完整性考虑,即使执行结果也必须与其初始值相同,也需要将其执行记录在事务日志中。
Saving and monitoring transaction log backup sizes can help catch app issues that stem from writing too much data, whether it be because of flawed code or inefficient TSQL.
保存和监视事务日志备份大小可以帮助捕获由于写入过多数据而导致的应用程序问题,无论是由于代码有缺陷还是TSQL效率低下。
阻止/等待 (Blocking/Waits)
Additional database metrics that can be especially helpful when researching performance or app problems are blocking and waits. Knowing when queries are running slow or have become slower with time is a great way to locate with a high level of certainty the TSQL that may be responsible for any number of performance or app-related problems. Many tools also do this work, as well. If you happen to use a third-party tool to track waits, blocking, and other poorly performing queries, then you need only attach monitoring to that tool and you are done! The following query will return all waits on a SQL Server, with the only filter to remove system processes from the results:
在研究性能或应用程序问题阻塞和等待时,其他数据库指标可能特别有用。 知道查询何时运行缓慢或随着时间的推移变得越来越慢,这是一种高度确定性地定位可能会导致许多性能或与应用程序相关的问题的TSQL的好方法。 许多工具也可以完成这项工作。 如果您恰巧使用第三方工具来跟踪等待,阻塞和其他性能不佳的查询,那么您只需将监视附加到该工具即可完成! 以下查询将返回SQL Server上的所有等待,并使用唯一的过滤器从结果中删除系统进程:
SELECT@@SERVERNAME AS server_name,GETDATE() AS local_time,dm_exec_requests.session_id,dm_exec_requests.blocking_session_id,databases.name AS database_name,dm_exec_requests.wait_time,dm_exec_requests.wait_resource,dm_exec_requests.wait_type,dm_exec_sessions.host_name,dm_exec_sessions.program_name,dm_exec_sessions.login_name,dm_exec_requests.command,CASEWHEN dm_exec_sql_text.text LIKE '%CREATE PROCEDURE%'THEN '/* PROC: */ ' + SUBSTRING(dm_exec_sql_text.text, CHARINDEX('CREATE PROCEDURE ', dm_exec_sql_text.text) + 17, 60) + ' ... 'ELSE SUBSTRING(dm_exec_sql_text.text, 1, 60) + ' ...'END AS Begin_SQL,CASEWHEN dm_exec_sql_text.text LIKE '%CREATE PROCEDURE%' THEN '/* PROC - SEE SOURCE CODE */'ELSE RTRIM(dm_exec_sql_text.text)END AS Script_Text,SUBSTRING(dm_exec_sql_text.text, (dm_exec_requests.statement_start_offset/2) + 1,((CASE dm_exec_requests.statement_end_offset WHEN -1 THEN DATALENGTH(dm_exec_sql_text.text) ELSE dm_exec_requests.statement_end_offsetEND - dm_exec_requests.statement_start_offset)/2) + 1) AS Wait_SQL,CONVERT(VARCHAR(MAX), Query_Hash, 1) AS Query_Hash,CASE WHEN dm_exec_sql_text.text IS NULL THEN NULL ELSE CHECKSUM(dm_exec_sql_text.text) END AS Checksum_Text_Hash
FROM master.sys.dm_exec_requests
INNER JOIN master.sys.dm_exec_sessions
ON dm_exec_requests.session_id = dm_exec_sessions.session_id
OUTER APPLY master.sys.dm_exec_sql_text(dm_exec_requests.sql_handle)
INNER JOIN sys.databases
ON databases.database_id = dm_exec_requests.database_id
WHERE dm_exec_sessions.is_user_process = 1 -- Only check user processes
This query essentially pulls and organizes data on all current requests, joining them to their originating sessions, the SQL text for the request, and the databases the query is running against. For my local server, I can observe two rows in the result set. One is my current session and the other some queries I am executing against my baseball stats database:
该查询从本质上拉动和组织了所有当前请求的数据,将它们连接到它们的原始会话,请求SQL文本以及运行查询的数据库。 对于本地服务器,我可以观察结果集中的两行。 一个是我当前的会话,另一个是我针对棒球统计数据库执行的一些查询:

A ton of data is returned, so much so that I had to cut off the results here. Included are metrics about the TSQL that is waiting, what is blocking it (if anything), the person running the query, the wait type, and much more! On a busy server, this list could become very long. As such, we’d benefit from adding some filters:
返回了大量的数据,以至于我不得不在这里截断结果。 其中包括有关正在等待的TSQL,阻止它(如果有的话),运行查询的人员,等待类型等等的度量标准! 在繁忙的服务器上,此列表可能会很长。 因此,我们将从添加一些过滤器中受益:
- Dm_exec_requests.wait_time: We probably only care about waits that are greater than a certain time. Maybe 1 second, 10 seconds, a minute, or more. That value depends on your server and the type of queries that run on it Dm_exec_requests.wait_time :我们可能只关心大于特定时间的等待。 可能是1秒,10秒,1分钟或更长时间。 该值取决于您的服务器及其上运行的查询的类型
- Dm_exec_requests.status: Filtering out status = ‘background’ probably makes sense here to remove any internal processes that you likely are not interested in Dm_exec_requests.status :在此处过滤掉status ='background'可能很有意义,以删除您可能不感兴趣的任何内部流程
- Databases.name: You may only care about certain databases or wish to remove system databases. Filter this column to remove master, model, msdb, and tempdb, which are likely databases you are not interested in tracking Databases.name :您可能只关心某些数据库或希望删除系统数据库。 过滤此列以删除master,model,msdb和tempdb,这可能是您不希望跟踪的数据库
- Dm_exec_requests.last_wait_type: Filter to remove wait types that you either are not interested in or already track via other means Dm_exec_requests.last_wait_type :过滤以删除您不感兴趣或已通过其他方式跟踪的等待类型
- Dm_exec_requests.command: This can be filtered to remove backups or other processes that you might not be interested in Dm_exec_requests.command :可以对此进行过滤以删除您可能不感兴趣的备份或其他进程
This data can get large, so you’ll want to consider a few options to ensure that it does not become too big:
这些数据可能会很大,因此您需要考虑一些选择,以确保它不会变得太大:
- Save only N days of data. Odds are wait stats older than a few weeks or months are not of much use to you anymore. If they are, consider offloading them to an archive table 仅保存N天的数据。 几周或几个月前的等待统计数据对您而言不再有用。 如果是这样,请考虑将它们卸载到存档表中
- Compress any tables that these database metrics are stored in. There is a ton of text included and it will compress quite nicely 压缩存储这些数据库指标的任何表。其中包含大量文本,并且压缩效果非常好
- Truncate SQL text. If seeing the first 1000 characters of a TSQL statement is enough to figure out where it is coming from, then you can truncate SQL text within this query to 1000 characters and eliminate the possibility that an extra-ugly query will regurgitate some 50,000 character SQL text 截断SQL文本。 如果看到TSQL语句的前1000个字符足以弄清楚它来自何处,则可以将此查询中SQL文本截断为1000个字符,并消除了过于丑陋的查询将重新显示50,000个字符SQL文本的可能性
- host_name or dm_exec_sessions中的 login_name in host_name或dm_exec_sessions. This can help remove noise from the results so that only what we need to see for a given application is saved. Alternatively, we could save everything and create views to help filter the data per application for us, if needed. That won’t save any space, but it would be convenient login_name列对其进行过滤。 这可以帮助消除结果中的噪音,从而仅保存我们需要查看给定应用程序的内容。 另外,如果需要,我们可以保存所有内容并创建视图以帮助为每个应用程序过滤数据。 那不会节省任何空间,但是会很方便
Waits data is what can ultimately tell us the culprit when faced with an app performance problem. More importantly, we can proactively monitor this data and alert on any wait time that is too high (based on the standards or baselines for your application). This may allow you to identify latency that has yet to manifest as a bug or outage. Once identified, it can be fixed without the need for an emergency, which will make any operations team smile!
等待数据是面对应用程序性能问题时最终可以告诉我们的罪魁祸首。 更重要的是,我们可以主动监视此数据,并在任何等待时间过长(基于您的应用程序的标准或基准)时发出警报。 这可能使您能够确定尚未表现为错误或中断的延迟。 一旦确定,就可以将其修复,而无需紧急处理,这会让任何运营团队微笑!
结论 (Conclusion)
A variety of database metrics and ideas were provided in this article. This is only the beginning, though! Depending on your application and database environments, you may have many other data points to add in. If you use AlwaysOn availability groups or replication, then tracking latency between primary and secondary servers would be very important in alerting on excessive latency. Once discovered, that latency could be traced to wait stats, IO, or other metrics that allow you to find the offending process.
本文提供了各种数据库指标和思想。 不过,这仅仅是开始! 根据您的应用程序和数据库环境,您可能还需要添加许多其他数据点。如果使用AlwaysOn可用性组或复制,则跟踪主服务器和辅助服务器之间的延迟对于警告过度延迟非常重要。 一旦发现,该延迟就可以追溯到等待状态,IO或其他允许您查找有问题的流程的指标。
Once we are tracking these database metrics, we can monitor, alert, trend, and crunch them to gain further insights. In the second part of this article, we will take what we have learned and apply it to answer more complex problems and make predictions that traditionally are not made using them!
跟踪这些数据库指标之后,我们可以对其进行监视,警报,趋势分析和处理,以获取更多的见解。 在本文的第二部分中,我们将学习到的知识并将其应用于回答更复杂的问题,并做出传统上不会使用它们做出的预测!
翻译自: https://www.sqlshack.com/database-metrics/
SQL Server数据库指标相关推荐
- 使用SQL Server数据库指标预测应用程序问题
摘要 (Summary) Database metrics can be collected, maintained, and used to help predict when processes ...
- Microsoft SQL Server数据库部署过程
介绍 (Introduction) Database deployments are critical tasks that can affect negative in on performance ...
- 如何使用SQL Server数据库实验助手(DEA)工具
介绍 (Introduction) This is my second article about Database Experimentation Assistant (DEA). Please r ...
- 如何下载和安装SQL Server数据库实验助手(DEA)
介绍 (Introduction) The Database Experimentation Assistant (DEA) is a new Experimental solution provid ...
- SQL Server数据库备份和还原报告
In the previous articles, we discussed several ways of taking backup and testing the restore process ...
- Debezium系列之:使用Debezium接入SQL Server数据库数据到Kafka集群的详细技术文档
Debezium系列之:使用Debezium接入SQL Server数据库数据到Kafka集群的详细技术文档 一.Debezium概述 二.SQL Server 连接器的工作原理 1.Snapshot ...
- SQL Server 数据库镜像
文章目录 故障转移群集技术 vs 日志传送技术 数据库镜像 vs 故障转移群集技术 数据库镜像 vs 日志传送技术 数据库镜像的设计目的 2.4.1 数据库镜像的基本概念 基本术语和角色 镜像数据库的 ...
- 聊一聊 SQL Server 数据库中的锁!
你知道的越多,不知道的就越多,业余的像一棵小草! 你来,我们一起精进!你不来,我和你的竞争对手一起精进! 编辑:业余草 来源:cnblogs.com/CoderAyu/p/11375088.html ...
- SQL Server 数据库备份
SQL Server 数据库备份 原文 http://www.cnblogs.com/ynbt/archive/2013/04/04/2999642.html 备份数据库是指对数据库或事务日志进行复制 ...
最新文章
- 9月推荐 | 从近1000篇Python文章中精选Top10
- 关于肠道菌群研究的7大事实和5大倡议
- 我看UNIX与Windows的本质区别
- FreeMarker 一二事 - 静态模板的使用与生成
- 黑马程序员-Java-面向对象篇上《二》
- Visual Studio中C++工程的环境配置方法
- c ++ 打印二进制_C / C ++中的二进制搜索树
- win10清理c盘_别再用什么管家!打开这个功能,Win10自动给你清垃圾
- ResNet18、50模型结构
- codeforces 1384A(构造)
- 贴片钽电容,P型 A型 B型 C型 D型 E型怎么区分?
- 城市内涝监测预警系统
- JPA中的could not initialize proxy - no Session异常分析与解决
- 蚂蚁金服在云原生架构下的可观察性的探索和实践
- 【流畅的Python学习笔记】2023.4.21
- 关于AD9361的配置与测试,万能测试模板
- win10笔记本:掉帧卡顿、开机后卡顿、玩游戏帧数低、GPU占用率上不去,解决办法
- 2.muduo之Channel
- PINN解偏微分方程实例3(Allen-Cahn方程)
- PMP需要提供什么资料来证明自己的项目管理经验